
Learn how to integrate React and D3.js to create responsive data visualizations (bar, pie, chloropeth), handle data loading, and manipulate elements.

Learn how to integrate React and D3.js to create responsive data visualizations (bar, pie, chloropeth), handle data loading, and manipulate elements.
We explore the most popular React chart libraries, looking at their key features, usage examples, and tips for choosing the right library

Christopher Vundi explains how to visualize data in a Vue project, using the popular D3.js library, which combines powerful visualization components and a data-driven approach to DOM manipulation.
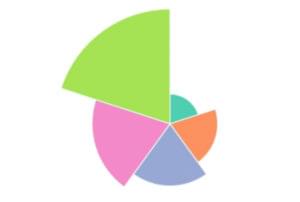
Adam Janes shows how to build a unique D3 example project, showcasing how each component adds up to make D3 a great data visualization library to learn.
Use React and D3.js to build declarative, reusable visualization components. Swizec Teller waxes lyrical about the benefits of combining these two libraries
From choosing the right data store to charting libraries, Brian Grieg introduces the tools, techniques, and concepts behind data management in JavaScript.

Mark Brown shows how to use this popular library to create different charts and graphs. Create D3.js data visualizations to render your app's dynamic data.

Kevin Kononenko introduces "data binding" or "data joins" in d3.js, explaining how data is tied to actual elements in the DOM.
Alexis Ulrich shows you how to create eye-catching data visualizations with dimple.js so your message stands out from today's mass of competing data streams
SignalR is a library for real time websocket communication. Louie Bacaj demonstrates how to leverage its power to build a service dashboard with AngularJS.
This article shows how D3.js can be using to create data driven directives in AngularJS applications.
This article looks at the creation of line and bar charts using the D3.js visualization library.
This article explores D3.js, a library used for manipulating documents based on data. This article teaches how to create bubble charts using D3.js.
This article introduces the D3 graphics library. This article shows how to create data driven graphics using D3.