Keep up to date on current trends and technologies
Design & UX - Design

How to Use Bannersnack to Generate Amazing Banners in Seconds
Gal Shachar
So, Do We Have a Winner for Code Challenge #1?
Alex Walker
15 Top Prototyping Tools Go Head-to-Head
Dave Kearney

Working with Design Thinking, Lean and Agile
Amanda Stockwell

5 Simple UX Principles to Guide your Product Design
Clark Wimberly

Customer Journey Maps: A Day in the Life of a Customer
Mads Soegaard
7 Awesome Wireframing Tools You Should Be Using
Daniel Schwarz

How to Speed Up Your UX with Skeleton Screens
Chris Lienert

Designing for Different Cultures with Location Demographics
Daniel Schwarz

Descriptive Analytics vs Diagnostic Analytics
Daniel Schwarz
A Designer’s Guide to KPIs and Vanity Metrics
David Attard

An Introduction to Grid Systems in Web Design
Callum Hopkins

8 Tips for Improving Bootstrap Accessibility
Rhiana Heath
Why I Love Bootstrap, and Why You Should Too
Syed Fazle Rahman

5 A/B Testing Tools for Making Data-driven Design Decisions
Jamie Murphy
How to Track Ecommerce Transactions with Google Analytics
Craig Buckler

7 Analytics Tools for Optimizing UX
Jon MacDonald

How to Boost UX with Analytics and Customer Journey Mapping
Vincent Feeney
How to Track JavaScript and Ajax Events with Google Analytics
Craig Buckler

Google Analytics: How to Perform User Research
Luke Hay

5 Myths About Data-driven Design
Daniel Schwarz

UX Analytics: What They Are, and Why They Matter
Daniel Schwarz

Automate CI/CD and Spend More Time Writing Code
Cormac Foster

Designing Form Layout: Color
Jessica Enders

Designing Form Layout: Spacing
Jessica Enders

Designing Form Layout: Alignment
Jessica Enders

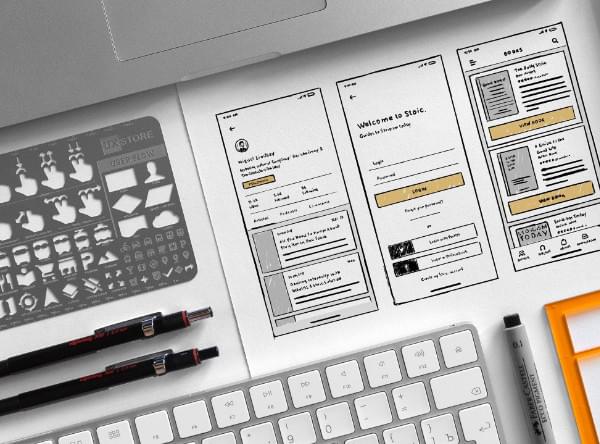
How to Make Paper Prototypes
Ben Coleman

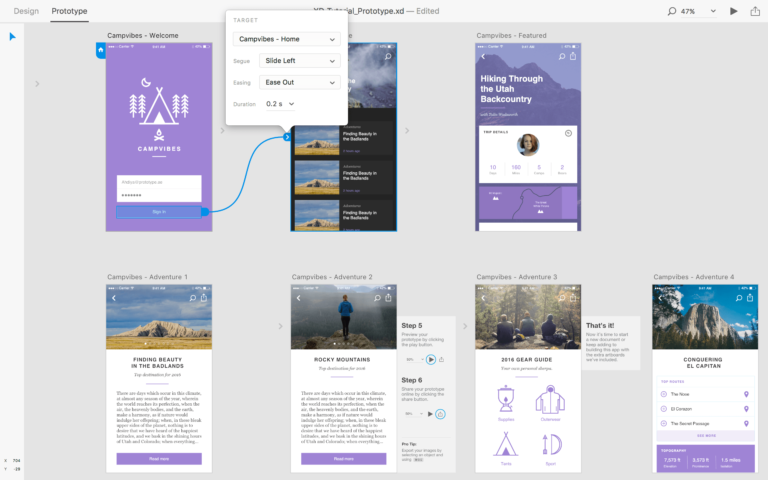
How to Prototype Interactions with Adobe XD
Daniel Schwarz

UX: What Can We Prototype? What Can’t We Prototype?
Dan Goodwin

How to Use Adobe XD’s Smart Guides
Daniel Schwarz

120+ Places To Find Creative Commons Media
Adrian Sandu

How to Design Highly Memorable Experiences, and Why
Vincent Feeney
Showing 64 of 761