
Key Takeaways
- Analytics tools are essential for optimizing your website’s user experience (UX), as they allow you to get insights into user behavior, identify areas that need improvement, and make data-driven decisions.
- There is no one-size-fits-all tool for improving UX; often a combination of different tools is needed. These may include website usage analytics like Google Analytics, heatmap analytics such as Hotjar or Crazy Egg, real-time analytics like Clicky or Chartbeat, and advanced customer analytics tools like Kissmetrics.
- While each tool has its unique strengths and features, the choice of tool should be based on your specific needs, goals, and the type of data you need to collect. For instance, if content marketing is crucial for your business, Chartbeat may be the right tool, while for deep customer data analysis, Kissmetrics could be the best choice.
This popular article was updated in late 2017 to reflect the latest UX analytics tools and practices.
Analytics are important for finding out what’s working and what’s not working on your website. In short, they allow you to see user feedback at scale — via users’ actual clicks and movements. This is essential for improving your website’s UX, and in turn, conversions.
However, when it comes to improving user experiences, there’s no specific tool you should be using. It’s like saying “What utensil is best for baking?” In the case of UX (and baking), there’s no single answer, and there are many tools that you can choose from to help you analyze UX.
Often enough, it requires a combination of tools.
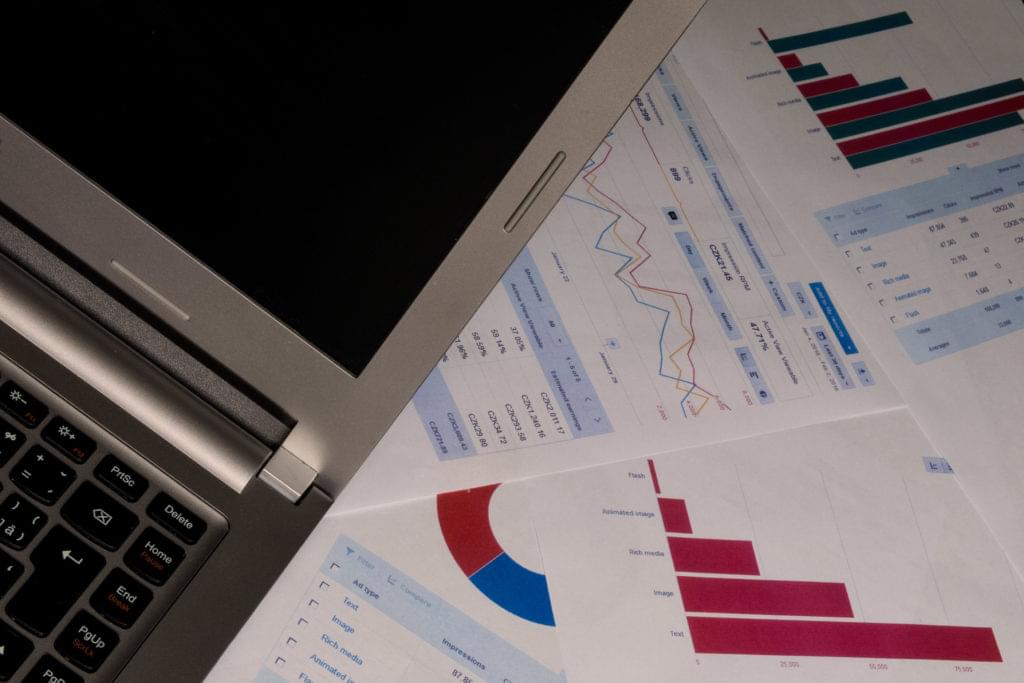
In this article, I’ll round up the best analytics tools to help you analyze and optimize your user experiences. I’ll also reference a few tutorials that you might find useful along the way, to help you get started with these tools.
Website Usage Analytics
Let’s start with web analytics. These tools are most effective at measuring key metrics like conversion rates, bounce rates, user demographics, user behavior, most visited web pages and more. We typically use these tools for user research and to identify areas with poor UX, but we can also use them as a diving board for usability testing and A/B testing later on.
1. Google Analytics
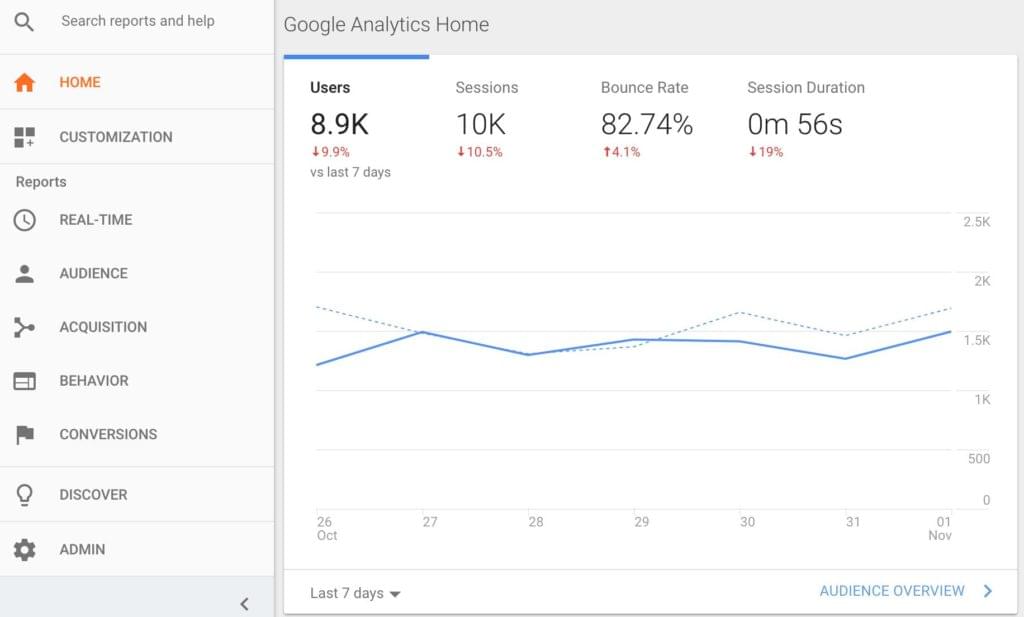
Google Analytics is the Old Faithful when it comes to monitoring and evaluating how users are behaving on your site. You can see, slice and filter hundreds of data points, from bounce rate to exit rate, to average conversion rate to conversion value. It also integrates with your funnel, helping you identify the loops, drop-offs and critical UX flaws.
It’s also useful for user research, helping you to identify the who and why, as well as the where. It’s a fantastic way to start out with analytics, especially when its offering is rather generous for a free tool.
2. Adobe Analytics
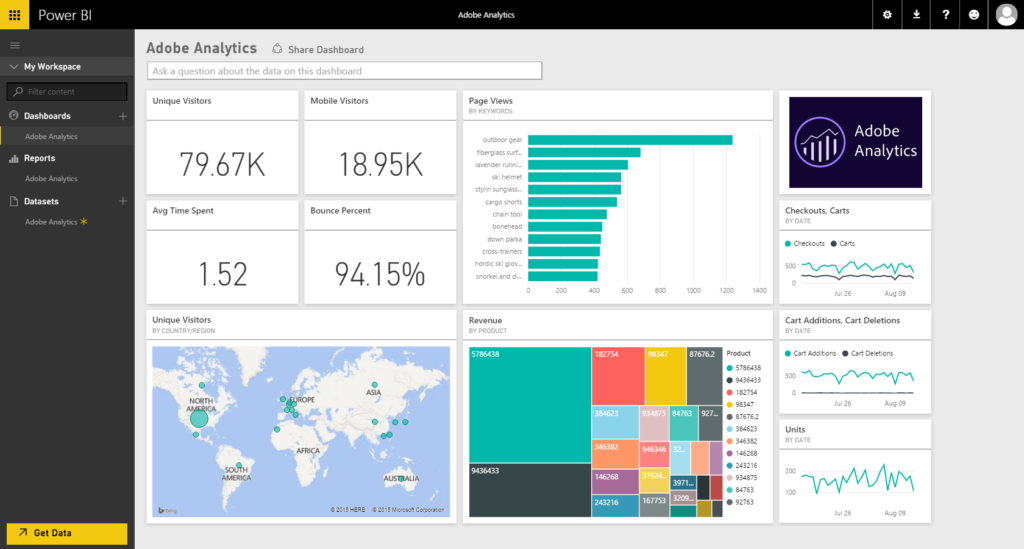
Although nothing compares to Google Analytics in terms of number of users, Adobe Analytics is nonetheless a compelling choice amongst website and app analysis tools. It allows you to dig deep into the massive amounts of generated data, featuring things like customer segmentation, real-time analysis rules, marketing analytics, and a host of dashboards. Adobe Analytics is a decent tool for understanding what’s happening on your site, and the user interface is much less intimidating than Google Analytics.
Heatmap Analytics
Heatmap analytics display an aggregated overview of visitor movement on your website by measuring user clicks and user movements. They can offer insight into whether visitors are noticing important CTAs or headlines, or whether your forms and navigations are working effectively.
3. Hotjar
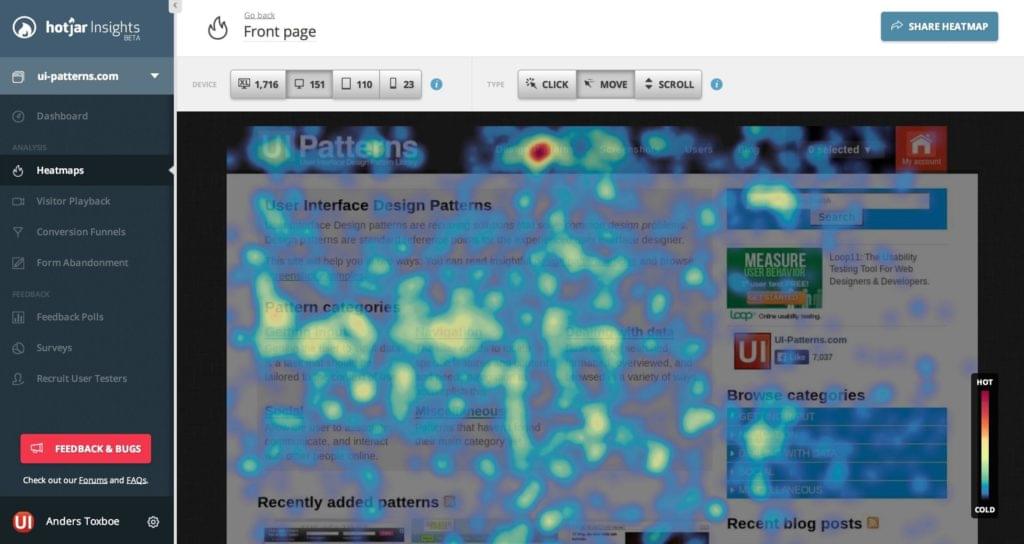
Hotjar uses heatmaps to help you visualize how users are navigating your website, showing you what they click on exactly. It shows you how effective your funnels are, and with a host of other tools such as the ability to create customer surveys, it has quickly become a mainstream choice for usability testing. Hotjar can also take screen recordings of your visitors, allowing you to see exactly how they navigate through your site.
Fullstory is a similar alternative. (Check out their “Rage Grade” features that detect when users have moments of rage clicking!)
4. Crazy Egg

Like Hotjar, Crazy Egg gives you a visual representation of how visitors are interacting with your site. Using heatmaps, clickmaps and scrollmaps combined with traditional analytics and A/B testing features, it’s a terrific way to make your usability testing more data-driven and actionable.
If usability testing is about identifying exactly what’s going wrong, then A/B testing can allow you to try out multiple solutions side by side.
Crazy Egg offers all this in a single app.
Real-time Analytics
Real-time analytics, like the name suggests, focuses on live insights into website performance. One of the biggest benefits of real-time analytics is that they can help you catch bugs (because, let’s face it, users hate bugs). Bugs hinder the user experience, and users won’t stick around while you fix them. It’s best to catch them early so there’s no decline in conversions.
5. Clicky
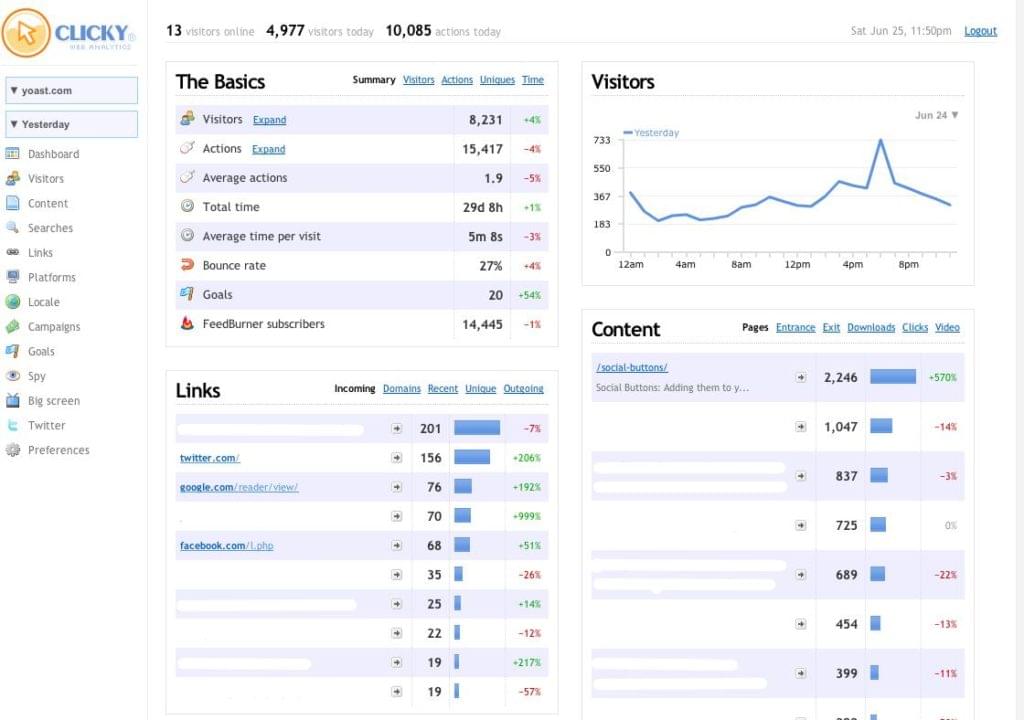
Clicky is a hybrid of Google Analytics, Adobe Analytics and Hotjar. It boasts real-time analytics, allowing you to see exactly what’s happening on your website as it’s happening. It also offers heatmaps, clickmaps, traffic reports and more, but with a focus on what’s happening right now, so that you can react quickly to spikes in traffic or a sudden drop in conversions.
6. Chartbeat
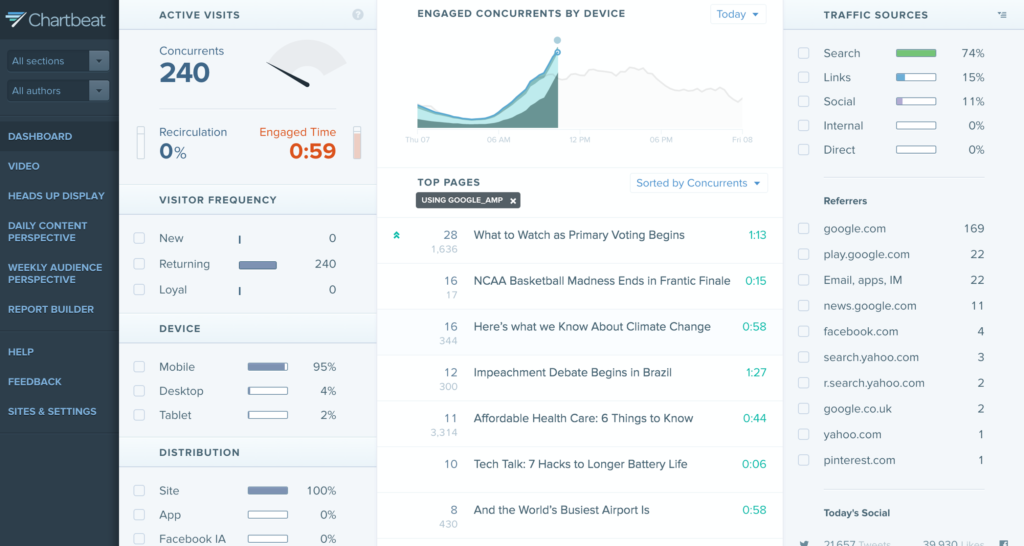
Chartbeat focuses heavily on content analysis, enabling you to make deep dives into what your users want, what articles they want to read, what products they want to buy, what videos are generating the most interest, and to optimize your website’s user experience for more engagement.
Additionally, it features tools to help you improve click-through rates and headline analytics. So if content marketing is your bread and butter, Chartbeat is the tool for you. If content is what users are coming for, Chartbeat can help you remove friction like navigating, filtering and searching, by showing you what you should have on the front line.
Advanced Customer Analytics
Advanced customer analytics help you dive a little deeper into your website statistics, segmenting online activity on an individual customer level, and in some cases they’ll allow you to trigger automated actions based on site activity. These tools are super helpful for when you want to map out and track your marketing funnel in greater detail.
7. Kissmetrics
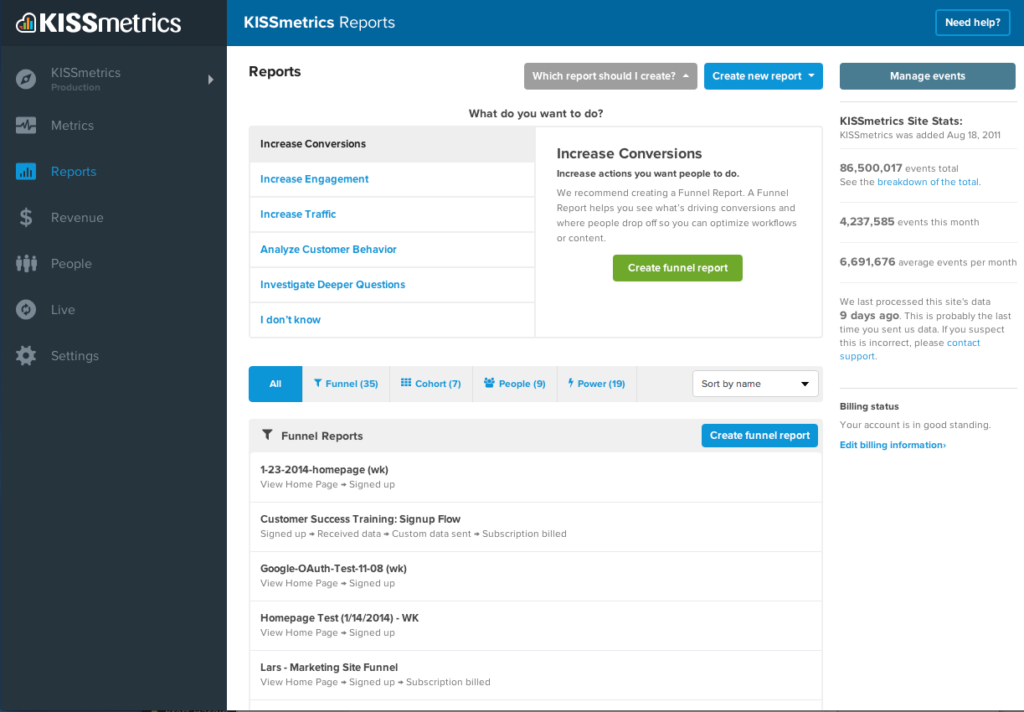
Kissmetrics is a fantastic tool for combing through your customer data. Their tools allow you to monitor your KPIs, find leaky points in your funnel, track any and all activity on a product or page, establish A/B tests, and a large number of other customer analysis functions. Kissmetrics also integrates with your email service to help you significantly improve your email marketing campaigns. Although Kissmetrics is somewhat advanced and caters heavily to marketers, it works well for large organizations.
HubSpot and Mixpanel are two alternatives worth checking out as well.
Conclusion
In order to optimize your website’s UX (and also marketing efforts) for maximum conversions, you need to know how your website is being used, and by whom. Unfortunately, there’s no one-size-fits-all tool that does it all. Rather, you need to use a collection of KPI tracking, heatmap, real-time, and/or advanced customer analytics tools to really identify what’s going wrong. By bringing these tools together, you can get the full picture of what’s really happening with the users on your website, and make data-driven decisions on how to overcome the UX flaws that you have.
You can’t manage what you don’t measure. These analytics tools make it easier to do the measuring.
Frequently Asked Questions (FAQs) about Analytics Tools for Optimizing UX
What are some of the best alternatives to Google Analytics for optimizing UX?
There are several alternatives to Google Analytics that can be used for optimizing UX. Some of the top ones include Hotjar, Matomo, and SEMrush. These tools offer a variety of features such as heatmaps, session recordings, and conversion funnels that can provide valuable insights into user behavior and help improve the user experience.
How can analytics tools help in optimizing UX?
Analytics tools can provide valuable insights into how users interact with your website. They can show you where users are clicking, how long they are staying on your site, and which pages they are visiting. This information can help you identify areas of your website that need improvement and optimize them for a better user experience.
Can I use multiple analytics tools at the same time?
Yes, you can use multiple analytics tools at the same time. Each tool has its own strengths and weaknesses, and using more than one can give you a more comprehensive view of your website’s performance and user behavior.
Are there any free analytics tools available?
Yes, there are several free analytics tools available. Some of these include Google Analytics, Matomo (in its basic version), and Open Web Analytics. However, keep in mind that these free versions may have limitations in terms of features and data storage.
How do I choose the right analytics tool for my website?
Choosing the right analytics tool for your website depends on your specific needs and goals. Consider factors such as the size of your website, the type of data you need to collect, your budget, and the specific features you need.
What is a heatmap and how can it help in optimizing UX?
A heatmap is a graphical representation of data where values are depicted by color. In the context of website analytics, heatmaps can show you where users are clicking or scrolling on your website. This can help you understand what elements of your website are attracting user attention and which ones are being ignored.
How can I use analytics data to improve my website’s conversion rate?
Analytics data can provide insights into user behavior on your website. By understanding where users are dropping off in the conversion funnel, you can identify areas of your website that need improvement. You can then make changes to these areas to improve the user experience and increase your conversion rate.
Can analytics tools track mobile users?
Yes, most analytics tools can track mobile users. They can provide insights into how mobile users interact with your website, which can help you optimize your website for mobile devices.
How can I ensure the privacy of my users when using analytics tools?
When using analytics tools, it’s important to respect user privacy. Make sure to anonymize user data, use cookies responsibly, and comply with all relevant privacy laws and regulations. Some analytics tools offer features that help ensure user privacy, such as IP anonymization and opt-out options for users.
How often should I check my analytics data?
How often you should check your analytics data depends on your specific needs and goals. However, it’s generally a good idea to check your data regularly to keep track of your website’s performance and make necessary adjustments. Some businesses check their data daily, while others do it weekly or monthly.