


Key Takeaways
- Google Analytics is a valuable tool for user research, providing objective, data-driven insights into user behavior, demographics, and device usage. This information can inform design decisions and help create more effective user personas.
- The geographical location and language of users can influence design considerations, such as payment options and color choices. These factors also affect the translation of words and the layout of different alphabets.
- Demographic information from Google Analytics can help identify potential accessibility issues and ensure that usability testing groups reflect the core audience. Similarly, data on browsers and devices can inform functionality testing and potentially reveal insights about user behavior and requirements.
- Google Analytics data should be used in conjunction with other research methods, such as user interviews and usability testing, to provide a more complete picture of user behavior. This data can also be used to back up arguments for stakeholders who prioritize quantitative data.
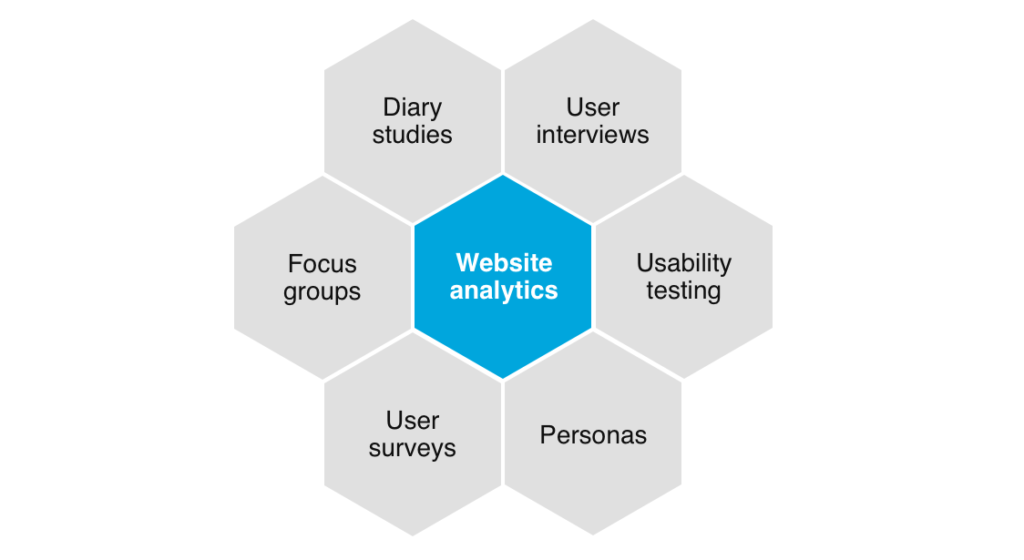
Knowing who your users are is crucial to any design process, and user research plays a vital role in that. User research consists of a whole range of different tools and techniques, but what underpins them all is gathering useful information about who your users are and what they want to achieve. When you know what they want to achieve, you can help them achieve it.
Research isn’t only about asking users what they like or hate, but establishing cold, hard facts about them (for example, age and gender demographics, or what browser/device they’re using). We can use analytics to source these facts, so that we can base our design decisions on objective truths.
In this article, I’ll give you some tips on how your analytics data can support and inform your user research, using Google Analytics as the tool of choice for carrying out this research. The data that you source from Google Analytics is no substitute for in-depth user research, but taking an analytics-first approach to research will help you build strong foundations.
If you’d rather take a step back and learn a little more about Google Analytics first, then check out my article on getting started with Google Analytics.
Analytics-first: How It Works
There’s no singular method for approaching user research. You can approach user research in different ways, so the method may change depending on the client or scenario. I like to take an analytics-first approach to UX design, using data from Google Analytics as a starting point for the research process.
Google Analytics data can be used at the start of your process to get a rough idea of the types of users visiting your website. It can then be used to help you create detailed user personas, and to analyze the behavior of those different user types. Analytics will tell you what visitors are doing on your app or website, but it can also be used to find out information about them as people.
With this information, your design then has a direction.
Let’s take a look at some Google Analytics reports that are really useful for starting off the user research process. It’s important to know that you shouldn’t use any of this data in isolation to make UX decisions. Your Google Analytics data should be used as a jumping off point for additional research, rather than a basis for your design decisions. This additional research can take the form of user interviews, user surveys, usability testing, and so on.
Language and Location
Language and Location reports can be found under the Geo sub-section of the Audience reports. The geographical location of your users may alert you to any cultural factors that you should be aware of when designing.
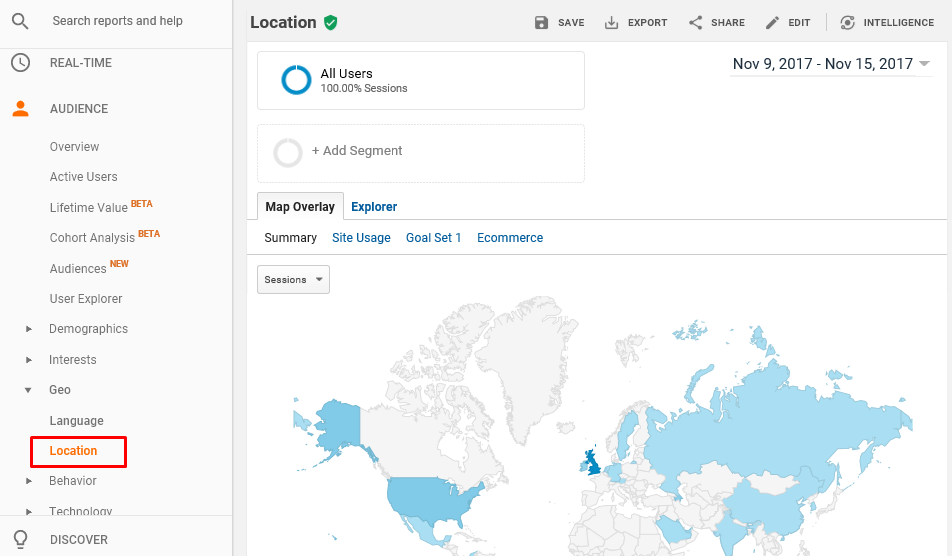
For example, around 58% of German shoppers pay by invoice for online purchases, so if you manage an ecommerce website and you notice you’re getting a lot of German visitors, you may want to consider whether your payment options are suitable enough. Also, in many Asian cultures, the color red means “good luck”, while in the West it’s associated with “error”, so analytics can alert you to any critical UX flaws like that.
Language can also impact your visual design, as the length of words will change when translated, so you may end up with strange-looking call-to-action buttons in certain languages. Different alphabets will also have an impact. For example, the Chinese alphabet is made up of thousands of characters, and Arabic is read from right-to-left. Factors like these will have an impact on your layouts.
Demographics
Demographics information can be found in Google Analytics under the Audience section as well. These reports will tell you, with an 80%–90% degree of accuracy, the ages and genders of your users.
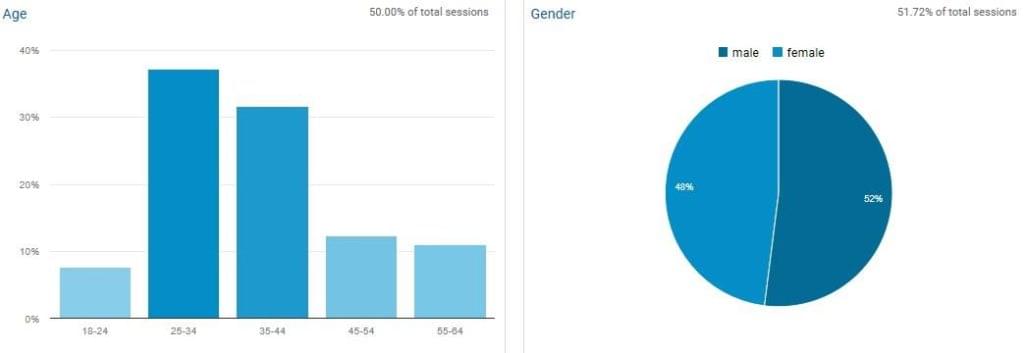
From different ages and genders, it’s important to look at the differences in user behavior as well as the number of visits. You may notice a big difference in conversion rates between older and younger users, and this may be something you go on to investigate in more detail using more qualitative research methods. Maybe there’s an accessibility issue for older users?
Demographics are also useful for recruiting usability testers and subjects for user interviews. For example, if you notice that 80% of your users are female, then you’ll want to ensure that women make up the majority of your usability testing group, to ensure quality responses that reflect your core audience.
Browsers and Devices
Browser and Device reports in Google Analytics, found within the Audience section also, are used mostly for functionality testing. Analysts will often look at which browsers their visitors are using, and then implement testing on the most commonly used ones, to ensure their website renders correctly for the majority of users before anything else.
However, these reports can also reveal hidden secrets about your users. For example, higher income households are more than three times as likely to have a tablet than lower income households, so you may want to investigate whether your tablet users are more affluent, and if so, what that means about their behavior and requirements. You’ll also want to consider how device usage of your audience will impact on your approach to responsive design.
As with all data, though, it’s important not to rely on stereotypes. Further research is required to validate any findings.
Benchmarking
Benchmarking reports can be found in the Audience section. They aim to compare your website to similar websites for certain demographics. Although they aren’t as useful as they could be (due to the limitations on the type of data that’s shared), benchmarking reports do still have their uses.
I often use these reports for comparing device-type breakdown. Looking at the breakdown of mobile, tablet and desktop for a website compared to similar websites gives an idea the type of users they’re attracting.
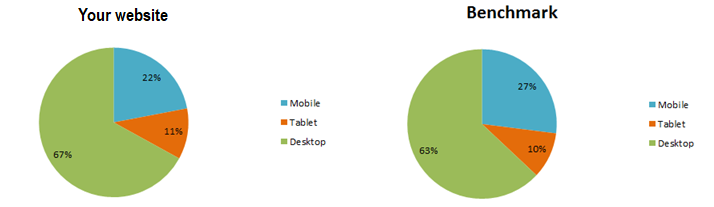
In the example above, we can see that our users are less likely to be on mobile than our competitors. This tells us what is happening, but we need to undertake other forms of research to find out why this might be happening.
Frequency and Recency
Frequency and Recency reports are found in the Behavior section of the Audience reports. These reports tell you the difference in behavior between New and Returning visitors, as well as show how frequently they visit.

Frequency and Recency data can offer insights into user behavior. For example, if you notice that users are visiting your website several times on the same day, this may suggest they’re comparing your prices to your competitors’ before making a decision on who to purchase from.
You can use this data to create segments for better analyzing your users’ behavior. You may want to create groups of “new visitors”, “returning visitors” and “regular visitors”. This will enable you to compare the user journeys of first-time visitors with those of your most loyal visitors. We’ll take a closer look at segmentation in the next article.
Time of Day
Time of Day information can be very difficult to find in Google Analytics. To see Time of Day data, the best method is to create custom reports and include hour as your primary dimension. You can use your new Time of Day report to better understand the context in which users are engaging with your website, and then to begin to explain the different behaviors.
Time of Day can indicate likely location. For example, if users are on mobile in the morning, there’s a decent chance they’ll be commuting, while tablet use in the evening is more likely to indicate that the user is at home.
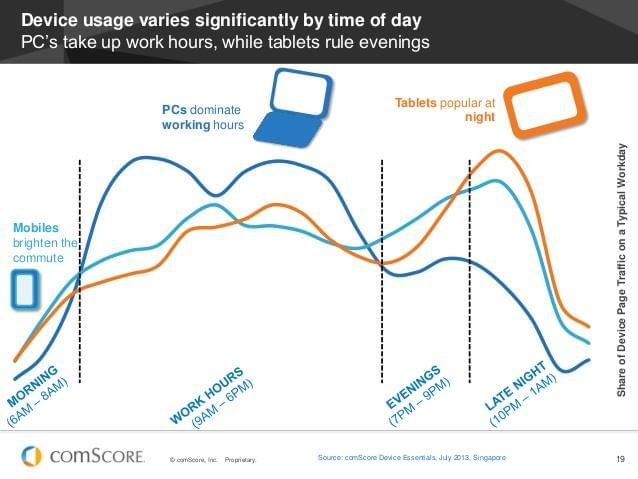
You’ll want to talk to your users to validate these assumptions, but the data here can ensure that you start asking the right questions.
Traffic Source
Channel reports can be found in the Acquisition section of Google Analytics. These reports are regularly used by marketers to report back on the ROI of advertising campaigns, but the channel that visitors come in from can potentially tell you something about their intent too.
Visits that happen via Paid Search will include keywords that can tell you what the user was looking for when they arrived on your website. Users arriving via campaigns, such as email marketing, will already be familiar with your brand and are likely to have different goals than first time visitors.
Knowing what users are looking for when they reach a certain web page will help you prioritize certain content, and design a user journey that’s geared towards helping them convert, or to achieve their intended goal.
Conclusion
The data in these reports lays the foundation for an analytics-first approach to UX design, but we need to incorporate other forms of user research in order to get a more complete picture of how our users are behaving. There are three ways that Google Analytics data can help inform your user research. Google Analytics helps with the following:
-
Informing usability testing and user interviews. Data from your device, country and demographic reports will help you decide which users to test on which devices.
-
Persona creation and analysis. Use the reports which give you indications about who your users are to feed into your research to create personas. These can then be created as segments in Google Analytics and analyzed.
-
Convincing stakeholders. You can use your Google Analytics data to back up your argument for clients who are more interested in quantitative data over qualitative data.
Now that you know how Google Analytics can be used for user research, the next article in our Google Analytics series will show you how to use this data to find potential problem areas on your website and improve user experience.
Frequently Asked Questions (FAQs) on Google Analytics User Research
What is the Importance of User Research in Google Analytics?
User research in Google Analytics is crucial as it provides insights into how users interact with your website. It helps you understand your audience’s behavior, preferences, and needs. This information is vital in making informed decisions to improve your website’s user experience, increase engagement, and ultimately, drive conversions. User research can reveal patterns and trends that can guide your marketing strategies, content creation, and website design.
How Can I Set Up Google Analytics for User Research?
Setting up Google Analytics for user research involves several steps. First, you need to create a Google Analytics account and set up a property for your website. Then, you’ll need to add the tracking code to your website. Once this is done, you can set up goals to track specific user interactions. You can also set up segments to analyze specific groups of users and create custom reports to focus on the data that matters most to you.
How Can I Use Google Analytics to Improve User Experience?
Google Analytics provides a wealth of data that can be used to enhance user experience. For instance, you can use the Behavior Flow report to understand how users navigate through your site and identify any potential roadblocks. The Site Speed report can help you identify pages that are loading slowly and may be causing users to leave. Additionally, the Mobile Overview report can show you how your site performs on different devices, helping you optimize for mobile users.
What are the Key Metrics to Track in Google Analytics for User Research?
Key metrics to track in Google Analytics for user research include bounce rate, pages per session, average session duration, and conversion rate. These metrics can give you a clear picture of user engagement and the effectiveness of your site in meeting user needs. Additionally, tracking metrics like the source/medium can help you understand where your traffic is coming from, while demographic data can provide insights into your audience.
How Can I Use Google Analytics to Understand User Behavior?
Google Analytics offers several reports that can help you understand user behavior. The Behavior Flow report shows the path users take through your site, while the Content Drilldown report can show you which pages are most popular. Event tracking can help you understand how users interact with specific elements on your site, such as buttons or forms. Additionally, cohort analysis can help you understand the behavior of specific groups of users over time.
How Can I Use Google Analytics to Conduct User Research for E-commerce?
For e-commerce sites, Google Analytics provides specific reports like the E-commerce Overview report, which gives a snapshot of your store’s performance. The Shopping Behavior report can show you how users move through your shopping funnel, while the Checkout Behavior report can help identify where users are abandoning their carts. Additionally, the Product Performance report can show you which products are selling well and which aren’t.
How Can I Use Google Analytics to Conduct User Research for Content Sites?
For content sites, Google Analytics can provide insights into which content is most popular, how users are finding your content, and how they’re interacting with it. The All Pages report can show you which pages are most viewed, while the Landing Pages report can show you where users are entering your site. Additionally, the Behavior Flow report can help you understand how users are navigating through your site.
How Can I Use Google Analytics to Conduct User Research for Mobile Apps?
Google Analytics for Firebase provides specific tools for conducting user research for mobile apps. You can track events to understand how users are interacting with your app, use audiences to segment your users, and create funnels to understand the user journey. Additionally, you can use crash reporting to identify and fix issues that may be affecting user experience.
How Can I Use Google Analytics to Conduct User Research for SaaS Products?
For SaaS products, Google Analytics can provide insights into user behavior, engagement, and retention. You can track events to understand how users are using your product, use cohorts to analyze user retention, and set up goals to track conversions. Additionally, the User Explorer report can provide detailed insights into individual user behavior.
How Can I Use Google Analytics to Conduct User Research for Non-profits?
For non-profits, Google Analytics can provide insights into how users are interacting with your site and which content is most effective. You can use the All Pages report to see which pages are most viewed, the Behavior Flow report to understand how users navigate through your site, and the Goals report to track conversions. Additionally, the Demographics and Interests reports can provide insights into your audience.