
This is a special post that I made just to help out those who are struggling to get your graphs working properly.
I start off with a discussion of PHP and MySQL. If you really struggled through those parts of this series, take some time to review this section. Some of it’s repeating older sections, but now that you’ve actually done this, you will likely have some epiphanies about how and why this process works.
Next, I cover some basic troubleshooting. Many of you will find yourself staring at a blank screen. This is usually due to one of several very specific issues that we can work through.
In the final part of this series, you can really drill into how to style the graphs with our own brand colors, shadows, and other tweaks.
PHP/MySQL Tips for Beginners:
If you’re new to PHP and MySQL, you may wonder what those words with a dollar sign mean. If you paste this code into an editor that supports code checking, you’ll see that it changes those words to a different color.
Those are variables and a critical piece of the PHP/MySQL puzzle. Let’s look at the $wpuser variable. At the top of the file, we go through a little song and dance to find who is the currently logged in user. In short, the variable on the left of the equals sign “gets” whatever is on the right side of the equal sign.
So the $current_user variable “gets” whatever the current user logged in using some code that’s built into WordPress – wp_get_current_user();. This code returns lots of information in an array, which would look like a table of information. One of the rows in this array is the user’s login ID.
So, we are able to assign $wpuser the login ID using the code $current_user->user_login. You can assign it several other things, but we just want the user_login for now.
Variables are the safest way to pass information within PHP around. You can pass variables outside of a function so that other code can use it – even JavaScript!
Adding the Function to the Plugin File
If you were following along in the previous parts of this series, you may already have done this part. In WordPress, go over to your “Plugins” > “Editor,” and select Flot for WordPress as the plugin you want to edit.
Also in previous posts, we created a simple form for adding content to a custom table using phpMyAdmin. I including that PHP file in this. Add the include call at the bottom of the file:
[sourcecode language=”php”]
/*
Here’s where you add your custom files for pulling and adding data
Remember that you can NOT use a URL to point to any files you want to
include. You have to use a PATH. So you can stick these files anywhere
you want in your WP install, just use a PATH to point to them.
The plugin_dir_path call will use a PATH from the WP wp-content/plugins
folder: http://codex.wordpress.org/Function_Reference/plugin_dir_path
*/
include ( plugin_dir_path( __FILE__ ) . ‘flot/custom_workout.php’);
include ( plugin_dir_path( __FILE__ ) . ‘flot/pushups_results.php’);
[/sourcecode]
We already had the custom_workout.php file in there, so just add the include for the pushups_results.php file. Now, all you have to do is drop the shortcode [pushups_results_sc] anywhere you want it, and you’re done!
Troubleshooting
The first thing you’re all going to run into is a big, blank screen. The first thing to check is that your placeholder div is wrapped in a div with both height and width defined. Customize this to fit your WordPress post width. But, if you see a blank screen, this is usually the culprit.
I didn’t take a lot of time here to discuss the details of the pushups_results.php file — the code used to display graph results. I’m expecting you to go through the comments. Even for novice developers, you should be able to have enough information that you can Google answers beyond what I’ve included here and in the comments of the code.
To start graphing data from a different data set isn’t too tough:
- Plug in your own database connection info
- Change the queries to match your database
- Change the variables in the JavaScript to match your database calls
That’s it! Rinse and repeat for all the graphs you can imagine.
Rounding Out the Functionality
I went ahead and made a tool for users to be able to delete records and I wanted to combine the “Add Pushups” functionality with the graph. So do the following to quickly add a complete pushup tracker tool:
- Create a new post and call it Pushups Tracker
- Add the following shortcodes to the post:
- [pushups_sc]
- [pushups_results_sc]
- [pushups_records_sc]
- Publish it
- include ( plugin_dir_path( __FILE__ ) . ‘flot/pushups_records.php’);
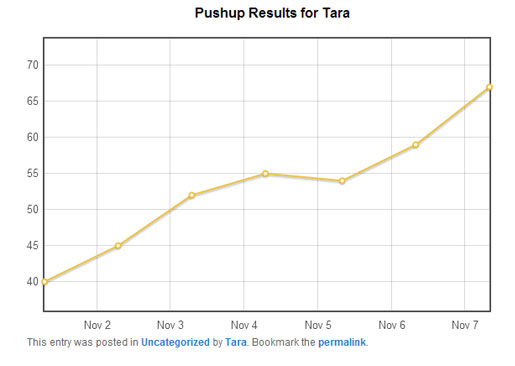
I’m really thrilled to see what you all are going to come up with! Don’t forget that you can call data from anywhere to make your graphs work. It’s really just limited by your imagination. Check out the pushups_results.php file for one way to get data into your page and to call the Flot graphs.
Now go forth and make data interesting. You have the power!
In the final section of this series, I’ll go into the details of how to customize the graphs so you can match colors and other design elements to your brand. Flot has a load of features for customizing charts and graphs, but they’re not very intuitive. That’s where I come in to help!
Frequently Asked Questions on Responsive Real-Time Graphs in WordPress
How can I integrate real-time graphs into my WordPress site?
Integrating real-time graphs into your WordPress site involves a few steps. First, you need to install a suitable plugin that supports real-time data visualization. There are several plugins available, such as WP Live Statistics, which can be installed directly from the WordPress plugin directory. Once installed, you can configure the plugin settings according to your needs. Some plugins may require you to insert a shortcode into your posts or pages to display the graphs.
What are the benefits of using real-time graphs on my WordPress site?
Real-time graphs provide a dynamic way to present data on your website. They can make complex data more understandable and engaging for your visitors. Real-time graphs can be particularly useful for displaying live statistics, such as website traffic, sales data, or social media engagement. They can help to increase user engagement and provide valuable insights for your visitors.
Can I customize the appearance of the real-time graphs?
Yes, most real-time graph plugins for WordPress offer a range of customization options. You can typically change the colors, labels, and layout of the graphs to match your website’s design. Some plugins also allow you to choose from different graph types, such as line graphs, bar charts, or pie charts. Check the plugin’s documentation for detailed instructions on how to customize your graphs.
How can I ensure that my real-time graphs are responsive?
To ensure that your real-time graphs are responsive, you should choose a plugin that supports responsive design. This means that the graphs will automatically adjust to fit different screen sizes, making them accessible to users on both desktop and mobile devices. You can also use CSS to further customize the responsiveness of your graphs.
Are there any performance considerations when using real-time graphs?
Real-time graphs can potentially impact the performance of your website, as they require regular updates to display the latest data. However, most plugins are designed to minimize this impact by using efficient data retrieval and rendering techniques. You can also optimize performance by limiting the amount of data displayed on each graph and ensuring that your web hosting plan can handle the additional load.
Can I use real-time graphs to display data from external sources?
Yes, many real-time graph plugins for WordPress support data integration from external sources. This can be useful for displaying data from social media platforms, analytics tools, or other third-party services. You will typically need to provide the URL or API key for the data source in the plugin settings.
How can I troubleshoot issues with my real-time graphs?
If you encounter issues with your real-time graphs, there are several steps you can take to troubleshoot. First, check the plugin’s documentation for any known issues or solutions. If the issue persists, try deactivating and reactivating the plugin, or reinstalling it completely. You can also contact the plugin’s support team for assistance.
Can I display multiple real-time graphs on the same page?
Yes, most real-time graph plugins for WordPress allow you to display multiple graphs on the same page. You can typically do this by inserting multiple shortcodes into your post or page. Each shortcode will correspond to a different graph, allowing you to display a variety of data in a visually engaging way.
How can I update the data displayed on my real-time graphs?
The data displayed on your real-time graphs will typically update automatically, based on the settings you configure in the plugin. Some plugins allow you to set the update frequency, so you can choose how often the data is refreshed. If you are displaying data from an external source, the plugin will usually retrieve the latest data each time the graph is updated.
Are there any security considerations when using real-time graphs?
When using real-time graphs on your WordPress site, it’s important to consider security. If you are displaying sensitive data, make sure to use a plugin that supports secure data transmission. You should also keep your plugin up to date to ensure that you are protected against any known security vulnerabilities.