How to Process Server Logs


Key Takeaways
- ELK Stack Integration: The ELK Stack, comprising Elasticsearch, Logstash, and Kibana, is essential for centralizing and analyzing logs from multiple sources, making it easier to find correlations and perform deep data analysis.
- Installation and Configuration: Setting up the ELK Stack involves installing Java, Elasticsearch, Logstash, and Kibana, with each component requiring specific configurations for optimal performance and security.
- Log Shipping and Management: Using Logstash to ship Apache logs into Elasticsearch enables centralized log management, allowing for efficient data indexing and retrieval.
- Advanced Log Analysis: Kibana facilitates advanced log analysis techniques, such as creating visualizations and performing detailed searches, which are crucial for monitoring and troubleshooting applications.
- Scalability and Accessibility: The ELK Stack’s scalability makes it suitable for handling large volumes of data from multiple PHP applications, providing a robust solution for real-time application monitoring and performance optimization.
When things go south with our applications — as they sometimes do, whether we like it or not — our log files are normally among the first places where we go when we start the troubleshooting process. The big “but” here is that despite the fact that log files contain a wealth of helpful information about events, they are usually extremely difficult to decipher.
A modern web application environment consists of multiple log sources, which collectively output thousands of log lines written in unintelligible machine language. If you, for example, have a LAMP stack set up, then you have PHP, Apache, and MySQL logs to go through. Add system and environment logs into the fray — together with framework-specific logs such as Laravel logs — and you end up with an endless pile of machine data.
Talk about a needle in a haystack.
![]()
The ELK Stack (Elasticsearch, Logstash, and Kibana) is quickly becoming the most popular way to handle this challenge. Already the most popular open-source log analysis platform — with 500,000 downloads a month, according to Elastic — ELK is a great way to centralize logs from multiple sources, identify correlations, and perform deep-data analysis.
Elasticsearch is a search-and-analytics engine based on Apache Lucene that allows users to search and analyze large amounts of data in almost real time. Logstash can ingest and forward logs from anywhere to anywhere. Kibana is the stack’s pretty face — a user interface that allows you to query, visualize, and explore Elasticsearch data easily.
This article will describe how to set up the ELK Stack on a local development environment, ship web server logs (Apache logs in this case) into Elasticsearch using Logstash, and then analyze the data in Kibana.
Installing Java
The ELK Stack requires Java 7 and higher (only Oracle’s Java and the OpenJDK are supported), so as an initial step, update your system and run the following:
sudo apt-get install default-jre
Installing ELK
There are numerous ways of installing the ELK Stack — you can use Docker, Ansible, Vagrant, Microsoft Azure, AWS, or a hosted ELK solution — just take your pick. There is a vast number of tutorials and guides that will help you along the way, one being this ELK Stack guide that we at Logz.io put together.
Installing Elasticsearch
We’re going to start the installation process with installing Elasticsearch. There are various ways of setting up Elasticsearch but we will use Apt.
First, download and install Elastic’s public signing key:
wget -qO - https://packages.elastic.co/GPG-KEY-elasticsearch | sudo apt-key add -
Next, save the repository definition to /etc/apt/sources.list.d/elasticsearch-2.x.list:
echo "deb http://packages.elastic.co/elasticsearch/2.x/debian stable main" | sudo tee -a /etc/apt/sources.list.d/elasticsearch-2.x.list
Last but not least, update the repository cache and install Elasticsearch:
sudo apt-get update && sudo apt-get install elasticsearch
Elasticsearch is now installed. Before we continue to the next components, we’re going to tweak the configuration file a bit:
sudo nano /etc/elasticsearch/elasticsearch.yml
Some common configurations involve the restriction of external access to Elasticsearch, so data cannot be hacked or deleted via HTTP API:
network.host: localhost
You can now restart Elasticsearch:
sudo service elasticsearch restart
To verify that Elasticsearch is running properly, query the following URL using the cURL command:
sudo curl 'http://localhost:9200'
You should see the following output in your terminal:
{
  "name" : "Jebediah Guthrie",
  "cluster_name" : "elasticsearch",
  "version" : {
    "number" : "2.3.1",
    "build_hash" : "bd980929010aef404e7cb0843e61d0665269fc39",
    "build_timestamp" : "2016-04-04T12:25:05Z",
    "build_snapshot" : false,
    "lucene_version" : "5.5.0"
  },
  "tagline" : "You Know, for Search"
}
To make the service start on boot, run:
sudo update-rc.d elasticsearch defaults 95 10
Installing Logstash
Logstash, the “L” in the “ELK Stack”, is used at the beginning of the log pipeline, ingesting and collecting data before sending it on to Elasticsearch.
To install Logstash, add the repository definition to your /etc/apt/sources.list file:
echo "deb http://packages.elastic.co/logstash/2.2/debian stable main" | sudo tee -a /etc/apt/sources.list
Update your system so that the repository will be ready for use and then install Logstash:
sudo apt-get update && sudo apt-get install logstash
We’ll be returning to Logstash later to configure log shipping into Elasticsearch.
Installing Kibana
The final piece of the puzzle is Kibana – the ELK Stack’s pretty face. First, create the Kibana source list:
echo "deb http://packages.elastic.co/kibana/4.5/debian stable main" | sudo tee -a /etc/apt/sources.list
Then, update and install Kibana:
sudo apt-get update && apt-get install kibana
Configure the Kibana configuration file at /opt/kibana/config/kibana.yml:
sudo vi /opt/kibana/config/kibana.yml
Uncomment the following lines:
server.port: 5601
server.host: “0.0.0.0”
Last but not least, start Kibana:
sudo service kibana start
You can access Kibana in your browser at http://localhost:5601/ (change the URL if you’re using a VM like Homestead Improved to whichever host/port you configured):
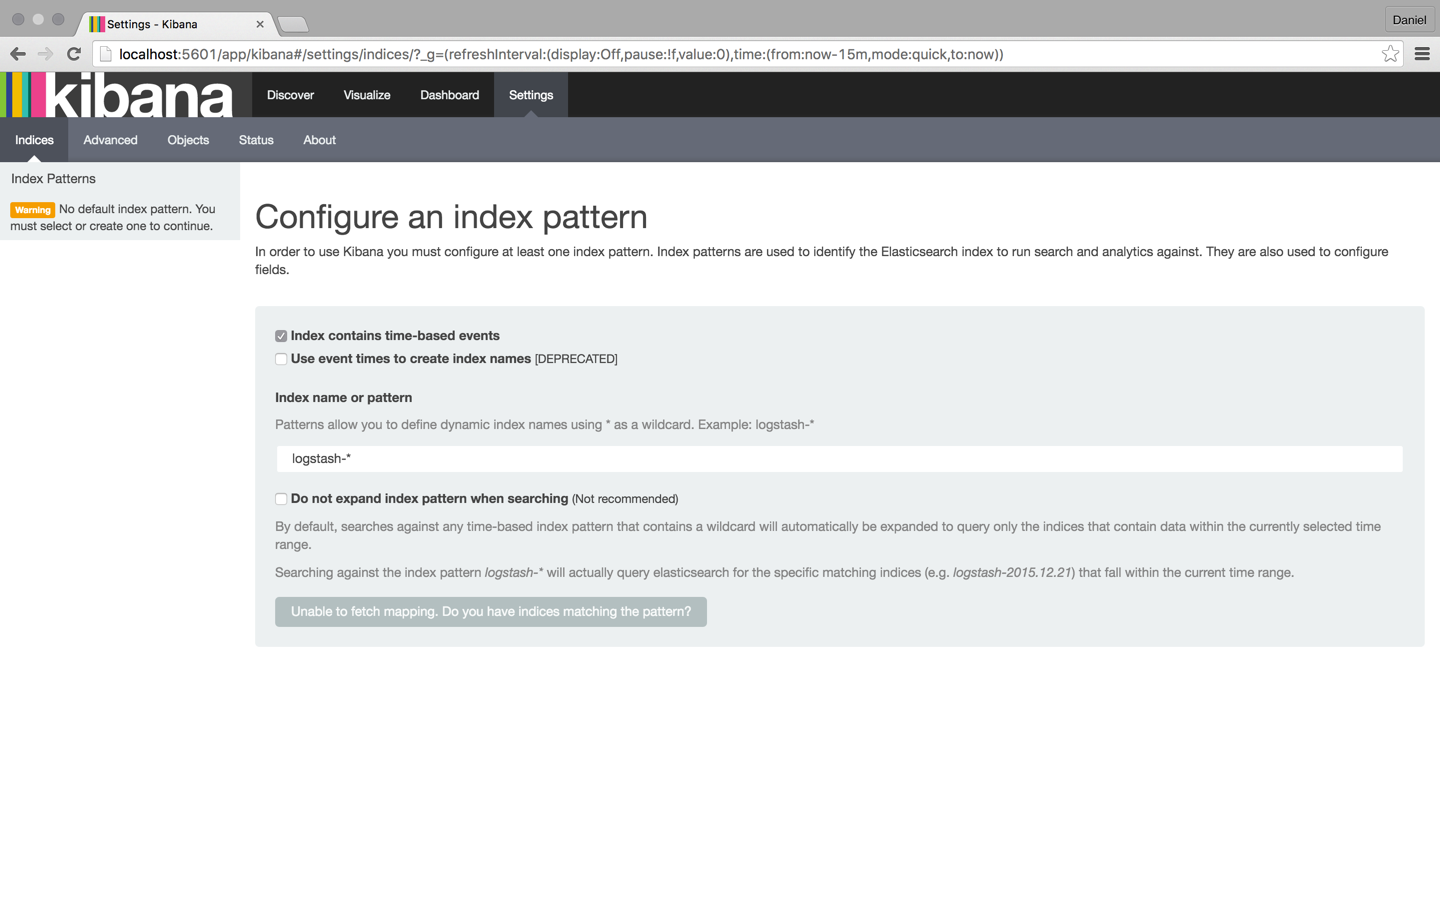
To start analyzing logs in Kibana, at least one index pattern needs to be defined. An index is how Elasticsearch organizes data, and it can be compared to a database in the world of RDBMS, with mapping defining multiple types.
You will notice that since we have not yet shipped any logs, Kibana is unable to fetch mapping (as indicated by the grey button at the bottom of the page). We will take care of this in the next few steps.
Tip: By default, Kibana connects to the Elasticsearch instance running on localhost, but you can connect to a different Elasticsearch instance. Simply modify the Elasticsearch URL in the Kibana configuration file that you had edited earlier and then restart Kibana.
Shipping Logs
Our next step is to set up a log pipeline into Elasticsearch for indexing and analysis using Kibana. There are various ways of forwarding data into Elasticsearch, but we’re going to use Logstash.
Logstash configuration files are written in JSON format and reside in /etc/logstash/conf.d. The configuration consists of three plugin sections: input, filter, and output.
Create a configuration file called apache-logs.conf:
sudo vi /etc/logstash/conf.d/apache-logs.conf
Our first task is to configure the input section, which defines where data is being pulled from.
In this case, we’re going to define the path to our Apache access log, but you could enter a path to any other set of log files (e.g. the path to your PHP error logs).
Before doing so, however, I recommend doing some research into supported input plugins and how to define them. In some cases, other log forwarders such as Filebeat and Fluentd are recommended.
The input configuration:
input {
    file {
        path => "/var/log/apache2/access.log"
        type => "apache-access"
    }
}
Our next task is to configure a filter.
Filter plugins allow us to take our raw data and try to make sense of it. One of these plugins is grok — a plugin used to derive structure out of unstructured data. Using grok, you can define a search and extract part of your log lines into structured fields.
filter {
  if [type] == "apache-access" {
    grok {
      match => { "message" => "%{COMBINEDAPACHELOG}" }
    }
  }
}
The last section of the Logstash configuration file is the Output section, which defines the location to where the logs are sent. In our case, it is our local Elasticsearch instance on our localhost:
output {
    elasticsearch {}
}
That’s it. Once you’re done, start Logstash with the new configuration:
/opt/logstash/bin/logstash -f /etc/logstash/conf.d/apache-logs.conf
You should see the following JSON output from Logstash indicating that all is in order:
{
        "message" => "127.0.0.1 - - [24/Apr/2016:11:41:59 +0000] \"GET / HTTP/1.1\" 200 11764 \"-\" \"curl/7.35.0\"",
       "@version" => "1",
     "@timestamp" => "2016-04-24T11:43:34.245Z",
           "path" => "/var/log/apache2/access.log",
           "host" => "ip-172-31-46-40",
           "type" => "apache-access",
       "clientip" => "127.0.0.1",
          "ident" => "-",
           "auth" => "-",
      "timestamp" => "24/Apr/2016:11:41:59 +0000",
           "verb" => "GET",
        "request" => "/",
    "httpversion" => "1.1",
       "response" => "200",
          "bytes" => "11764",
       "referrer" => "\"-\"",
          "agent" => "\"curl/7.35.0\""
}
Refresh Kibana in your browser, and you’ll notice that the index pattern for our Apache logs was identified:
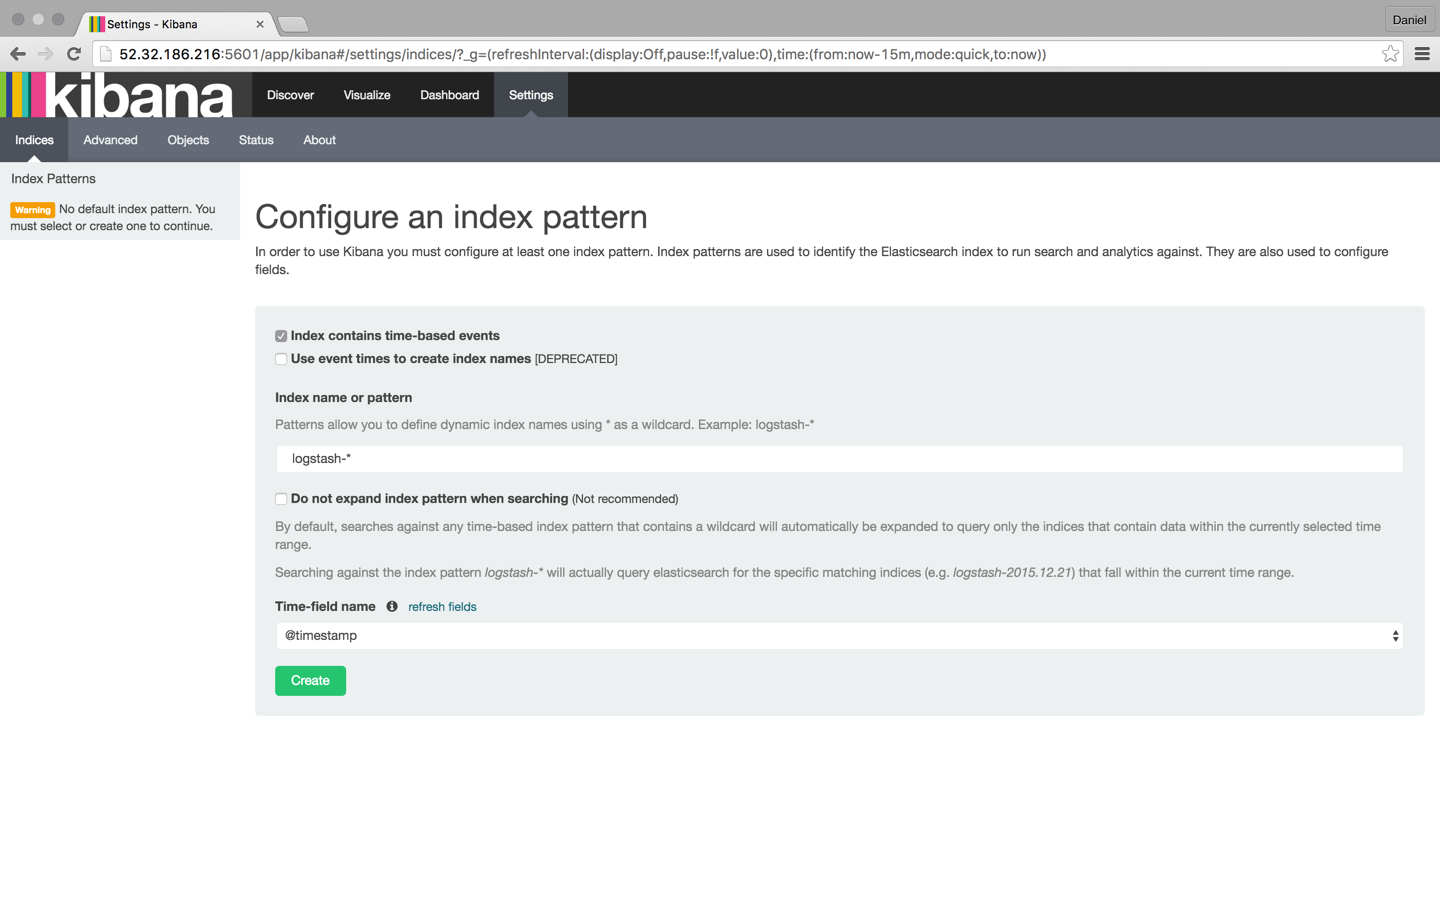
Click the Create button, and then select the Discover tab:
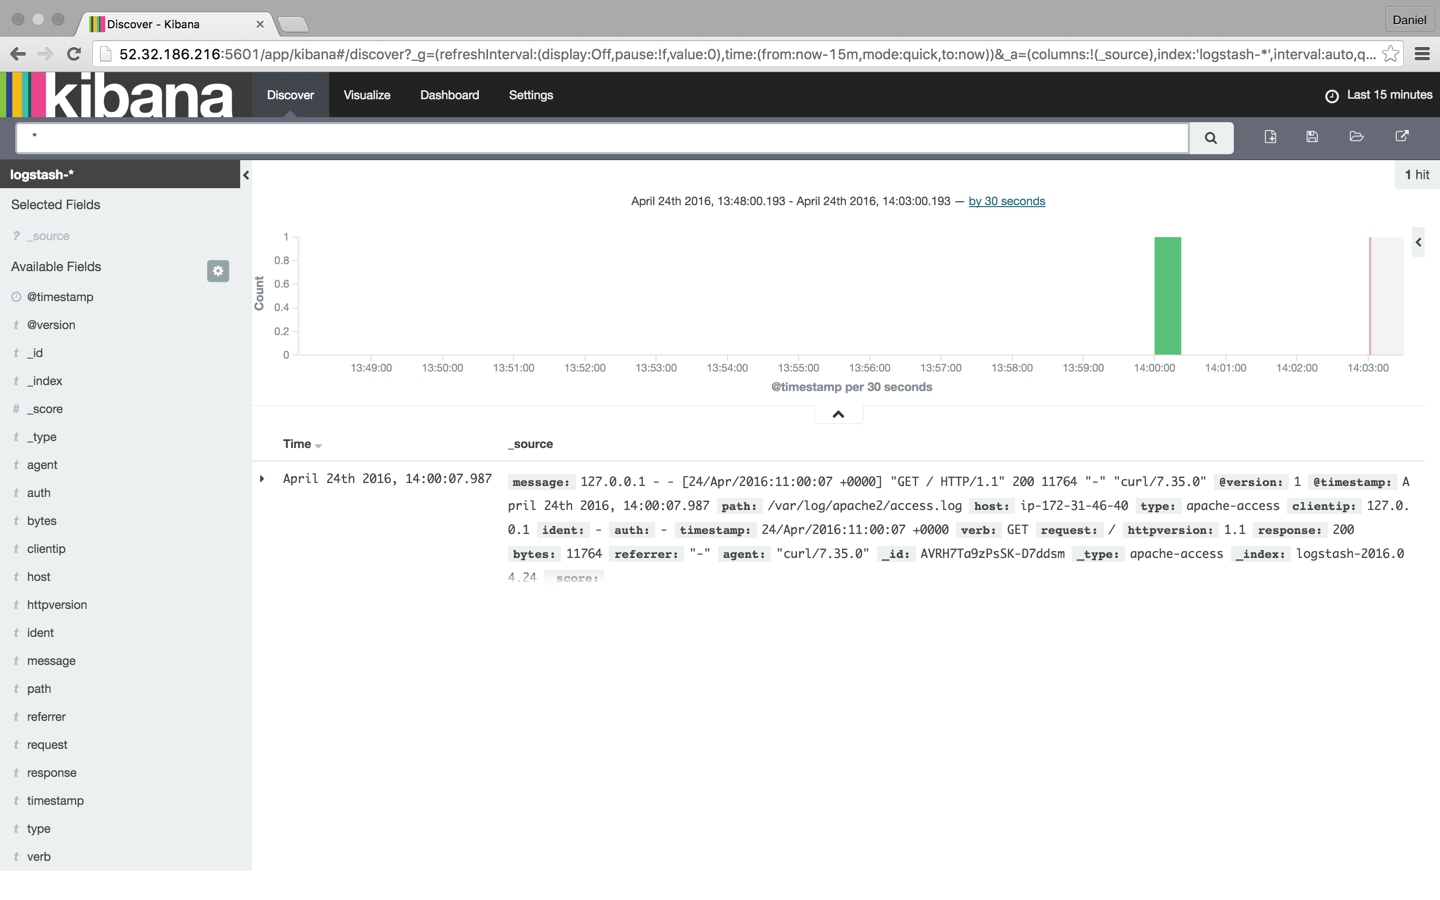
From this point onwards, Logstash is tailing the Apache access log for messages so that any new entries will be forwarded into Elasticsearch.
Analyzing Logs
Now that our pipeline is up and running, it’s time to have some fun.
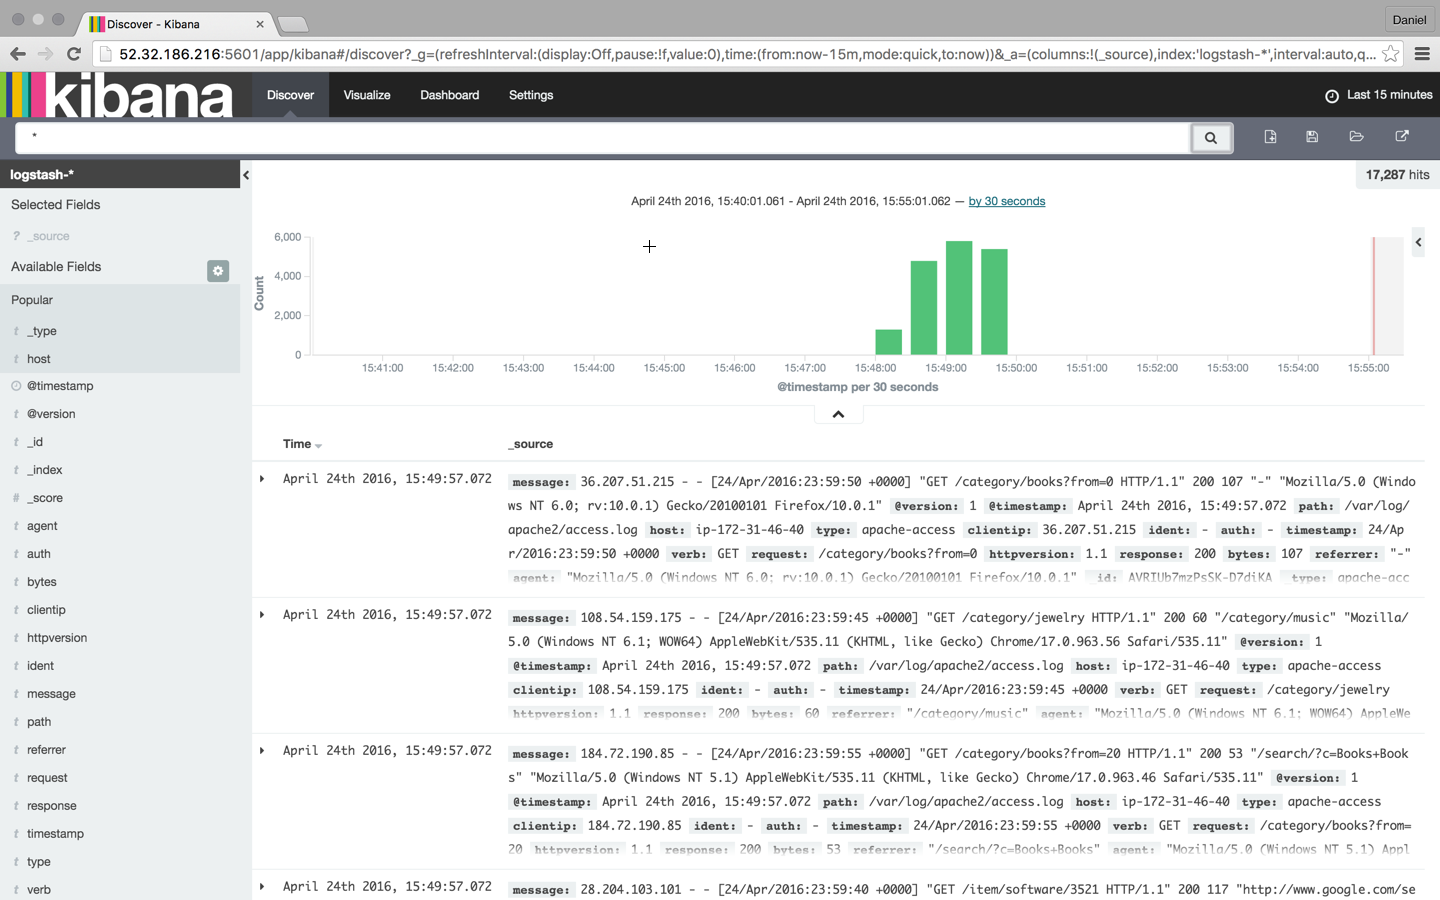
To make things a bit more interesting, let’s simulate some noise on our web server. To do this I’m going to download some sample Apache logs and insert them into the Apache access log. Logstash is already tailing this log, so these messages will be indexed into Elasticsearch and displayed in Kibana:
wget http://logz.io/sample-data
sudo -i
cat /home/ubuntu/sample-data >> /var/log/apache2/access.log
exit
Searching
Searching is the bread and butter of the ELK Stack, and it’s an art unto itself. There is a large amount of documentation available online, but I thought I’d cover the essentials so that you will have a solid base from which to start your exploration work.
Let’s start with some simple searches.
The most basic search is the “free text” search that is performed against all indexed fields. For example, if you’re analyzing web server logs, you could search for a specific browser type (searching is performed using the wide search box at the top of the page):
Chrome
It’s important to note that free text searches are NOT case-sensitive unless you use double quotes, in which case the search results show exact matches to your query.
“Chrome”
Next up are the field-level searches.
To search for a value in a specific field, you need to add the name of the field as a prefix to the value:
type:apache-access
Say, for example, that you’re looking for a specific web server response. Enter response:200 to limit results to those containing that response.
You can also search for a range within a field. If you use brackets [], the results will be inclusive. If you use curly braces {}, the results will exclude the specified values in the query.
Now, it’s time to take it up a notch.
The next types of searches involve using logical statements. These are quite intuitive but require some finesse because they are extremely syntax-sensitive.
These statements include the use of the Boolean operators AND, OR, and NOT:
type:apache-access AND (response:400 OR response:500)
In the above search, I’m looking for Apache access logs with only a 400 or 500 response. Note the use of parentheses as an example of how more complex queries can be constructed.
There are many more search options available (I recommend referring to Logz.io’s Kibana tutorial for more information) such as regular expressions, fuzzy searches, and proximity searches, but once you’ve pinpointed the required data, you can save the search for future reference and as the basis to create Kibana visualizations.
Visualizing
One of the most prominent features in the ELK Stack in general and Kibana in particular is the ability to create beautiful visualizations with the ingested data. These visualizations can then be aggregated into a dashboard that you can use to get a comprehensive view of all the various log files coming into Elasticsearch.
To create a visualization, select the Visualize tab in Kibana:
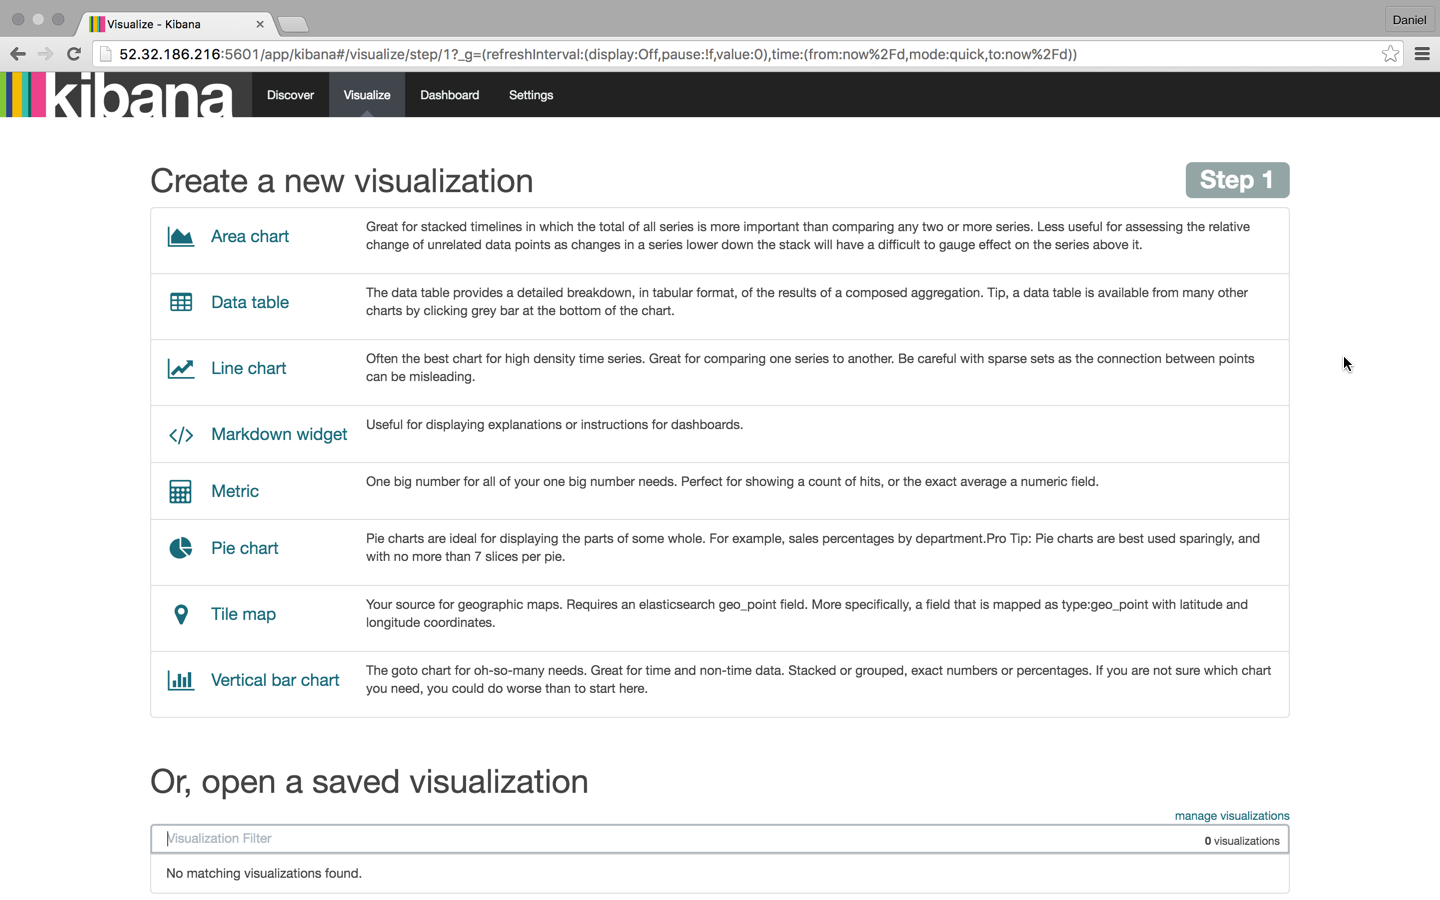
There are a number of visualization types that you can select, and which type you will choose will greatly depend on the purpose and end-result you are trying to achieve. In this case, I’m going to select the good ol’ pie chart.
We then have another choice — we can create the visualization from either a saved search or a new search. In this case, we’re going with the latter.
Our next step is to configure the various metrics and aggregations for the graph’s X and Y axes. In this case, we’re going to use the entire index as our search base (by not entering a search query in the search box) and then cross reference the data with browser type: Chrome, Firefox, Internet Explorer, and Safari:
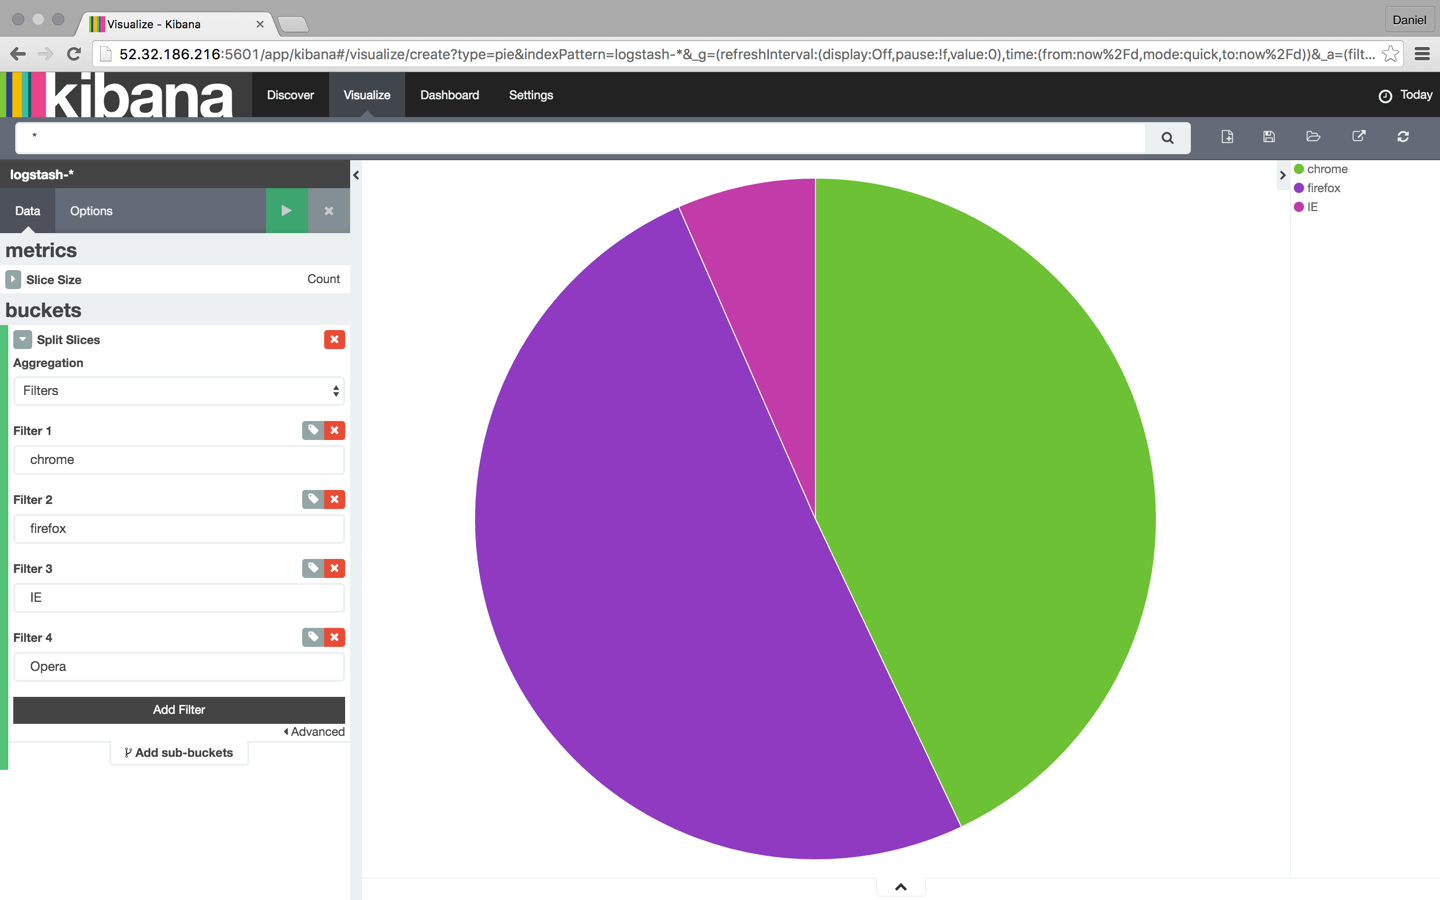
Once you are finished, save the visualization. You can then add it to a custom dashboard in the Dashboard tab in Kibana.
Visualizations are incredibly rich tools to have, and they are the best way to understand the trends within your data.
Conclusion
The ELK Stack is becoming THE way to analyze and manage logs. The fact that the stack is open source and that it’s backed by a strong community and a fast growing ecosystem is driving its popularity.
DevOps is not the sole realm of log analysis, and ELK is being used by developers, sysadmins, SEO experts, and marketers as well. Log-driven development — the development process in which code is monitored using metrics, alerts, and logs — is gaining traction within more and more R&D teams, and it would not be a stretch of the imagination to tie this to the growing popularity of ELK.
Of course, no system is perfect and there are pitfalls that users need to avoid, especially when handling big production operations. But this should not deter you from trying it out, especially because there are numerous sources of information that will guide you through the process.
Good luck, and happy indexing!
This article was peer reviewed by Christopher Thomas, Younes Rafie, and Scott Molinari. Thanks to all of SitePoint’s peer reviewers for making SitePoint content the best it can be!
Frequently Asked Questions (FAQs) about Monitoring PHP Apps with ELK Stack
What is the ELK Stack and how does it work?
The ELK Stack is a collection of three open-source products: Elasticsearch, Logstash, and Kibana, all developed, managed and maintained by Elastic. Elasticsearch is a NoSQL database that is based on the Lucene search engine. Logstash is a log pipeline tool that accepts inputs from various sources, executes different transformations, and exports the data to various targets. Kibana is a visualization layer that works on top of Elasticsearch. These three tools are primarily used for log and event data management within an IT environment. They work together to provide an end-to-end stack that delivers actionable insights in real-time from almost any type of structured and unstructured data source.
How can I use the ELK Stack to monitor PHP applications?
The ELK Stack can be used to monitor PHP applications by collecting, analyzing, and visualizing the application’s log data. Logstash can collect and parse the log data from the PHP application, Elasticsearch can index and store this data, and Kibana can visualize the data in a user-friendly format. This allows you to monitor the performance of your PHP applications in real-time and identify any potential issues or bottlenecks.
What are the benefits of using the ELK Stack for PHP application monitoring?
The ELK Stack provides several benefits for PHP application monitoring. It allows for real-time analysis and visualization of PHP application logs, which can help in identifying and resolving issues faster. It also provides a centralized platform for log data management, which can simplify and streamline the process of log monitoring. Additionally, the ELK Stack is highly scalable and can handle large volumes of data, making it suitable for large-scale PHP applications.
How can I set up the ELK Stack for PHP application monitoring?
Setting up the ELK Stack for PHP application monitoring involves several steps. First, you need to install and configure Elasticsearch, Logstash, and Kibana on your server. Then, you need to configure your PHP application to send log data to Logstash. This can be done by using a PHP logging library that supports Logstash. Once the log data is being sent to Logstash, you can configure Elasticsearch to index this data and Kibana to visualize it.
Can the ELK Stack handle the monitoring of multiple PHP applications?
Yes, the ELK Stack can handle the monitoring of multiple PHP applications. Logstash can collect log data from multiple sources, and Elasticsearch can index and store this data separately for each application. This allows you to monitor the performance of each of your PHP applications individually, while still using a single, centralized platform for log data management.
What kind of data can I monitor with the ELK Stack in my PHP application?
With the ELK Stack, you can monitor a wide range of data from your PHP application. This includes application logs, server logs, error logs, access logs, and any other type of log data that your application generates. You can also monitor application performance metrics, such as response times, request rates, and error rates.
How can I use Kibana to visualize my PHP application data?
Kibana provides a user-friendly interface for visualizing your PHP application data. You can create various types of visualizations, such as charts, graphs, and maps, to represent your data. You can also create dashboards to combine multiple visualizations and provide a comprehensive view of your application’s performance.
How does the ELK Stack help in troubleshooting PHP applications?
The ELK Stack can help in troubleshooting PHP applications by providing real-time insights into the application’s performance and behavior. By analyzing and visualizing the application’s log data, you can identify any anomalies or issues that may be causing problems. This can help you pinpoint the root cause of issues and resolve them more quickly.
Is the ELK Stack suitable for large-scale PHP applications?
Yes, the ELK Stack is highly scalable and can handle large volumes of data, making it suitable for large-scale PHP applications. Elasticsearch, the database component of the stack, is designed to be distributed and can scale horizontally to handle increasing data volumes. Logstash and Kibana can also scale to handle large amounts of data.
Can I integrate the ELK Stack with other monitoring tools?
Yes, the ELK Stack can be integrated with a wide range of other monitoring tools. This includes application performance monitoring (APM) tools, network monitoring tools, and server monitoring tools. This allows you to use the ELK Stack as part of a comprehensive monitoring solution for your PHP applications.
Product Evangelist at Logz.io. Author and blogger. Write about PHP, ELK, Log Analytics and BigData. Family man, runner and Liverpool FC fan.

Published in
·Design Patterns·Libraries·Miscellaneous·Patterns & Practices·Performance·Performance & Scaling·PHP·September 9, 2015

Published in
·automation·Debugging & Deployment·Development Environment·Libraries·Patterns & Practices·PHP·Standards·Testing·September 26, 2016