Adding Analytics to a React Native App
Analytics help developers understand how users are using their apps and if features or improvements are worth spending valuable time on. Most native platforms have options built in, but what about cross-platform development tools such as React Native? Unsurprisingly there are many options available and in this article, I’ll look at adding analytics to a React Native app with Segment.io and Keen.io.
I will assume that you already have an experience in creating React Native apps (If you don’t here’s SitePoint’s quick start guide), so will only show how to setup the app and explain the code specific to analytics. I’ll focus on Android in this tutorial but the process for iOS should be similar. You can find the full source code on GitHub.
Key Takeaways
- Utilize Segment.io and Keen.io to aggregate and analyze analytics data from a React Native app, providing a streamlined approach to collect data across various platforms including mobile apps and websites.
- Set up the analytics integration by registering accounts on Segment.io and Keen.io, linking them together, and configuring settings like Geo IP Addon and UserAgent Addon for enhanced data collection.
- Implement analytics in your React Native app by installing necessary packages, linking them to your Android project, and configuring the app to send data using the Segment.io API.
- Understand user interactions within the app by using the analytics setup to track actions like favorites, bookmarks, and shares on a simple gallery app, without requiring a user login system.
- Analyze the collected data using Keen.io’s dashboard, enabling queries and data exploration to understand user behavior and app performance in detail.
What is Segment.io and Keen.io?
Segment.io is a service that lets you aggregate analytics data from your websites, mobile apps, and email campaigns and send them automatically to the different services that you use. It provides a single API which you can use to collect analytics data on any platform (e.g. mobile app, website, Sendgrid, Stripe). For example, if you want to gain insight into payment data from Stripe, connect it to your Segment.io account so that every time someone pays you via Stripe, it is automatically informed and sends the corresponding data to your selected data warehouse.
Keen.io is one of the services you can integrate with Segment.io. Keen.io is a service which provides APIs for collecting, exploring and visualizing analytics data. I won’t be using the collecting functionality since Segment.io will handle this.
To summarize, I’ll be using the Segment.io API to collect analytics data, and the data will be sent to Keen.io for analysis.
Setting up Segment.io and Keen.io
First sign up for an account at Keen.io. Once you’ve entered your email, company name and password, you’ll be greeted with the following screen:
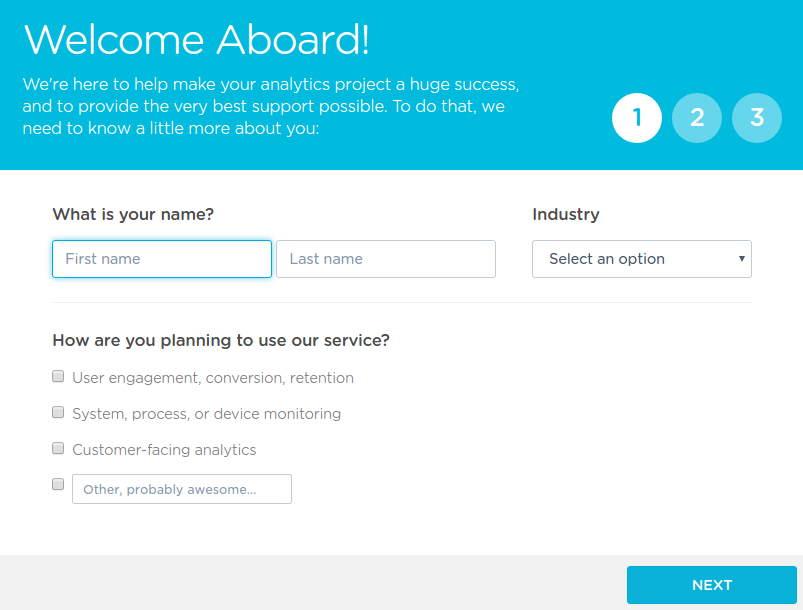
Answer the questions with values applicable to your project until you finish. Then you’ll see your first Keen.io project:
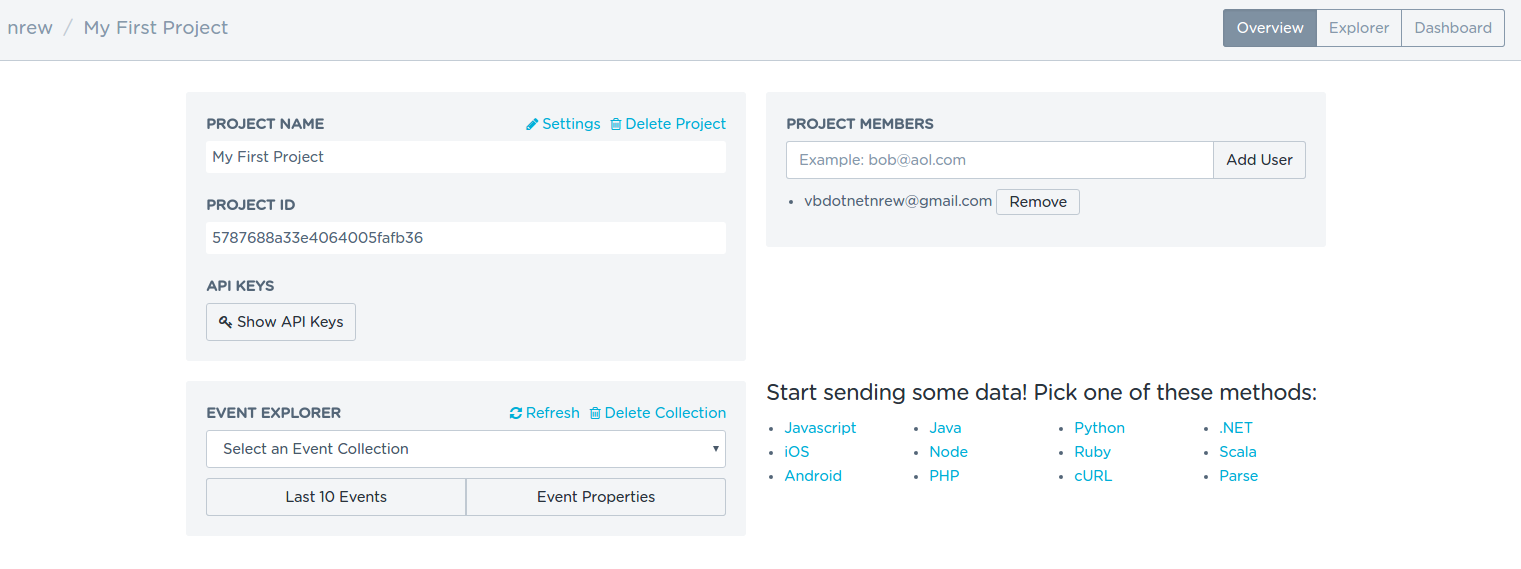
Leave this for now, open a new browser tab and sign-up for a Segment.io account. You’ll be greeted with the following screen:
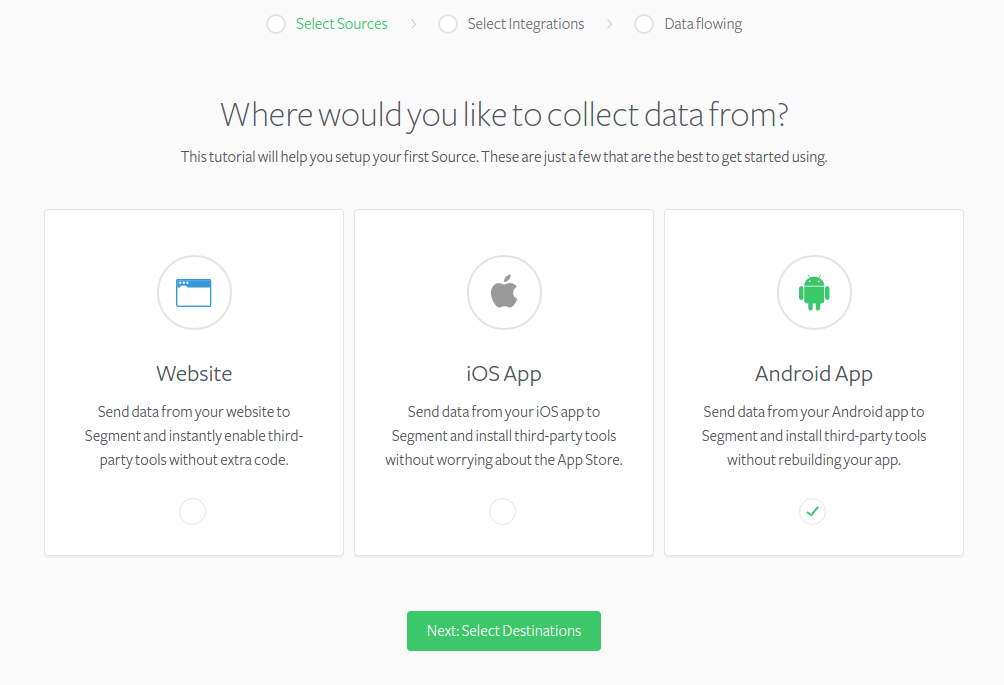
Skip this for now as you want to setup Keen.io with segment. On the top navigation, click sources. You should see the following as you haven’t added any sources yet:
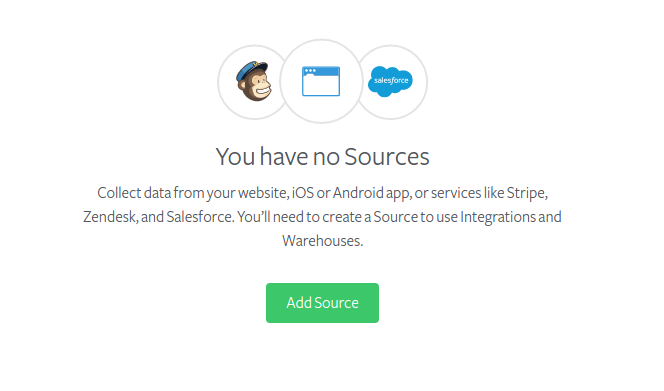
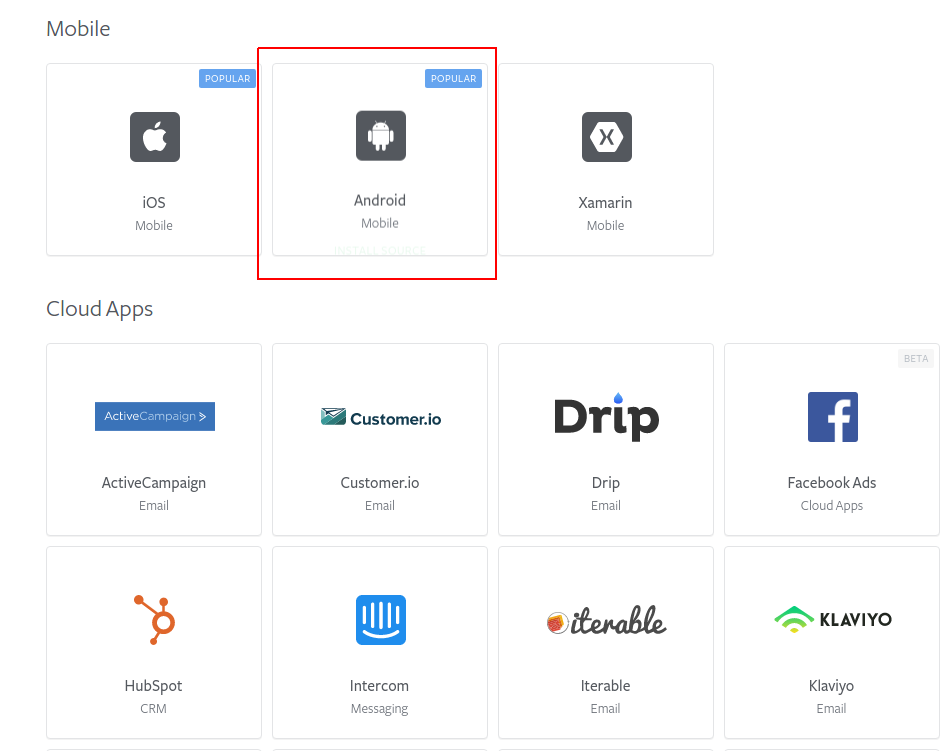
Click on add source, and from the different sources listed, click android and then connect.
Enter a nickname and the name of the database to use when you connect a data warehouse. You can leave the default if you want. You won’t be using the data warehouse feature since the data will be stored on Keen.io’s servers:
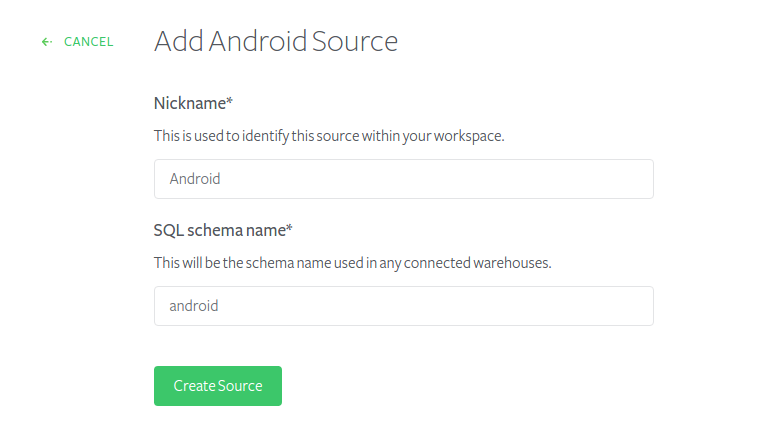
Click add source to finish adding the source.
When you visit the sources page, you’ll see the new source is now listed. Click it then take note of the Write Key. Click Integrations and you’ll see a set of services you can integrate with Segment.io. Click KeenIO and in the window that shows, click the settings tab. This is where you enter the project ID and write key of the Keen.io project. Switch tabs and copy the project ID and write key from the Keen.io website. You can see the write key by clicking the Show API Keys button.
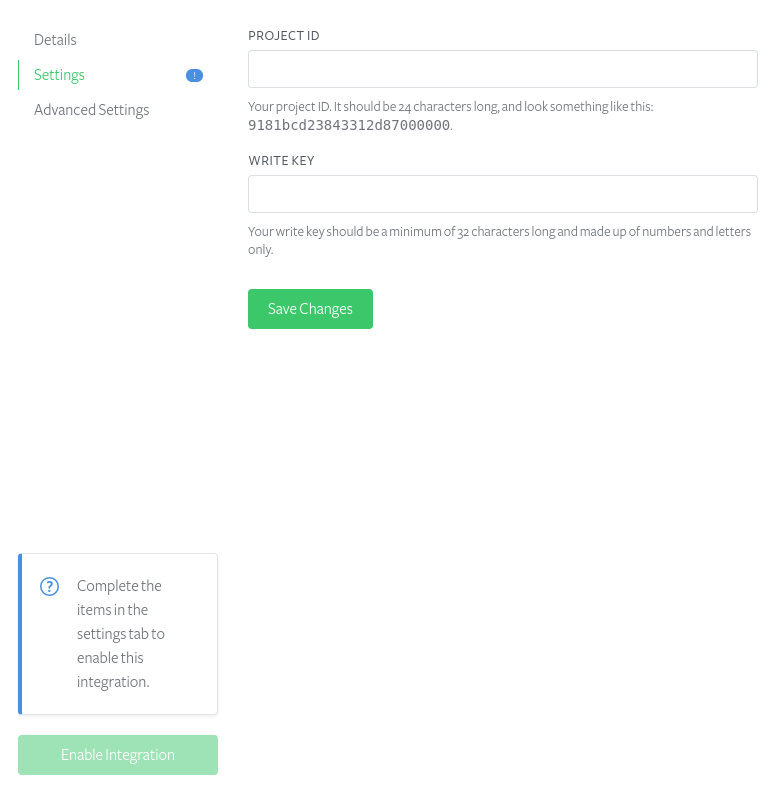
Switch back to the Segment.io website, paste the data that you have, and click Save Changes. You should now be able to click on the Enable Integration button to enable Keen.io.
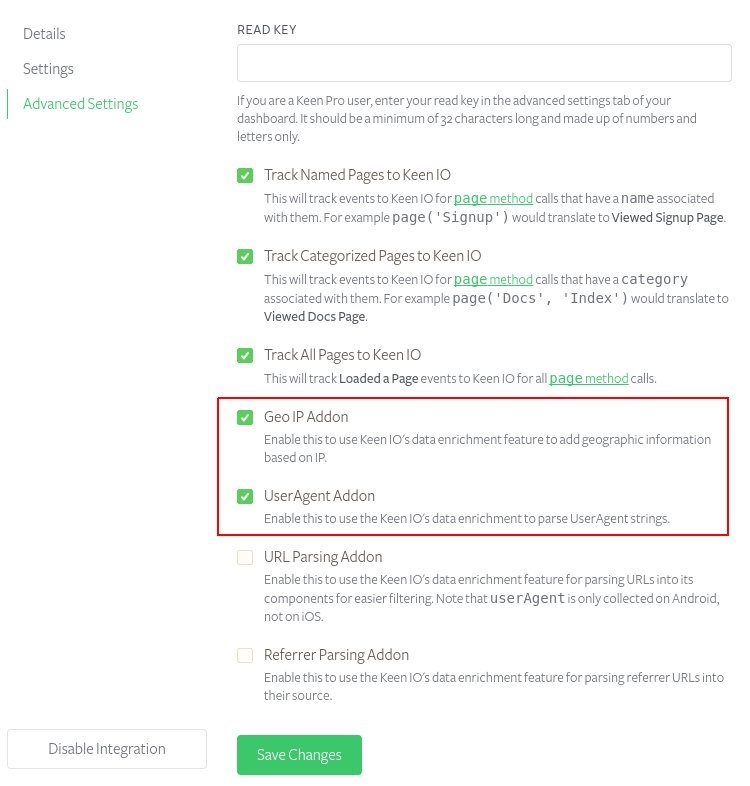
Click Keen.io again to enable a couple of advanced settings, Geo IP Addon and UserAgent Addon. The Geo IP Addon allows you to gather geographic data based on a user’s IP address, and the UserAgent Addon allows us to get details about the user’s device. Such as what Android device and OS version they are using. Once you’ve checked those, click save changes. If you’re wondering about the Read Key, you use this if you need to read data from Keen.io. The sample app you’re going to create won’t need to do this and you will use Keen.io’s dashboard to play with the data acquired through the app.
Brief on the App
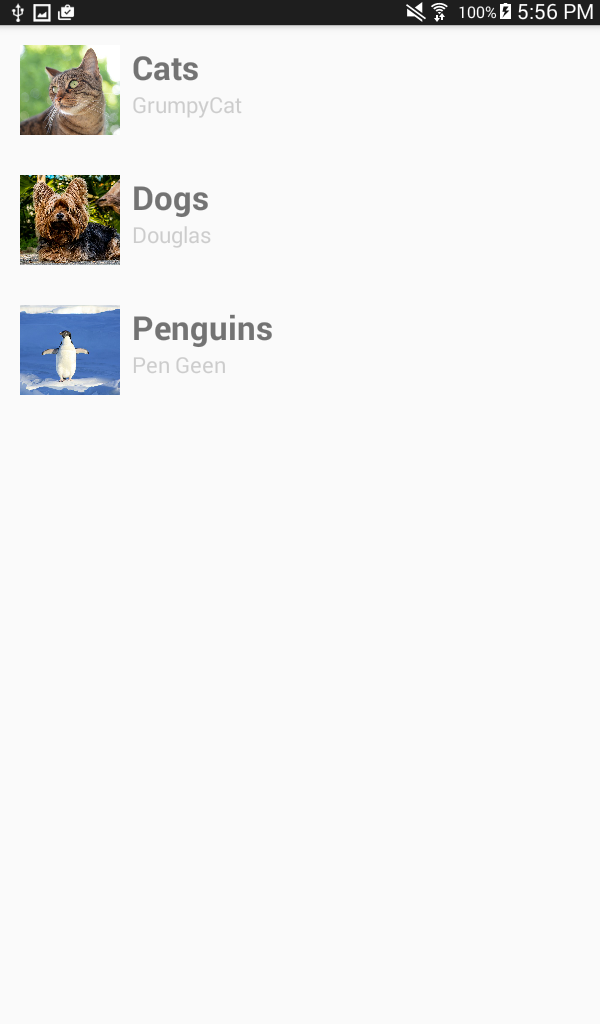
For this article, I’ve created a simple gallery app which I’ll use to show how to implement analytics with React Native. It has two screens, collections and view collection screen. Here’s what the collections screen looks like:
And the view collection page:

The collections page displays a list of collections added by imaginary users. Take note of the word “imaginary”, this app is a simple one. This means that all the data it uses is embedded directly in the code. There’s also no login functionality for identifying each individual user that uses the app. This means that you’ll need to use the unique identifier available in the device to identify each user.
The view collection page has three buttons for each photo. You can probably already guess what each one does based on the icons, but to be clear. From left to right they are favorite, bookmark, and share. Those three buttons won’t do what their icons say. Their purpose is purely for recording analytics data so all users will see is an alert confirming that the action was performed.
Setting up the App
At the time of writing, React Native is at version 0.29. If you’re reading this at a later date and you want to ensure that the demo works, you can either clone the Github repository, update config.js with the write key from Segment.io and run the app.
If you want to try for yourself, you can install rninint, use it to initialize a new React Native project (with version 0.29), then copy the following files and folders from the Github repo:
- index.android.js
- config.js
- data.js
- pages
- package.json
Once that’s complete, install the dependencies by executing npm install on your terminal, update config.js with the write key from Segment.io and update the Android source files so that the packages installed will work.
Linking the Packages
If you open package.json you’ll see the following packages aside from React and React Native:
You have to link those packages to the Android project so they’ll work. Open android/settings.gradle file and add the following:
include ':react-native-device-info'
project(':react-native-device-info').projectDir = new File(rootProject.projectDir, '../node_modules/react-native-device-info/android')

include ':react-native-analytics'
project(':react-native-analytics').projectDir = new File(rootProject.projectDir, '../node_modules/react-native-analytics/android')

include ':react-native-vector-icons'
project(':react-native-vector-icons').projectDir = new File(rootProject.projectDir, '../node_modules/react-native-vector-icons/android')
This file points out the path to where the different third-party packages are installed. You can view the settings.gradle file for reference.
Open android/app/build.gradle file and add the following after apply plugin: "com.android.application":
project.ext.vectoricons = [
    iconFontNames: [ 'FontAwesome.ttf' ] // Name of the font files you want to copy
]
apply from: "../../node_modules/react-native-vector-icons/fonts.gradle"
This will link the font files you want to use with the React Native Vector Icons package. In this case it’s only using FontAwesome so that’s the only item added to the iconFontNames array.
Still in the same file, look for the dependencies object and make sure it has the following contents:
compile project(':react-native-device-info')
compile project(':react-native-analytics')
compile fileTree(dir: "libs", include: ["*.jar"])
compile "com.android.support:appcompat-v7:23.0.1"
compile "com.facebook.react:react-native:+"  // From node_modules
compile project(':react-native-vector-icons')
This allows you to add all the packages when you compile the app. You can view the build.gradle file for reference.
Open android/app/src/main/java/com/NAME-OF-YOUR-REACT-NATIVE-PROJECT/MainApplication.java and add the following after importing the Java List Utility:
import com.oblador.vectoricons.VectorIconsPackage;
import com.smore.RNSegmentIOAnalytics.RNSegmentIOAnalyticsPackage;
import com.learnium.RNDeviceInfo.RNDeviceInfo;
Then the following after the main React package:
new RNSegmentIOAnalyticsPackage(),
new VectorIconsPackage(),
new RNDeviceInfo()
This will initialize the React Native Analytics package, Vector Icons package and the Device Info package.
You can view the MainApplication.java file for reference.
Explaining the Code
Now that you know how to setup a working demo of the app, its time to walk through the code and see how you gather data.
First open index.android.js, the first few lines import the packages that you need. You use DeviceInfo for getting information about the device used by the user. Things like the unique device ID, manufacturer, model, version number, and build number.
import DeviceInfo from 'react-native-device-info';

import config from './config';

import Analytics from 'react-native-analytics';
You’ll be specifically using the unique device ID to identify each user since the app doesn’t have a login system. If you look at the componentWillMount function you’ll see two method calls from the Analytics package, setup and identify. setup sets up the project in which to save the analytics data. You pass the Segment.io write key and the flush setting as arguments to this function. Flush is the setting for when to send events. Setting it to 1 sends them as they come, for example when a user creates an account.
If you make a call to record this specific action, the corresponding data is automatically sent to the server. I’ve set this to 1 in the config.js for faster testing. In production you might want to set this to 20 or more so each action gets queued and only sent to the server after a specific number of events have been recorded.
componentWillMount() {
    Analytics.setup(config.segmentIOWriteKey, config.flushSetting);
    Analytics.identify(DeviceInfo.getUniqueID(), {
        device_manufacturer: DeviceInfo.getManufacturer(),
        device_model: DeviceInfo.getModel(),
        system_name: DeviceInfo.getSystemName(),
        system_version: DeviceInfo.getSystemVersion()
    });
}
The other function is identify, used for identifying each user, using the getUniqueID method in the DeviceInfo package. Aside from that, you’re also recording information about the device being used, passed as an object in the second argument. This is useful if you want to get information about what devices users are using to access the app.
Note: Since the app uses the device ID for identifying users, this will fail in identifying what specific devices a specific user is using. Even if its actually the same user, they’ll be classified as a new one because they’re using a different device.
Next take a look at pages/CollectionList.js. This page displays the list of collections which in this case is a list of animals. The data you’re displaying comes from the data.js file. Before the component is mounted, call the screen method. This records pages or screens that the user accesses. Here you supply a hard-coded value because you only have a single version of the collections page.
For example, if you have a screen which lists a more general classification of animals called “organisms”, you can get the page info from the data that you passed into the route instead of a hard-coded value like the one below. The screen method accepts the name of the page as its first argument and an optional object containing any additional data that you want send.
componentWillMount() {
    //...
    Analytics.screen("Animals", {"description": "A list containing different animals"});
}
When a user taps on any of the items in the collections page, they get to see the photos that are added to that item. Those photos are displayed by the pages/Item.js file. As mentioned earlier, each photo has three buttons below it that record which specific actions users performs to specific photos. Let’s first take a look at the code used for recording that a user has accessed this specific screen. Get the screen name from the item object that was passed as a props from the collections page:
componentWillMount() {
    //...
    Analytics.screen(this.props.item.title);
}
Next are the functions called whenever a user taps on the favorite, bookmark or share buttons. For actions such as these, the track function is used. This accepts the name of the action and an optional object containing additional data that you want to pass in. In this case also passing the name of the collection in which the photo belongs, the caption and the URL of the photo. For naming the actions, it’s best practice to name them using a past-tense verb and a noun (e.g. Generated Report, Checked out Cart, Watched Video).
_favorite(photo) {
    Analytics.track("Favorited Photo", {
        gallery: this.props.item.title,
        caption: photo.caption,
        url: photo.url
    });
    alert('favorited!');
}

_bookmark(photo) {
    Analytics.track("Bookmarked Photo", {
        gallery: this.props.item.title,
        caption: photo.caption,
        url: photo.url
    });
    alert('bookmarked!');
}

_share(photo) {
    Analytics.track("Shared Photo", {
        gallery: this.props.item.title,
        caption: photo.caption,
        url: photo.url
    });
    alert('shared!');
}
Inspecting the Analytics Data
If you haven’t already done so, run the app on your device or on an emulator, access the different pages and perform actions on each photos. This way you’ll have data to work with.
Open the Keen.io website and click the project that you created earlier.
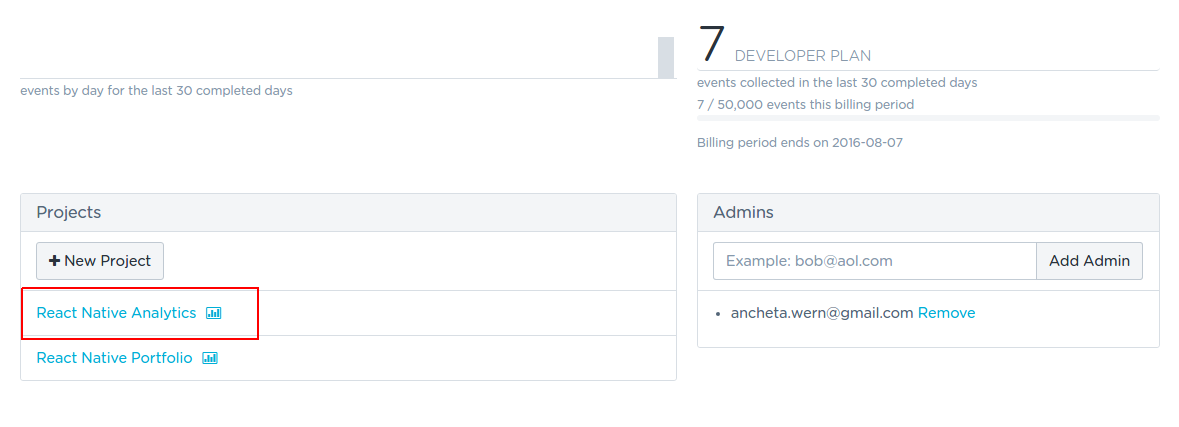
Once on that page, click the explorer tab and you’ll be greeted with the following screen:
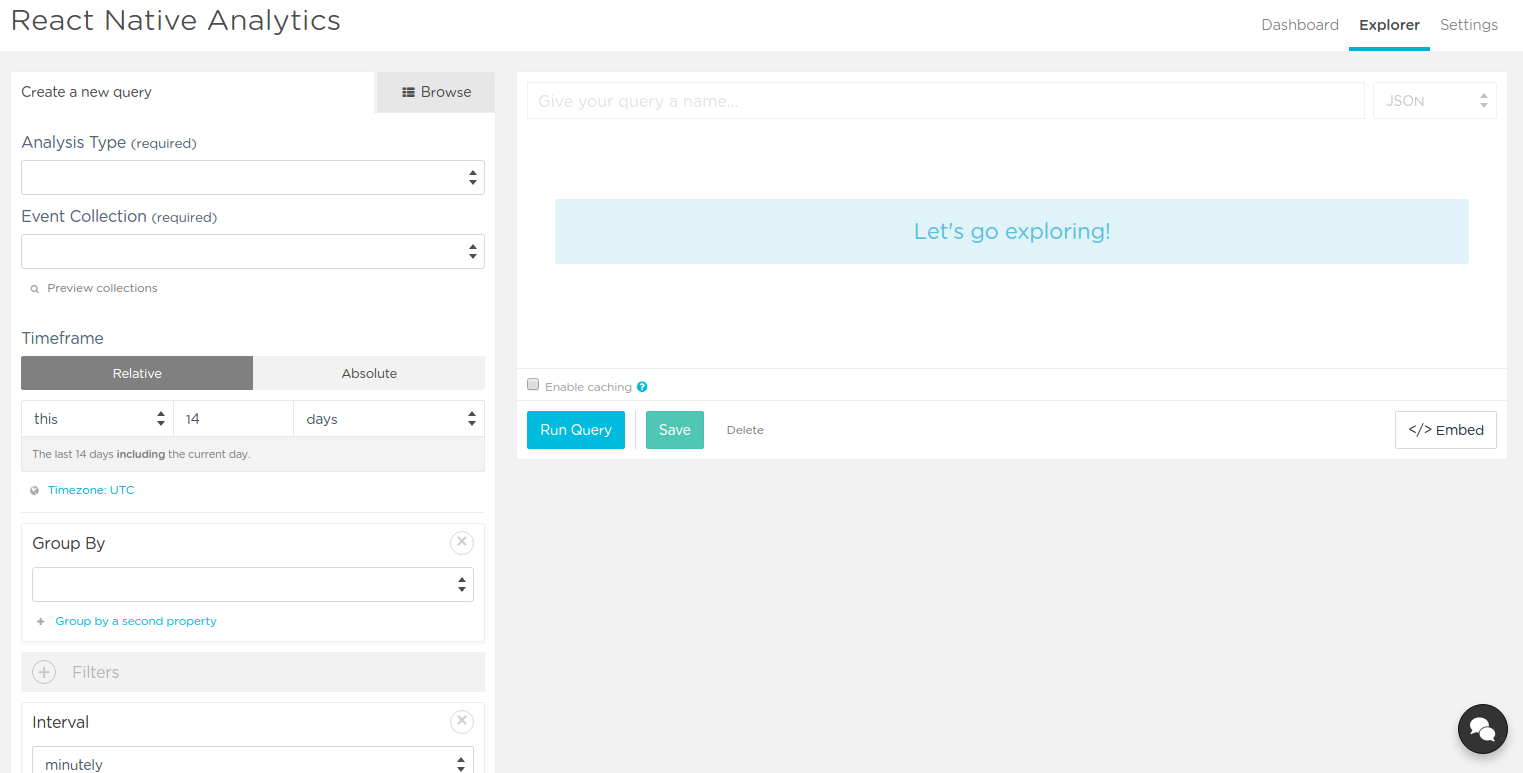
This is the Keen.io explorer where you can perform different queries to extract the data that you want. For example if you want to know the total number of users who favorited a photo, select count as the analysis type, Favorited Photo for the event collection and click the Run Query button to execute the query:

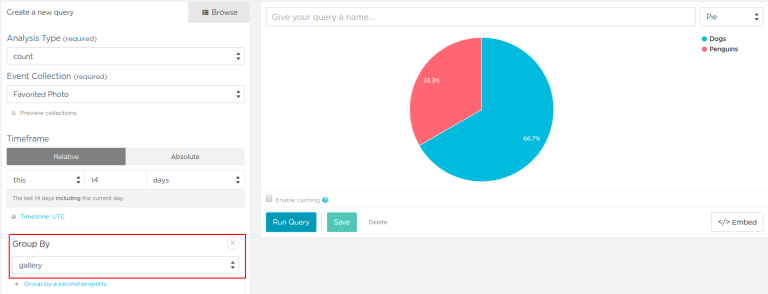
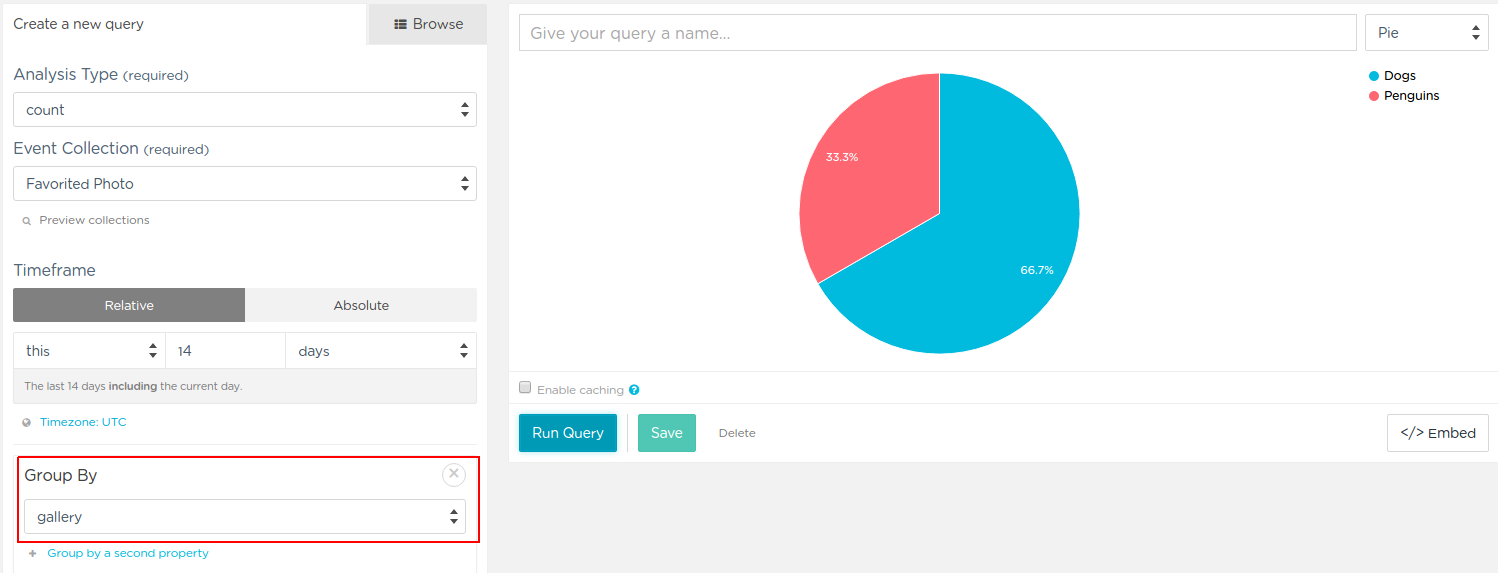
If you want to group the counts using a specific field, select a field on the Group By section and then run your query. In the example below, I’ve selected gallery to group the results by the collection.
You can also run an extraction query:
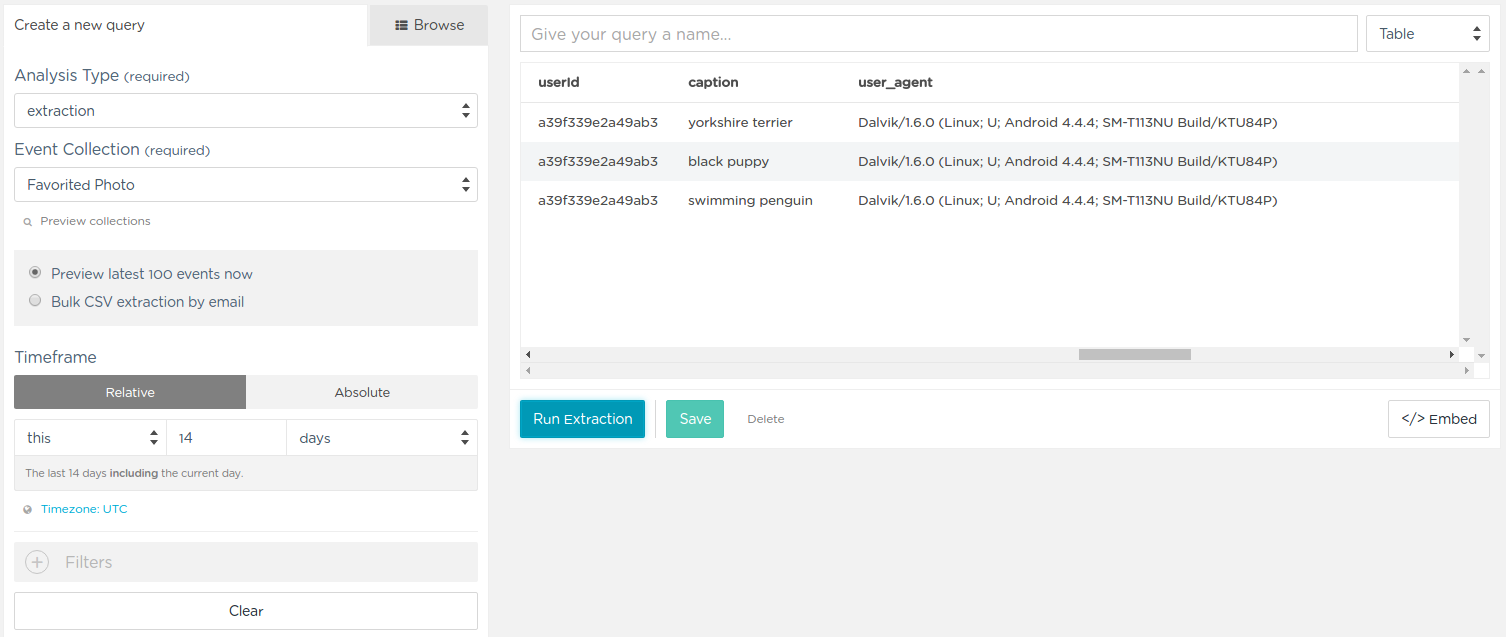
This is the equivalent of SELECT * on a relational database system. This is what you use if you want to export your data to a CSV file.
There’s also select unique which allows you to select unique values of a specific field. The example below selects all the unique captions for Favorited Photo events.

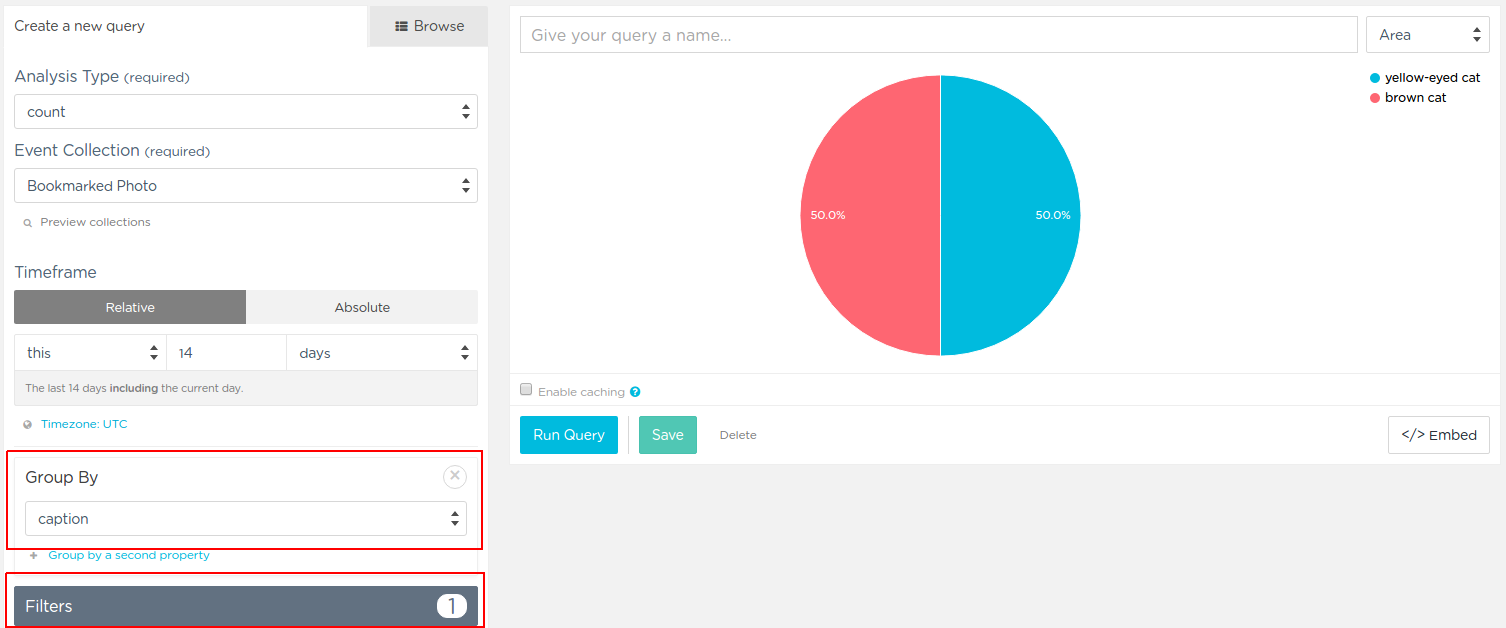
You can use filters to filter data using a specific field. To use filters, first click the Filters section and select the field you want to filter by. The example below selects the gallery field with a value of Cats.

After that, select the caption field as the grouping field. This allows you to see how many users have bookmarked each individual photo in the cat collection.
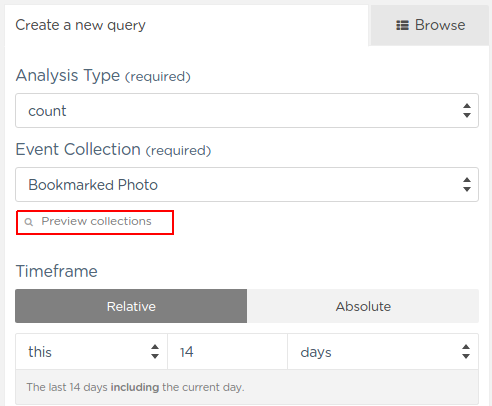
Finally, you can click the preview collections link to see the raw data sent from the different devices:
Here’s a sample of the data that you get:
[
  {
    "parsed_user_agent": {
      "device": {
        "family": "Samsung SM-T113NU"
      },
      "os": {
        "major": "4",
        "patch_minor": null,
        "minor": "4",
        "family": "Android",
        "patch": "4"
      },
      "browser": {
        "major": "4",
        "minor": "4",
        "family": "Android",
        "patch": "4"
      }
    },
    "keen": {
      "timestamp": "2016-07-15T06:00:18.986Z",
      "created_at": "2016-07-15T06:00:19.236Z",
      "id": "xxx"
    },
    "url": "https://pixabay.com/static/uploads/photo/2016/05/31/16/04/humboldt-penguin-1427228_640.jpg",
    "userId": "xxx",
    "caption": "swimming penguin",
    "user_agent": "Dalvik/1.6.0 (Linux; U; Android 4.4.4; SM-T113NU Build/KTU84P)",
    "ip_geo_info": {
      "province": null,
      "city": null,
      "postal_code": null,
      "continent": "Asia",
      "country": "Philippines"
    },
    "ip_address": "112.xxx.xx.xx",
    "gallery": "Penguins",
    "page_url": "https://pixabay.com/static/uploads/photo/2016/05/31/16/04/humboldt-penguin-1427228_640.jpg"
  }
]
As you can see, it has all the data that you told it to store and more such as the device info, IP address, geographic information and user data such as the keen.id and userId. keen.id is the unique ID generated by Keen.io for that specific event. userId is the unique device ID that we supplied.
Analyze This
That’s it! In this article you looked at Segment.io and Keen.io as a way to implement analytics in React Native apps. Hopefully this article has provided you with the knowledge to start implementing analytics in your apps.
What services do you use for implementing analytics in mobile apps? Does it also involve Segment.io? Or do you use an entirely custom stack? Let me know in the comments.
Frequently Asked Questions (FAQs) on Adding Analytics to a React Native App
How can I set up analytics in my React Native app using Firebase?
Firebase is a popular tool for setting up analytics in a React Native app. To start, you need to install the Firebase SDK in your project. You can do this by running the command npm install @react-native-firebase/app @react-native-firebase/analytics. After installation, you need to link the libraries to your project. Once linked, you can import Firebase into your app by adding import analytics from '@react-native-firebase/analytics'; at the top of your file. Now, you can use Firebase’s analytics functions like analytics().logEvent('event_name') to track events in your app.
What are some alternatives to Firebase for analytics in React Native?
While Firebase is a popular choice, there are several other libraries you can use for analytics in React Native. One such library is Segment, which offers a unified API for many different analytics platforms. Another option is Expo, which provides its own set of analytics functions. You can choose the library that best fits your needs based on factors like ease of use, features, and compatibility with other tools you’re using.
How can I track custom events in my React Native app?
Tracking custom events allows you to gather specific data about user behavior in your app. Most analytics libraries, including Firebase and Segment, allow you to define and track custom events. For example, in Firebase, you can use the logEvent function to track a custom event. The function takes two parameters: the name of the event and an object containing any additional data you want to track.
Can I use Google Analytics with React Native?
Yes, you can use Google Analytics with React Native. However, it requires a bit more setup compared to other libraries. You’ll need to install the react-native-google-analytics-bridge package, and then link it to your project. Once set up, you can use Google Analytics functions to track user behavior in your app.
How can I view the data collected by my analytics tool?
The method for viewing analytics data depends on the tool you’re using. For Firebase, you can view your analytics data in the Firebase console. For Segment, you can view your data in the Segment dashboard. Most tools also offer the ability to export your data for further analysis.
How can I ensure user privacy when using analytics in my React Native app?
Ensuring user privacy is a crucial aspect of using analytics. You should always inform users that you’re collecting data, and give them the option to opt out. Most analytics tools offer functions to anonymize user data, and you should make use of these whenever possible.
Can I use multiple analytics tools in my React Native app?
Yes, it’s possible to use multiple analytics tools in your app. However, it can make your app more complex and harder to maintain. If you need to use multiple tools, consider using a tool like Segment, which can send data to multiple analytics platforms from a single API.
How can I debug my analytics setup in React Native?
Debugging your analytics setup can be done in several ways. Most analytics tools offer some form of logging or debugging mode, which can help you identify issues. You can also use the React Native debugger or a tool like Flipper to debug your app.
Can I track offline events in my React Native app?
Yes, many analytics tools support tracking offline events. These events are stored locally on the device and then sent to the analytics server when the device is online again. Check the documentation of your chosen analytics tool to see if it supports offline event tracking.
How can I track user engagement in my React Native app?
Tracking user engagement involves tracking events that indicate user interaction with your app. This could include things like button clicks, page views, or even custom events that you define. Most analytics tools provide functions to track these types of events.
Wern is a web developer from the Philippines. He loves building things for the web and sharing the things he has learned by writing in his blog. When he's not coding or learning something new, he enjoys watching anime and playing video games.


