


As a freelancer, small business owner, or entrepreneur, you’re making important business decisions every week. You need to decide when to make a new hire, whether to change the pricing of your services, how to enhance your website, and where to invest next.
To make good decisions, you need the right information, presented in the right way, at the right time. In short, you need good reporting.
”Measurement is the first step that leads to control and eventually to improvement. If you can’t measure something, you can’t understand it. If you can’t understand it, you can’t control it. If you can’t control it, you can’t improve it.” — H. James Harrington
Key Takeaways
- Understand the importance of reports: Reports are crucial for making informed business decisions, allowing you to see the health of your business and guide your actions effectively.
- Focus on actionable information: Ensure your reports provide clear, actionable insights rather than just raw data, helping you understand what steps to take next.
- Keep it simple and relevant: Overly complex or data-heavy reports can obscure important information. Keep your reports focused on the essentials that directly impact decision-making.
- Use high-quality data: The accuracy of your reports depends on the quality of the data you use. Verify your data sources to maintain trust in your report’s findings.
- Report design matters: Present information in an easily digestible format, using design to enhance comprehension, not distract from the key messages.
- Regular review and adaptation: Business needs evolve, and so should your reports. Regularly review and adjust your reports to ensure they remain relevant and effective.
What Exactly Is a Report?
A report collects together important information, makes it easy to understand, and lets you make informed business decisions based on that information.
Don’t switch off or change the page. I’m here to let you know why reporting is important, how to create useful reports, and what you should be using them for. By the time I’m done, you’ll be a reporting maven, able to get at the information you need, see how your business is doing, and make decisions that directly contribute to your business’s success. Really.
I know, because I’ve seen how great reports can help to transform a business. As a (former) reporting manager and now a freelance writer and small business owner, I’ve analyzed data and written reports, used them to get decisions from executives, and changed the direction of my own business. It’s not always an easy ride, and one of the more difficult areas is persuading others why reporting is important.
That’s why we’re going to deal with some common misperceptions about reports.
“I Think Reports Are Boring”
I hear you. It’s true that reports can often become wallpaper — pages and pages filled with figures, trendlines, pie charts, and more — decorating a manager’s wall. People put hours into creating these monstrosities, only to have them looked at once and consigned to the wastebasket of “meh.”
It doesn’t have to be this way. I’m not going to say a report will create an adrenaline rush, but when you focus on what really matters (success), that report is going to help you make the right decisions to grow your business, serve your customers, and put money in the bank.
In other words, while many reports are background noise, the ones you’re going to create will empower you to do the right thing.
“I like to Make Decisions Based on My Gut Feelings”
We all do. And it’s true, sometimes gut feeling is the way to go — sometimes, though, it’s not. There have been plenty of decisions made purely on gut feeling that have caused businesses to fail. An idea at the wrong time, a belief in a market that wasn’t there, developing the wrong products and services.
Gut feelings do have a place in decision making, but in the right context. In fact, gut feelings often come from our experiences, based on the information we see every day. Our brain takes that information, processes it and creates a “baseline” that we subconsciously judge things against. When you’re acting on gut feeling, you’re really using a combination of experience, information, and opinions to arrive at your decision.
Reporting is a way of putting some discipline around that process. A good report gives you the latest information, unfiltered by anything else, that lets you make an informed choice. The best decisions are guided by information and intuition, and reporting influences both of those areas.
“I Don’t Have Time to Create Reports”
So you don’t have the time to help your business be more successful? If you genuinely don’t think you have the time, consider this — reporting lets you:
- See how your business is doing on a day to day basis.
- Get an early warning on things that are going wrong.
- See where you’re spending money.
- Understand how your business is growing (or not).
- And much more.
All of these areas are essential to being successful, and with reporting becoming faster and easier, some effort now will pay dividends in future.
Why do reports matter? To sum it all up:You need reports so you can make better business decisions.
Why Reports Become Wallpaper
Let’s not fool ourselves. Reports aren’t a universal panacea that will solve all business problems. Before we start looking at what makes a good report, let’s explore the reasons people dislike reports. The traits of bad reports include:
- Presenting raw data “as is” without giving context.
- Providing way too much data.
- Being overly long.
- Not allowing you to see at a glance what you need to do.
- Using charts and graphs with little regard for what they’re showing.
- Providing historic trends over the wrong period of time.
Bad reports actually obscure the data you need and make it harder to take good decisions. That’s why they often become wallpaper.
Here’s an example — When I was running our reporting area, we produced around 20 different reports a month that we sent out to various execs and managers. We didn’t get much feedback on the reports, even after we asked for it repeatedly. So, I tried an experiment.
Every month, we produced the reports but we reduced the number we sent out by five a month, without telling anyone. No-one noticed until the last month, when we started getting enquiries. The result? We reduced our monthly reporting from 20 reports down to just 4, and then we made those reports amazing.
You Need to Follow These Ground Rules
Decent reporting needs the right approach. It means changing your thinking about what reports can do, how they do it, and why you need the information in the first place. These common sense best practices will give you a strong foundation. They are:
- Design reports around your decisions, not the other way around.
- Make sure you can act on the information in a report.
- Keep information in reports to a realistic minimum.
- Use high-quality data.
- Present information in the right way.
- Don’t try to make one report do everything.
- Decide how frequently you’re going to report.
Design reports based on the decisions you need to make
There’s a temptation to include something in a report “just because.” In fact, people often create whole reports “just because.” Unsurprisingly, these reports go straight in the trash can. That’s why the best way to create a decent report is to ask this question:
What are the most important regular decisions I need to make in my business?
Once you’ve answered the question, design reports that give you the information to help make those decisions. In other words, base the reporting on your business needs. Just this one, simple rule by itself would rid the world of so many bad reports! A report should be designed to give you insight into specific areas of your business.
”If a measurement matters at all, it is because it must have some conceivable effect on decisions and behaviour. If we can’t identify a decision that could be affected by a proposed measurement and how it could change those decisions, then the measurement simply has no value” — Douglas W. Hubbard
Make sure you can act on the information in your reports
What’s more informative?
- Number of incidents in March: 28, April: 33
- April saw an 18% rise in customer incidents
The second bullet is actually something that catches your eye and makes you think “I need to do something about that.” This is known as having actionable information, rather than just raw data. In other words, it’s not just numbers, it’s how those numbers are presented that makes you take notice.
Anyone reading through a list of numbers knows how quickly number-blindness and boredom sets in. Avoid that by reporting on the stuff that really matters, and presenting it in a way that makes sense. This often involves making comparisons and showing how things are changing.
Keep the information in your reports to a workable minimum
One of the main mistakes people make with reports is including way too much data, when you only need to see the stuff that’s important. It’s why I’m a big fan of “reporting by exception.” In other words, tell me when something alters significantly from the targets I’ve set or from last month’s figures. Otherwise, don’t show it.
Good reporting really is about “less is more” — it’s much easier to act on something if you’ve got fewer other facts and figures distracting you. Be ruthless as you’re building a report. If it doesn’t help you make a decision or doesn’t share anything useful, cut it out.
Use high-quality data sources for your reports
A report is only as good as the information it shares. You need to be sure the data you’re using is accurate. There are a few ways to do this:
- Track the data over time and see if trends in the data reflect your own insights
- Get the data verified by more than one source
- Share the reports with people you trust and ask “does this make sense?”
Ultimately, to make confident business decisions, you need to trust the data that’s influencing those decisions. A little verification goes a long way.
Present information in the right way
There are thousands of different ways to present information — Text, numbers, colors, smiley faces, bar charts, pie charts, 3D charts, bubbles. If you could present information in a certain way, I guarantee someone has tried to report on information that way. That doesn’t mean it’s a good idea!
Keep things simple. It should be the information itself that gets attention, not all of the pretty design around it. When you’re looking at a report, think: “Could I learn what I need to from this part of the report by scanning it for five seconds?” If the answer is no, you need to simplify the design.
By all means, use design elements to highlight and emphasize data. For example, if something is below target you might color it red, and if it’s above target, color it green. Your presentation should enhance the message in the report, not get in its way.
Don’t try to make one report do everything
One mistake I’ve often seen is reports that present information from all sorts of unrelated areas in once place. They might combine profit and loss with staff turnover and product development. Unfortunately, this creates cumbersome, overly-long reports and also dilutes the value of a report.
The reason is simple — we like to focus on one particular area of information at a time. This means if we’re looking at financials, we’re receptive to other financial data, and are in the right frame of mind to make decisions about financials. If the type of information we’re looking at changes, we have to recalibrate.
Because of this, keep your reports focused on a particular type of information. Find the right balance between the information you’re presenting and the right report(s) to use.
Decide how often you’re going to read or create reports
How often should you produce reports? The answer is produce them often enough to be useful, but not so often they’re overwhelming. You also want to think about how quickly you need to make decisions and how that fits into reporting frequency. A good rule of thumb is to produce reports on a monthly basis, see how that works for you, and adjust how often you report accordingly.
Now we’ve looked at the ground rules, let’s explore the essential factors for every report.
The Five Essential Parts of Every Good Report
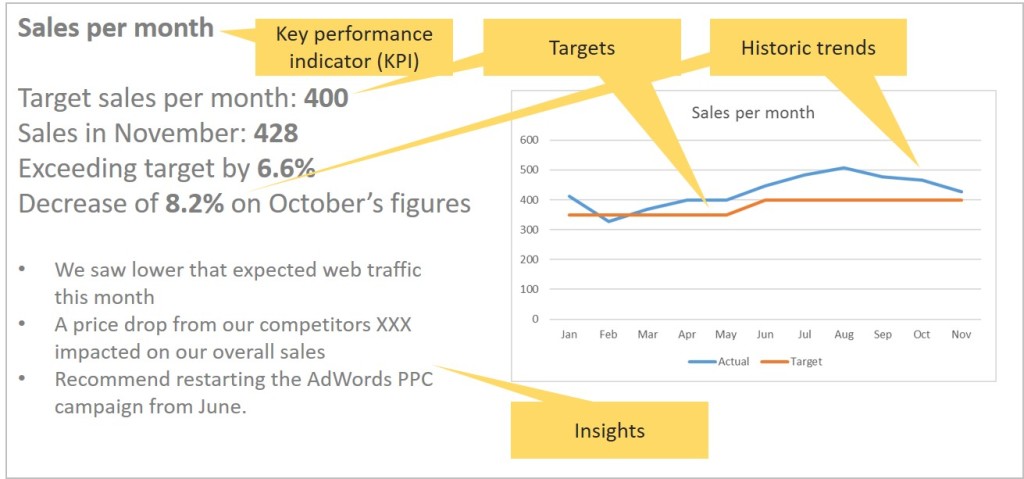
Good reports share five essential factors — bear with me as we get a little technical, and start talking about “Key Performance Indicators” (KPIs), sources, targets, trends, and insights. I promise, it’ll be worth it.
Key performance indicators (KPIs)
What they are: They’re the data points you track that tell you what’s going on in your business:
- Key — Essential to understanding what’s going on.
- Performance — Tells you a story over time.
- Indicator — A way to measure the impact of what’s happening.
How you use them: They’re the actual facts and figures you show, the stats and information that help you make decisions.
Here are a few examples of KPIs:
- Number of clients signed up in the last month.
- Total sales value in the last month.
- Rate of client churn.
- Amount of money in the bank.
- Profits and losses in the last month.
Data sources
What they are: The data sources that you use to provide the information and KPIs for your report.
How you use them: You take information from your data sources and use the information to arrive at your KPIs.
Examples of data sources:
- Google Analytics and Webmaster Tools (website usage and search results)
- Bank balance, income and outgoings (profit and loss, expenditure, runway)
- Marketing data (marketing ROI and performance)
Targets
What they are: The targets and goals you set for your business, in numerical format. They’re what you want your KPIs to be, and the closer your KPIs are to them, the better.
How you use them: Your report scores how your KPIs are performing against your target and shows how much above or below them they are (this if often called “variance”).
Examples of targets:
- Number of clients signed up in the last month > 100.
- Total sales value in the last month > $25,000.
- Rate of client churn < 8%.
- Amount of money in the bank > $100,000.
- Profits and losses in the last month > $10,000.
Trends
What they are: Trends show how KPIs perform over time and compare what’s happening now to what happened in the past.
How you use them: A trend is a snapshot of a moment in time. It lets you know if things are staying the same, or getting better or worse.
Examples of trends:
- Clients signed up, month by month.
- Total sales value in June 2016 vs June 2015.
- Client churn rates in quarter 2 vs. quarter 1.
- Amount of money in the bank over the last year.
Insights
What they are: Insights are the key pieces of useful information you glean from looking at the information in a report.
How you use them: Insights provide context and understanding. They’re often included as extrapolations from the information you’re looking at and help you make business decisions.
Examples of insights:
- We had 12% more clients sign up in July, as a result of our AdWords marketing campaign.
- The total sales value in February fell by 6% against January due to increased competition from xxx.
- The amount of money in the bank fell by an additional $3,000 in September due to purchasing additional server infrastructure.
Recap
KPIs are what you’re actually measuring.
Data sources are where you get your information from.
Targets are the numbers you want to meet.
Trends show you what happens over time.
Insights give you information you can act on.
To understand this better, here’s how this might look in an actual report.
Building Your Reports
Now that we’ve covered the ground rules and key components of a report, let’s bring it all together. This is the process you’ll want to follow to create a report for your business.
- Think about the questions you want answered and the decisions you need to make. What parts of your business do you need to get insight into? This is the central theme of the report and determines everything else you’re going to include.
- Decide on the KPIs you’re going to use in the report. Establish the information you want to show that will help you make decisions.
- Find good quality data sources. The data you source is what you’ll be showing with each KPI.
- Use the right timeframe for trends. Decide on a good period of time for showing historic data for each KPI.
- Put realistic targets in place for each KPI. Think about the goals you need your business to meet and ensure they’re reflected in your target figures.
- Think about insights. Each of your KPIs, trends, and targets will create insights for you. Be sure to capture them in the report.
- Create a prototype report. You have all the information you need, it’s time to create a prototype report bringing everything together.
- Review and tweak your prototype report. Make sure you have the right amount of information to make a decision (and no more), check that you’re presenting information in the best possible way.
- Decide how often you’re going to produce the report.
- Use your report to make decisions. This is the point of reporting in the first place.
And that’s it. This is how you build a report to help you make decisions about your business. Follow these steps and you’ll create focused, easy-to-read, useful reports to give you the insight you need.
Types of Business Reports
Now we know the principles of reporting and how to create repeats, let’s explore a few different types of reports used in a typical business. For each one we’ll look at:
- What it’s for: A quick description of the report and what it does.
- KPIs: The KPIs this type of report usually tracks.
- Data sources: Good places to source data for the report.
- Targets: The types of targets you want to set.
- Decisions: How the report drives your business decisions.
Please note that all of these reports and areas are suggestions — take them and tweak them so they’re right for your business.
Profit and loss report
What it’s for: Shows how much money you have coming into and going out of your business over a certain period of time.
KPIs: Total money coming into your business, income categories, money going out of your business, expense categories.
Data sources: Accounting, invoicing, and expense software; bank accounts.
Targets: Money going out is less than money coming in.
Decisions: Understanding where you’re getting money from and where you’re spending money; tightening up on expense control; expanding income types; checking you have enough money coming in.
Balance sheet report
What it’s for: Shows what a business owns and owes at a particular point in time.
KPIs: Assets – what the business owns including physical assets and cash; liabilities – anything your business owes to others; retained profit – money in the business.
Data sources: Accounting, invoicing, and expense software; bank accounts.
Targets: Having enough cash on hand to meet current and future liabilities.
Decisions: Understanding your cashflow, looking at options for increasing cashflow, refinancing.
Runway and burn rate report
What it’s for: Shows how much time (runway) a business has left to generate a profit, depending on how quickly the business is spending money (burn rate).
KPIs: Total amount of money available to the business; where money is being spent; how much is being spent; how quickly it is being spent; amount of time left to turn a profit.
Data sources: Bank accounts, profit and loss report, balance sheet report, expense report.
Targets: Having a reasonable amount of time left before the business runs out of money.
Decisions: What profit making activities need to be prioritized; control of discretionary expenses; reporting to investors.
Detailed expense report
What it’s for: A “deep dive” into where you’re spending money.
KPIs: Expense categories and types.
Data sources: Accounting, invoicing, and expense software; HR reports (staff costs); capital / project costs.
Targets: Keeping expenses under a predetermined limit.
Decisions: Understanding where and how you can control discretionary spending.
Sales pipeline report
What it’s for: Understanding the sales you have coming in, sales funnels and cycles.
KPIs: No. of sales; value of sales; place in the sales cycle.
Data sources: Customer relationship management (CRM) system.
Targets: A healthy balance of sales throughout the pipeline.
Decisions: Focusing on “dropout” rates in the sales pipeline; informing marketing strategies and campaigns.
Marketing return on investment (ROI) report
What it’s for: Understanding the effectiveness of your marketing.
KPIs: How much you’re spending on marketing campaigns; number and value of customers you’re getting as a result; conversion rates.
Data sources: Marketing campaigns, sales pipeline report.
Targets: Desired return on investment (for every $ spent on marketing, what are you seeing in sales / profit?).
Decisions: Trying and refining different types of marketing to maximize profits.
Keyword report
What it’s for: Understanding how keywords are performing in search.
KPIs: The frequency, placement, impressions, and clicks certain keywords receive.
Data sources: Webmaster Tools / Search Console, other keyword analytics tools.
Targets: Improved search positioning, impressions, and clicks.
Decisions: Focusing efforts on search engine optimization and other website promotion.
Website usage report
What it’s for: Understanding how your audience finds and uses your business website.
KPIs: Key parts of Google Analytics or other analytics tools.
Data sources: Google Analytics or other analytics tools.
Targets: Improved website engagement, more time on site, lower bounce rates.
Decisions: Making changes to your website to improve retention and sales.
Customer service report
What it’s for: Understanding how your existing customers are being dealt with.
KPIs: Number of issues; response times; fix rates; customer complaints.
Data sources: Customer service reporting software.
Targets: Reduced response times and complaints; fewer issues overall.
Decisions: Making improvements to customer service processes.
This is just a small selection of the types of reports you could create. That’s why it’s vital to base reports on decision making and insight, rather than producing them just because you can.
Advanced Techniques, Hints and Tips
Now you know why you need reports, how to create them, and what they should show. Here’s a collection of hints, tips, and advice for enhancing your reports even further.
Reporting automation
Putting reports together can take a lot of manual work. Fortunately, there are lots of tools and technologies to make reporting easier. With these tools, you just tell the software what you need, give it various inputs, tell it how you want information displayed, set some other configuration and let it do its thing.
Services like Datorama, E-Tabs, Adaptive Planning, Dataccuity, Zoho Reports, and others let you gather and report on data from lots of different sources.
Reporting dashboards
Reporting dashboards are becoming a popular way to show important information. Designed to fit on one display screen, they gather data from across your business and report all of it in one place. This can be useful if you need information immediately.
Geckoboard, LogiAnalytics, and iDashboards are popular providers in this space.
Reporting by exception
Sometimes, you only need to know when something has gone wrong (i.e. breached one of your targets.) Think of this as a “No news is good news” school of reporting. I call this “reporting by exception,” or in other words, tell me when I need to pay attention to something. Reporting by exception works best when you know the targets you want to reach and you have enough historical data to see how often you’re meeting them.
Services such as IFTTT and Zapier feature many integrations with other apps and they can let you know if a certain event happens.
Refining your data and targets
Reports shouldn’t be static. As your business evolves, your decisions will change. This means you should review your reports periodically. Do they still show the right KPIs? Have your targets changed? Do you need different types of insight? Is all the data still useful? Remember, you’re trying to make the most efficient use of your time, so make sure your reports let you do that.
The Results of Reporting
I’m going to finish this guide to reporting by talking about what you’ll get out of it. In addition to letting you make informed decisions, reporting does one other critical thing:
It shows you what the results of your decisions are.
Say you want to start a new marketing campaign because your sales are falling. You do some analysis of your marketing, carry out some advertising, and as a result see your sales pipeline increase. You’ll see all of this in your reports. It’s a way of understanding how the actions you’ve taken have driven business success.
This is an important way of thinking about reports. Although they show information about the past, it’s the decisions you make now which will improve things for tomorrow. You can directly tie your choices to the success of your business. This gives you more confidence in making informed decisions as your business continues to grow.
I hope you’ve found this reporting guide useful, and that I’ve convinced you reporting doesn’t need to be “something you have to do.” Instead, it’s an incredibly useful tool for getting the information you need, making the right decisions, and seeing your business prosper as a result.
Frequently Asked Questions (FAQs) on Creating Effective Business Reports
What are the key elements to include in a business report?
A business report should include an executive summary, introduction, methodology, findings, conclusions, and recommendations. The executive summary provides a brief overview of the report’s content. The introduction sets the context and outlines the report’s purpose. The methodology section explains the methods used to gather data. The findings section presents the data collected, while the conclusions section interprets the data. Finally, the recommendations section suggests actions based on the report’s findings.
How can I make my business report visually appealing?
Visual elements can greatly enhance the readability and impact of your business report. Use graphs, charts, and tables to present data in a clear and concise manner. Infographics can also be used to simplify complex information. Ensure that your visual elements are relevant, accurately represent your data, and are clearly labeled.
How can I ensure my business report is clear and concise?
Clarity and conciseness are key in business reporting. Avoid jargon and use simple, straightforward language. Break up your text into short paragraphs and use bullet points or numbered lists where appropriate. Always proofread your report for clarity, grammar, and spelling errors.
How can I make my business report more engaging?
To make your business report more engaging, start with a compelling introduction that grabs the reader’s attention. Use storytelling techniques to present your data and findings. Incorporate visuals to break up text and highlight key points. Finally, end with a strong conclusion that reinforces the report’s main points.
How can I effectively present data in my business report?
Data presentation is crucial in business reporting. Use charts, graphs, and tables to visually represent your data. Make sure your data is accurate, relevant, and up-to-date. Always provide a clear explanation of what the data represents and why it’s important.
How can I ensure my business report is objective and unbiased?
To ensure objectivity and avoid bias, always base your report on reliable data and evidence. Avoid making assumptions or drawing conclusions without sufficient evidence. Be transparent about your methodology and any limitations in your data or research.
How can I effectively structure my business report?
A well-structured business report is easier to read and understand. Start with an executive summary, followed by an introduction, methodology, findings, conclusions, and recommendations. Use headings and subheadings to organize your content and guide the reader through the report.
How can I make my business report more persuasive?
To make your business report more persuasive, clearly state your argument or position in the introduction. Use data and evidence to support your argument. Present counterarguments and refute them with evidence. End with a strong conclusion that reinforces your argument.
How can I improve my business report writing skills?
Improving your business report writing skills takes practice. Start by reading and analyzing good business reports. Take note of their structure, language, and presentation of data. Attend workshops or take online courses on business report writing. Always seek feedback on your reports and use it to improve.
How can I tailor my business report to different audiences?
Understanding your audience is key to effective business report writing. Tailor your language, tone, and content to suit your audience’s needs and expectations. For a technical audience, provide detailed data and analysis. For a non-technical audience, simplify complex information and focus on the key points.