Visualize Your Code’s Quality with PhpMetrics

We had been looking into code quality checking tools for a while here on SitePoint – most recently in a series on Jenkins, but none of those could do what a project I’ve only recently found out about can.
PhpMetrics uses D3 and some sophisticated analysis algorithms to scan your application’s code and output intricate reports about it.

Key Takeaways
- PhpMetrics is a tool that uses D3 and analysis algorithms to scan PHP application code and provide detailed reports about it. It offers metrics on code complexity, maintainability, and other attributes.
- The tool provides visual representations of the code, including color-coded circles that indicate code complexity and maintainability. The size and color of the circles are determined by a combination of standard metrics for code complexity and maintainability.
- PhpMetrics also provides a detailed report in a tabular form, which includes data from lines of code to the number of classes. It also offers a custom chart feature that allows for comparison of different metrics like the ratio of Cyclomatic Complexity (CC) and lack of cohesion in methods (Lcom) for each file.
- The tool can be used to compare different projects, as demonstrated in the comparison between Laravel and Symfony. The comparison revealed that Laravel is more new-developer friendly, simpler in algorithms, and less bloated in file size. Symfony, on the other hand, was found to be more complex and voluminous.
Installing and Using PhpMetrics
It’s a bit hard to talk about it without seeing a proper example, so let’s install and run it, then explain every part.
Environment
To test it, we’ll need an isolated environment. As usual, we’ll be using our trusty Homestead Improved Vagrant box, making sure all readers have the same environment to test on.
Installing PhpMetrics
Like with any modern PHP project, installing is very simple. We’ll install it globally, making it available to all projects on the machine.
sudo composer global require 'halleck45/phpmetrics'Fetching the Code
We’ll test PhpMetrics on two code-heavy projects: Laravel and Symfony, in framework, not project form. That means we won’t be using the create-project command from Composer, but the bare source of each framework.
git clone https://github.com/symfony/symfony symframe
git clone https://github.com/laravel/framework lframe
We do this to avoid any and all dependency testing, and to stay away from non-framework related code.
Using PhpMetrics on a Code-Heavy Project
Now that we’ve got the projects downloaded, let’s run PhpMetrics on them.
mkdir Laravel
mkdir Laravel/public
phpmetrics --report-html=/Laravel/public/report_symfony.html symframe
phpmetrics --report-html=/Laravel/public/report_laravel.html lframe
Never mind the fact that we’re using “Laravel” folders here for the reports, they’re just Homestead’s defaults and we can just reuse them for our small example to reduce the configuration steps. This lets us easily access the reports at the following URLs:
homestead.app:8000/report_symfony.html

homestead.app:8000/report_laravel.html
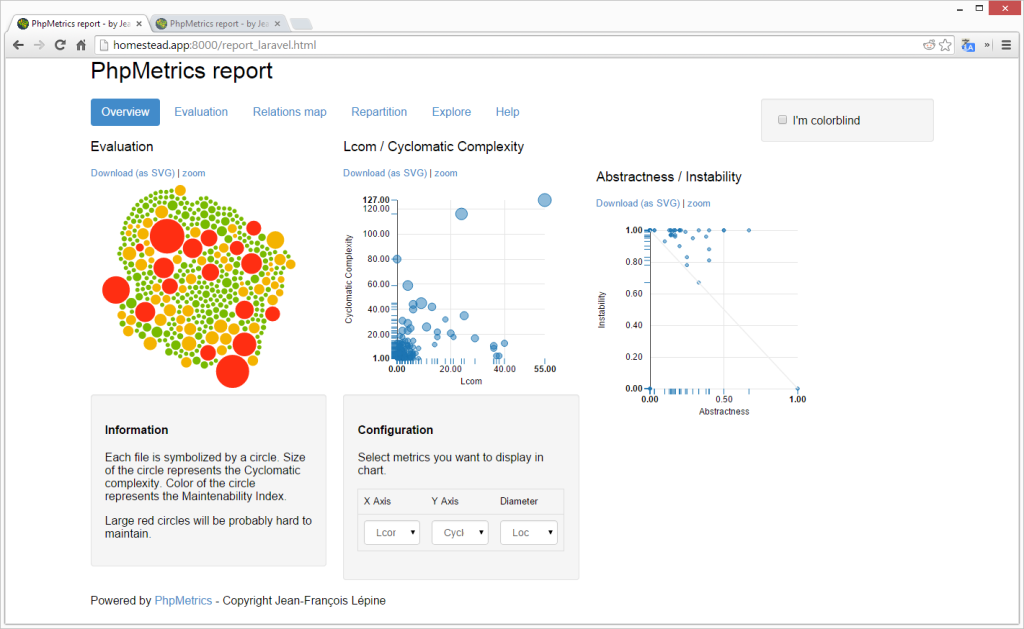
Here’s what Laravel’s report gets us:
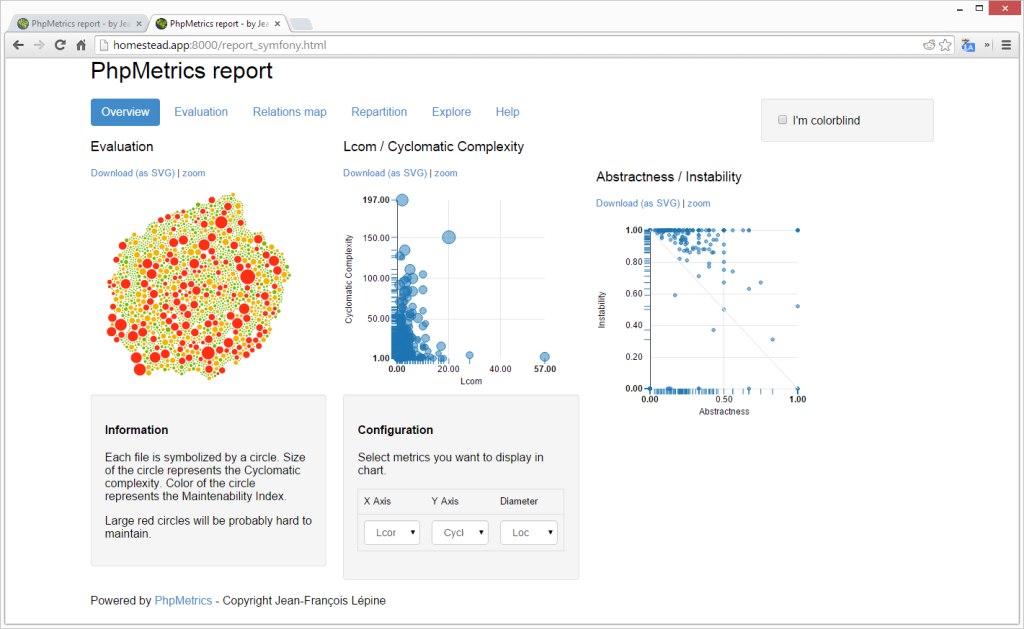
and here’s what we get by analyzing Symfony:
Analysis
PhpMetrics offers a plethora of metrics. Let’s demystify those circles and graphs and find out what we’re looking at!
Color coding
As per the how to read the report guide, we can immediately notice Symfony is a bit heavy on the orange-red side, while the grass is greener on Laravel’s side. One important thing to notice, however, is how many more files Symfony contains as opposed to Laravel – you can see this clearly by comparing the density of circles.
PhpMetrics was built with color blind people in mind, so the “color blind” checkbox changes the colors in the circles from green, yellow, orange to stripes at different angles:
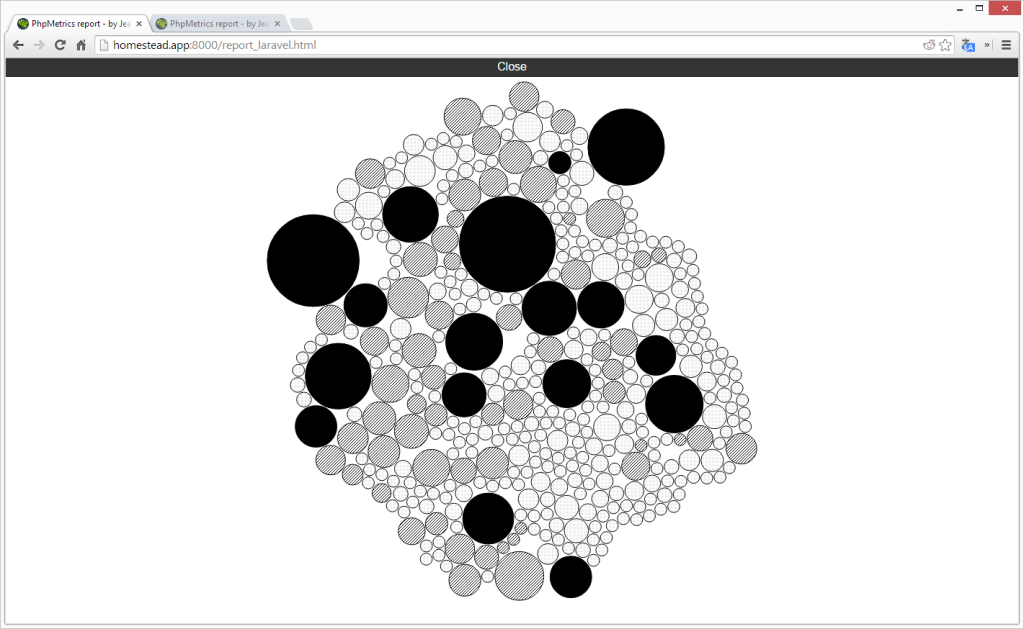
The color coding is the first aspect you can look at, and the first place to look for hints at problems.
Cyclomatic Complexity and Maintainability Index
The circles, when looked at carefully, represent the CC and MI, and, as the documentations says, large red circles will probably be very hard to maintain.
Both are easily Googleable, but let me spare you the wiki skimming and explain them in layman terms.
Cyclomatic Complexity essentially measures the number of paths to take through a script’s logic. The more paths can be taken, the more complex a file is. A good way to avoid high CC is to make sure your code is as modular and atomic as possible, which becomes second nature when you’re following SOLID principles.
Like Wikipedia says, the Maintainability Index is calculated with certain formulae from lines-of-code measures, McCabe measures and Halstead complexity measures. Lines-of-code measures are self-explanatory – literally counting the number of lines of code. McCabe measures, much as it sounds like a USA political promise, is actually just another name for Cyclomatic Complexity. Halstead complexity is a set of formulae which try to look at the syntax of the file’s code and deduce attributes such as difficulty, code vocabulary, effort, etc. If you’re interested in the specific formulae, check the Wikipedia article out.
Taking all these into effect, the circles are sized and color coded, indicating the sum of all standard metrics for code complexity and maintainability.
Tables
If you’d like to see all the data in a more tabular form, you can check the “Explore” tab in the report file:
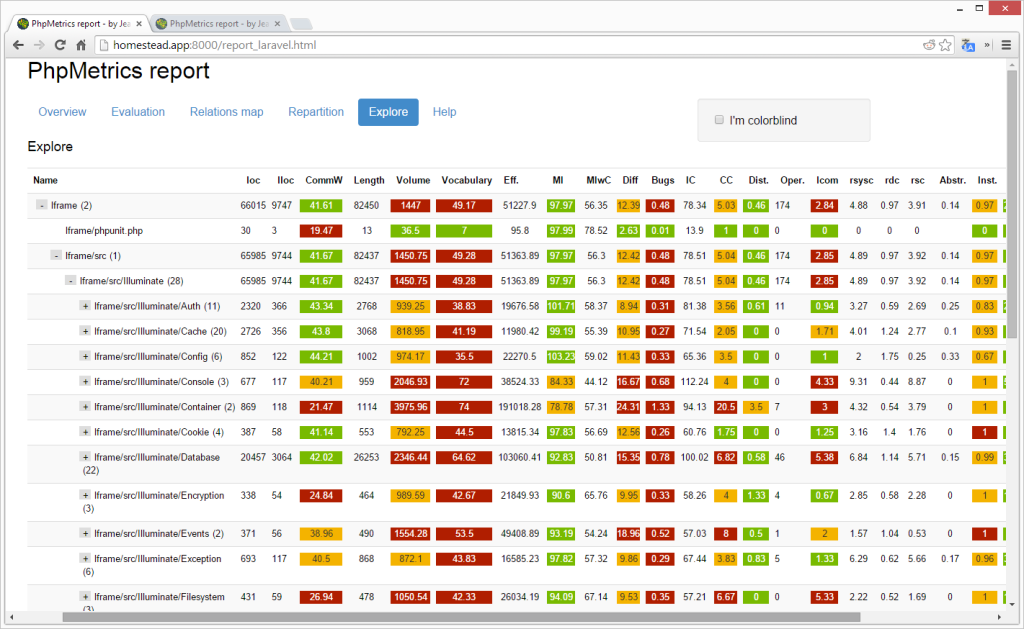
This table will include all the above and more – from lines of code to number of classes and more – both per folder and file. This incredibly detailed report is what you should refer to when looking for highly precise information about your code all in one place.
Custom Chart
The middle area in the report’s overview screen contains the custom chart.

In the example above, we’re comparing the ratio of CC (mentioned above) and Lcom (lack of cohesion in methods) for each file, but you just as easily switch out the X or Y axis value for something else. For example, here’s a comparison of Difficulty per Lines of Code – you can notice that Laravel’s trend is somewhat proportional – with more LoC, more Difficulty is assumed, while Symfony tends to be all over the place with certain files.
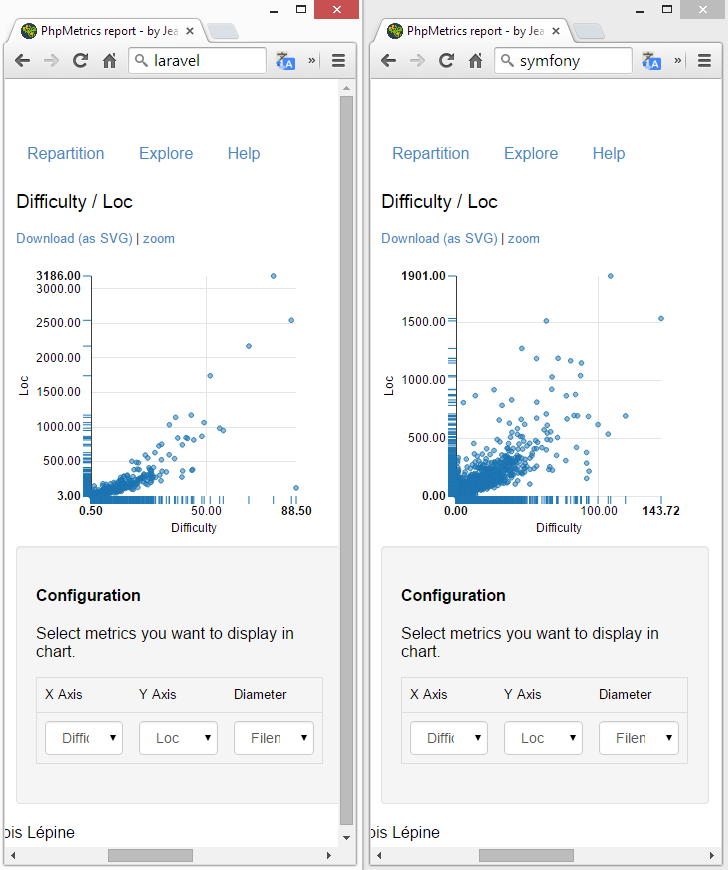
For example, the Symfony file BinaryNode.php has a very high difficulty for its 150 lines of code, while Response.php in its whopping 1275 lines of code has a very low difficulty score. Explore the files that produce curious results, and see what you can find out from these insights.
Abstractness / Instability
This chart is very well explained here, but in a nutshell, the average diagonal line is called the balance line, or, the Main Sequence. The goal is to have your classes as close to the line as possible, because this means they’re balanced between being abstract and concrete enough. I do encourage you to read the content at the link above – it’s an easy read and should clear things up.
For some reason, I couldn’t get A/I to work on my local environment properly with Laravel and Symfony.
Evaluation
Evaluation is a web chart which takes the average of various attributes of your entire project, compares these numbers to the standard of other projects the tool has learned so far, and then superimposes your values over those. This is purely cosmetic and carries no real value, as the disclaimer on the Evaluation page says.
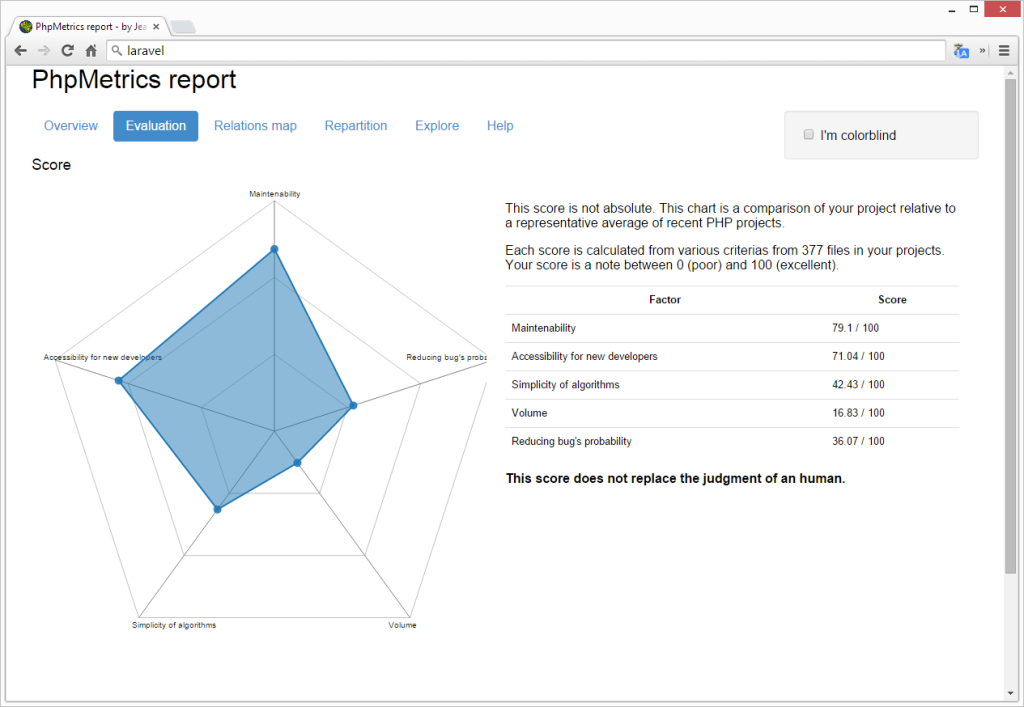
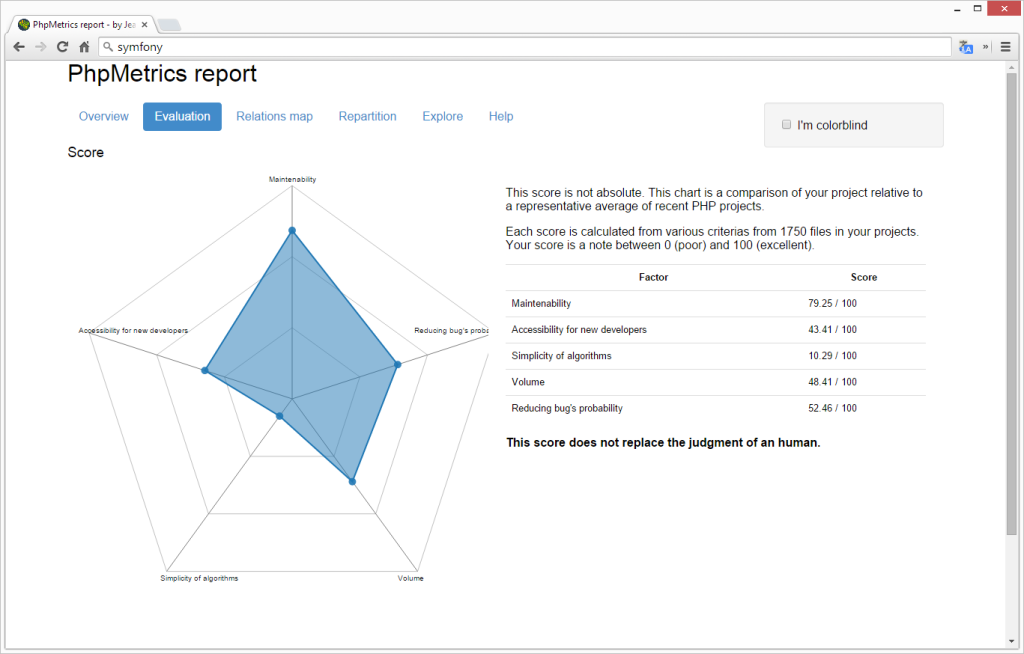
While the tool believes both frameworks are equally maintainable, its not such a shocking conclusion here that Laravel is more new-developers friendly and far more simplistic in algorithms, not to mention less voluminous.
Relations Map
The relations map is more useful for smaller projects – it lets you see the relations between classes. If a class extends or implements another, the relations map will show it. Due to the brutal number of classes in both of these projects and their connections, the map is less than useful here – in fact, it doesn’t even load for Symfony for me. But if you go ahead and try it out on a test project with a smaller number of classes, you’re bound to see the benefits.
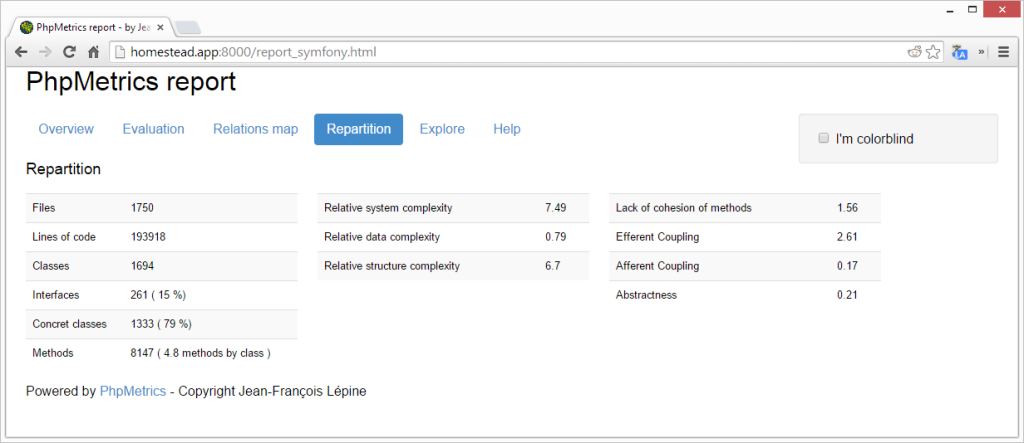
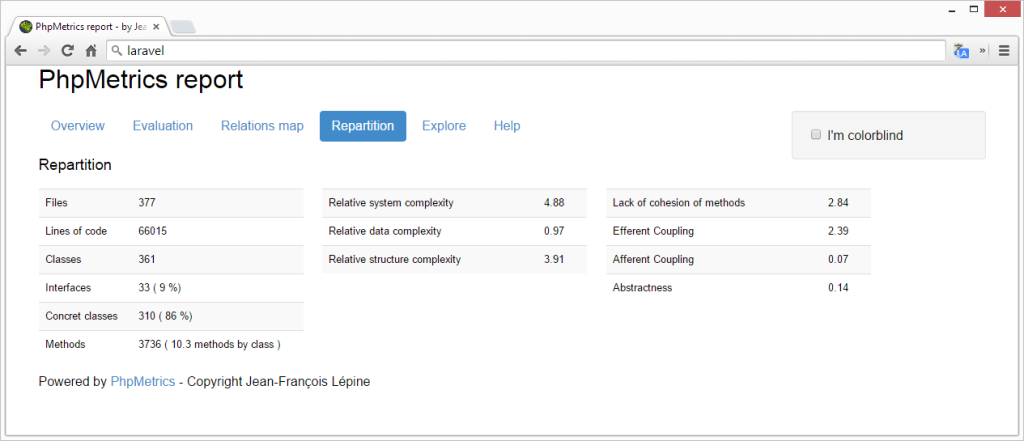
Repartition
Finally, the repartition screen sums up all the data in a format much simpler than the Explore tab, listing out some totals only:
Symfony:
Laravel:
Comparison Results
So, what’s to be concluded from these results? Without looking into it too much, we can easily conclude that:
- Laravel is more friendly to new developers, simpler in algorithms and less bloated in file size.
- Laravel is drastically more lightweight. Symfony has at least three times more anything than Laravel – methods, classes, files, lines of code… it’s three times more massive.
- Symfony is more relatively complex (middle column on the Repartition screen)
- Laravel is much more stable in complexity across files – they have the same ratio of difficulty and lines of code, while Symfony can vary wildly.
- Symfony could use some work in making some of the more complex files more atomic – the big red circles are taking over its circle graph.
See what else you can learn by playing with the charts and data yourself, then let us know!
Conclusion
PhpMetrics is another in a long line of code quality analyzers, but one with a twist. Rather than looking at the typical code standard issues we’ve come to expect, it looks at a whole set of new attributes and explains your code to you in beautiful math, as soon as you learn its language. To find out what each attribute means, consult the chart.
Will you be using PhpMetrics to scan your projects? Would you install it into your IDE? Is it something you might see as a permanent addition to your CI process? Let us know your thoughts in the comments!
Frequently Asked Questions (FAQs) about PHPMetrics
What is PHPMetrics and why is it important?
PHPMetrics is a static analysis tool for PHP that provides a detailed report on the quality of your code. It measures various metrics such as cyclomatic complexity, maintainability index, and coupling. The importance of PHPMetrics lies in its ability to help developers understand their code better, identify potential issues, and improve the overall quality of their code. It provides a visual representation of the code, making it easier to understand the structure and dependencies.
How do I install PHPMetrics?
PHPMetrics can be installed using Composer, a dependency management tool for PHP. You can install it by running the command composer global require 'phpmetrics/phpmetrics'. After the installation, you can run PHPMetrics on your project by using the command phpmetrics --report-html=myreport.html /path/to/your/project.
How do I interpret the results from PHPMetrics?
PHPMetrics provides a detailed report with various metrics. Each metric provides different insights about your code. For example, the cyclomatic complexity measures the complexity of your code, the higher the value, the more complex your code is. The maintainability index measures how easy it is to maintain your code, the higher the value, the easier it is to maintain. Understanding these metrics can help you improve the quality of your code.
Can PHPMetrics analyze the quality of object-oriented code?
Yes, PHPMetrics is capable of analyzing object-oriented code. It provides metrics such as lack of cohesion of methods (LCOM) and coupling between object classes (CBO) which are specifically designed for object-oriented code.
What is the difference between PHPMetrics and other static analysis tools?
PHPMetrics stands out from other static analysis tools due to its focus on code quality metrics and its visual representation of the code. While other tools may focus on finding bugs or enforcing coding standards, PHPMetrics provides a comprehensive overview of the quality of your code.
Can PHPMetrics help me identify potential issues in my code?
Yes, PHPMetrics can help identify potential issues in your code. By analyzing various metrics, it can highlight areas of your code that are overly complex, hard to maintain, or tightly coupled. This can help you identify areas of your code that need refactoring.
How can I integrate PHPMetrics into my development process?
PHPMetrics can be integrated into your development process by running it regularly on your codebase. This can be done manually or as part of your continuous integration pipeline. By regularly analyzing your code, you can track the quality of your code over time and ensure that it remains high.
Can PHPMetrics analyze the quality of my test code?
Yes, PHPMetrics can analyze the quality of your test code. It provides metrics such as testability which measures how easy it is to test your code. By analyzing your test code, you can ensure that it is of high quality and effectively tests your application.
Can I customize the metrics that PHPMetrics analyzes?
Yes, PHPMetrics allows you to customize the metrics that it analyzes. You can specify which metrics you are interested in by using the --config option when running PHPMetrics.
How can PHPMetrics help me improve the quality of my code?
PHPMetrics can help improve the quality of your code by providing a detailed overview of various code quality metrics. By understanding these metrics, you can identify areas of your code that need improvement and take steps to refactor and improve your code.
Bruno is a blockchain developer and technical educator at the Web3 Foundation, the foundation that's building the next generation of the free people's internet. He runs two newsletters you should subscribe to if you're interested in Web3.0: Dot Leap covers ecosystem and tech development of Web3, and NFT Review covers the evolution of the non-fungible token (digital collectibles) ecosystem inside this emerging new web. His current passion project is RMRK.app, the most advanced NFT system in the world, which allows NFTs to own other NFTs, NFTs to react to emotion, NFTs to be governed democratically, and NFTs to be multiple things at once.