


Key Takeaways
- Chartkick is a Rails-compatible gem that simplifies the process of creating interactive and visually appealing graphs, supporting libraries like Google Charts, Highcharts, and Chart.js.
- The integration of Chartkick allows for easy customization and asynchronous loading of data, enhancing user experience by not bogging down page performance.
- Additional gems like Groupdate and Hightop can be used alongside Chartkick to extend functionality, such as grouping data by dates or finding popular data points.
- Chartkick supports various types of charts, including bar, column, line, and pie charts, which can be rendered asynchronously to improve web application performance.
- The article provides detailed examples and code snippets to help integrate Chartkick in a Rails application, demonstrating its ease of use and flexibility in handling different data visualization requirements.
We work with data presented in the various formats every day. From my point of view, one of the most convenient formats for presenting numerical data is a graph. Users like graphs, especially interactive ones, because they are beautiful and fun – in contrast to dull static tables.
There are many solutions to render beautiful interactive graphs in web apps, but today we will discuss something special: a solution built for Rails that makes rendering graphs a breeze. This solution is called Chartkick and it was built by Andrew Kane. Chartkick can work with Google Charts, Highcharts, and Chart.js. It has many options for customization and also has a bunch of supporting libraries like groupdate, hightop, and active_median.
In this article we will discuss how to integrate Chartkick into a Rails app, render various graphs, customize them, make them load asynchronously, and how to further power up your code with groupdate and hightop gems.
The source code can be found on GitHub.
The working demo is available at Heroku.
Preparing the Application
Go ahead and create a new Rails application:
$ rails new HappyGrapher -T
For this article I’ll be using Rails 5 release candidate, but the provided code examples should work with Rails 4 and 3 as well.
Suppose our app keeps track of “sporters” (athletes) and the competitions in which they participate. Here is the information about all tables we will require:
sporters
name(string)age(integer) – for this demo let’s suppose the age lies in the interval from 18 to 50country_id(integer) – a foreign key to establish relation between thesportersandcountries
countries
title(string) – we will add 50 random countries into our database
competitions
title(string) – we will have a bunch of absolutely random competitions
competition_results
This will be an intermediate table to establish a many-to-many relation between sporters and competitions.
sporter_id(integer) – a foreign keycompetition_id(integer) – a foreign keyplace(integer) – which place did the sporter take. For this demo, we’ll suppose that this column may take values from 1 to 6.
Create and apply all the necessary migrations:
$ rails g model Country name:string
$ rails g model Sporter name:string age:integer country:references
$ rails g model Competition title:string
$ rails g model CompetitionResult sporter:references competition:references place:integer
$ rake db:migrate
Also create a controller, a view and a root route:
statistics_controller.rb
class StatisticsController < ApplicationController
  def index
  end
end
views/statistics/index.html.erb
<h1>Statistics</h1>
config/routes.rb
[...]
root 'statistics#index'
[...]
So far so good, but to render charts we will obviously require some sample data, so let’s add that now.
Loading Sample Data
To speed up the process of loading sample data, I’ll use two gems: faker that allows you to generate various texts from names and e-mails to paragraphs and pseudo-hacker phrases, and countries that greatly simplifies fetching information about existing countries. Add these gems into the Gemfile:
Gemfile
[...]
gem 'countries'
gem 'faker'
[...]
and install them:
$ bundle install
Now open up seeds.rb file and paste this code to add 50 countries:
db/seeds.rb
ISO3166::Country.all.shuffle.first(50).each do |country|
  Country.create({name: country.name})
end
This will add totally random countries so don’t be surprised if you’ll end up having Antarctica or Sao Tome in your table.
Now we also need a bunch of sporters:
db/seeds.rb
100.times { Sporter.create({
             name: Faker::Name.name,
             age: rand(18..50),
             country_id: rand(1..50)
         }) }
Here we use Faker to generate a sample name.
Next, competitions. I wasn’t able to find any ready-to-use list, so we’ll type sports names by hand:
db/seeds.rb
%w(tennis parachuting badminton archery chess boxing racing golf running skiing walking cycling surfing swimming skeleton).each {|c| Competition.create({title: c}) }
And, lastly, the competition results:
db/seeds.rb
Competition.all.each do |competition|
  sporters = Sporter.all.shuffle.first(6)
  (1..6).each do |place|
    CompetitionResult.create({
                       sporter_id: sporters.pop.id,
                       competition_id: competition.id,
                       place: place,
                       created_at: rand(5.years.ago..Time.now)
                    })
  end
end
Notes that we override the created_at column pretending that a competition took place some years or months ago.
Displaying a Simple Chart
Okay, everything is ready to start implementing the core functionality – graphs. Add the chartkick gem into the Gemfile:
Gemfile
[...]
gem 'chartkick'
[...]
and install it:
$ bundle install
Chartkick supports both Google Charts and Highcharts and Chart.js (starting from version 2.0 this is the default adapter.) For this demo I’ll be using Highcharts, but the installation process of Google Charts is very similar.
First of all, download the latest version of Highcharts and place it inside the javascripts directory (alternatively you may load it via CDN by adding javascript_include_tag into the layouts/application.html.erb). Next, add these two files:
javascripts/application.js
[...]
//= require highcharts
//= require chartkick
[...]
That’s pretty much – we can now render charts. For starters, let’s display a bar chart illustrating sporters’ ages.
Load all sporters:
statistics_controller.rb
[...]
def index
  @sporters = Sporter.all
end
[...]
and tweak the view:
views/statistics/index.html.erb
<%= bar_chart @sporters.group(:age).count %>
We simply group sporters by age and calculate the number of items in each group. Really simple.
You are probably wondering how to define settings for your graph to give it a name, adjust width, height, and other stuff. That’s easy as well – some settings are being passed as arguments directly to the bar_chart (and other similar methods), other are being set inside the :library option.
Create a new StatisticsHelper and extract code there:
statistics_helper.rb
module StatisticsHelper
  def sporters_by_age
    bar_chart @sporters.group(:age).count, height: '500px', library: {
      title: {text: 'Sporters by age', x: -20},
      yAxis: {
         allowDecimals: false,
         title: {
             text: 'Ages count'
         }
      },
      xAxis: {
         title: {
             text: 'Age'
         }
      }
    }
  end
end
:library contains library-specific settings. Here we are preventing decimal numbers from appearing on the Y axis (obviously, we can’t have 2,5 sporters aged 20) and give it a name. X axis also has a name defined. On top of that, provide the name for the whole graph (it will appear at the bottom by default). Highcharts has loads of other options available, so be sure to browse its documentation.
Also note that settings can be defined globally as well.
Using Hightop
If you wish to display only the most “popular” ages among sporters, use the hightop gem – a small but useful library designed to solve such tasks. Simply include it into the Gemfile:
Gemfile
[...]
gem 'hightop'
[...]
and run
$ bundle install
Now you can display, for example, the ten most popular ages:
views/statistics/index.html.erb
<%= bar_chart @sporters.top(:age, 10) %>
Rendering Graphs Asynchronously
If your database has a lot of data to process in order to render a graph, the page will load slowly. Therefore, it is better to render your graphs asynchronously. Chartkick supports this functionality, too. All you have to do is create a separate route and a controller action, then use this route inside a view. Note that it requires jQuery or Zepto.js to be present.
Create a new route:
config/routes.rb
[...]
resources :charts, only: [] do
  collection do
    get 'sporters_by_age'
  end
end
[...]
and a controller:
charts_controller.rb
class ChartsController < ApplicationController
  def sporters_by_age
    result = Sporter.group(:age).count
    render json: [{name: 'Count', data: result}]
  end
end
Having this in place, simply modify your helper to call the newly created route:
statistics_helper.rb
[...]
def sporters_by_age
  bar_chart sporters_by_age_charts_path, height: '500px', library: {
    [...]
  }
end
[...]
Now your chart will be loaded asynchronously allowing users to browse other contents on the page. The @sporters instance variable is not needed anymore, so you can remove it from the index method of StatisticsController.
More Graph Types
Column Chart
To demonstrate the usage of the column chart, let’s display how many sporters each country has. First of all, create a new helper similar to the one we defined earlier:
statistics_helper.rb
[...]
def sporters_by_country
  column_chart sporters_by_country_charts_path, library: {
      title: {text: 'Sporters by country', x: -20},
      yAxis: {
          title: {
              text: 'Sporters count'
          }
      },
      xAxis: {
          title: {
              text: 'Country'
          }
      }
  }
end
[...]
Use it inside the view:
views/statistics/index.html.erb
[...]
<%= sporters_by_country %>
[...]
Add the route:
config/routes.rb
[...]
resources :charts, only: [] do
  collection do
    get 'sporters_by_age'
    get 'sporters_by_country'
  end
end
[...]
As for the controller action, it is going to be a bit more complex as we have to construct the result manually:
charts_controller.rb
[...]
def sporters_by_country
  result = {}
  Country.all.map do |c|
    result[c.name] = c.sporters.count
  end
  render json: [{name: 'Count', data: result}]
end
[...]
Note how the result hash is being constructed – the key is the country’s name and the value is the total number of sporters.
Reload the page and observe the result!
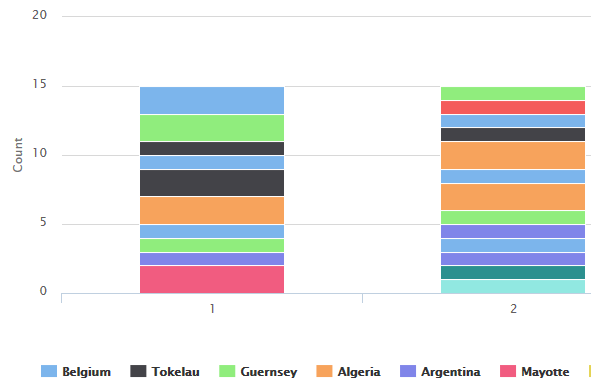
Stacked Column Chart
Let’s also display how many times each country took a certain place (from 1 to 6). Once again, define a new helper:
statistics_helper.rb
[...]
def results_by_country
  column_chart results_by_country_charts_path, stacked: true, height: '500px', library: {
      title: {text: 'Results by country', x: -20},
      yAxis: {
          title: {
              text: 'Count'
          }
      },
      xAxis: {
          title: {
              text: 'Countries and places'
          }
      }
  }
end
[...]
Note the stacked: true option that provides the following result:
Use the helper inside the view:
views/statistics/index.html.erb
[...]
<%= results_by_country %>
[...]
Add the route:
config/routes.rb
[...]
resources :charts, only: [] do
  collection do
    get 'sporters_by_age'
    get 'sporters_by_country'
    get 'results_by_country'
  end
end
[...]
Lastly, create the controller action:
charts_controller.rb
[...]
def results_by_country
  result = Country.all.map do |c|
    places = {}
    (1..6).each do |place|
      places[place] = c.sporters.joins(:competition_results).
          where("competition_results.place = #{place}").count
    end
    {
        name: c.name,
        data: places
    }
  end
  render json: result
end
[...]
We take all the countries and use map to construct an array of data. Inside, find all the sporters from this country who took a certain place. joins is used to join with the competition_results table because information about the place is stored there. Then simply use where and count to get the desired value. Then, as we’ve already seen, assign the country’s name for the :name and the places hash for the :data. As a result, an array of hashes will be created.
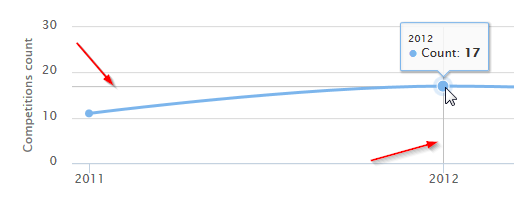
Line Chart and Groupdate
The last chart type we will tackle today is the line chart. To demonstrate it, let’s display how many competitions were held each year.
Once again, create a helper
statistics_helper.rb
[...]
def competitions_by_year
  line_chart competitions_by_year_charts_path, library: {
      title: {text: 'Competitions by year', x: -20},
      yAxis: {
          crosshair: true,
          title: {
              text: 'Competitions count'
          }
      },
      xAxis: {
          crosshair: true,
          title: {
              text: 'Year'
          }
      }
  }
end
[...]
:crosshair option is used to display a helpful crosshair following the user’s pointer.
Use this helper in your view:
views/statistics/index.html.erb
[...]
<%= competitions_by_year %>
[...]
and add a new route:
config/routes.rb
[...]
resources :charts, only: [] do
  collection do
    get 'sporters_by_age'
    get 'sporters_by_country'
    get 'results_by_country'
    get 'competitions_by_year'
  end
end
[...]
Now we need to create a new controller action, but how are we going to group competitions by year and count them? Of course, we may construct our own query, but the author of Chartkick already took care of it and crafted a handy Groupdate gem. As the name suggests, it allows you to group records by year, month, day, and more. It supports timezones, ranges of dates, formatting, ordering, and other fancy stuff, so it is a nice solution to use with Chartkick.
Add Groupdate into your Gemfile:
Gemfile
[...]
gem 'groupdate'
[...]
The only problem with Groupdate is that it does not support SQLite3, so you’ll have to user some other DMBS. For this demo I’ll be using PostgreSQL. Please note that if you decide to use MySQL, timezone support must be installed as well.
Tweak your Gemfile once again by replacing sqlite3 with the pg gem:
Gemfile
[...]
gem 'pg'
[...]
Then install the gems:
$ bundle install
and modify the database.yml config file:
config/database.yml
[...]
development:
  adapter: postgresql
  encoding: unicode
  database: your_database
  pool: 5
  username: your_user
  password: your_password
  host: localhost
  port: 5432
[...]
Now run the migrations again and populate the tables with sample data
$ rake db:migrate
$ rake db:seed
Don’t forget to create a database (rake db:create) prior to performing those commands.
Now we can code the controller’s action:
charts_controller.rb
[...]
def competitions_by_year
  result = CompetitionResult.group_by_year(:created_at, format: "%Y").count
  render json: [{name: 'Count', data: result}]
end
[...]
Looks great. The :format option allows you to provide the format for the keys. As long as we want to display only the years, I used %Y. The full list of available directives can be found in the official Ruby documentation.
Reload your page once again and observe the final result. If you are not satisfied with how the graphs look like, play with the display settings found in the Highcharts documentation.
Conclusion
In this article we’ve discussed Chartkick – a great gem to simplify chart rendering. We tried using various types of charts, made them loading asynchronously, and also employed additional gems, like Groupdate and Hightop. Of course, there is more to these gems, so be sure to browse their docs and experiment further with the code.
As always, feel free to post your questions and feedback. Happy charting and see you soon!
Frequently Asked Questions (FAQs) about Graphs and Charts on Rails with Chartkick
How Can I Customize the Appearance of My Charts and Graphs in Chartkick?
Chartkick provides a variety of options for customizing the appearance of your charts and graphs. You can change the colors, add labels, adjust the axes, and much more. To change the color of your chart, you can use the colors option and provide an array of color codes. For example, line_chart data, colors: ["#b00", "#666"] will create a line chart with red and gray lines. To add labels, you can use the label option. For example, pie_chart data, label: "Population" will create a pie chart with a label of “Population”. You can also adjust the axes by using the xtitle and ytitle options. For example, line_chart data, xtitle: "Time", ytitle: "Sales" will create a line chart with “Time” as the x-axis title and “Sales” as the y-axis title.
Can I Use Chartkick to Create Real-Time Charts and Graphs?
Yes, Chartkick supports real-time updates to charts and graphs. This is particularly useful for displaying data that changes frequently, such as stock prices or sensor readings. To create a real-time chart, you need to use the refresh option and provide a URL that returns the updated data. For example, line_chart data_path, refresh: 5 will create a line chart that fetches new data from the data_path URL every 5 seconds. Please note that the URL should return data in the same format as the initial data.
How Can I Add Interactivity to My Charts and Graphs in Chartkick?
Chartkick allows you to add interactivity to your charts and graphs by using the library option. This option lets you pass additional options to the underlying charting library (Google Charts or Highcharts). For example, you can add tooltips, enable zooming, and much more. The exact options available depend on the charting library you are using. Please refer to the documentation of the respective library for more information.
Can I Use Chartkick with Other Ruby on Rails Gems?
Yes, Chartkick is designed to work seamlessly with other Ruby on Rails gems. For example, you can use it with the Groupdate gem to easily group data by time or other attributes. You can also use it with the ActiveMedian gem to calculate medians. To use Chartkick with another gem, simply install the gem as usual and then use its methods in your Chartkick charts and graphs.
How Can I Export My Charts and Graphs Created with Chartkick?
Chartkick does not provide a built-in feature for exporting charts and graphs. However, you can use the to_svg method to convert your charts and graphs to SVG format, which can then be saved as an image file or embedded in a web page. Please note that this method requires the Oga gem. To install this gem, add gem 'oga' to your Gemfile and run bundle install.
Can I Use Chartkick to Create 3D Charts and Graphs?
Chartkick does not support 3D charts and graphs directly. However, you can use the library option to pass additional options to the underlying charting library (Google Charts or Highcharts), some of which may support 3D charts and graphs. Please refer to the documentation of the respective library for more information.
How Can I Handle Large Datasets with Chartkick?
Chartkick is designed to handle large datasets efficiently. It does this by aggregating data on the server side before sending it to the client side. This reduces the amount of data that needs to be transferred and processed, resulting in faster chart rendering. However, if you are dealing with extremely large datasets, you may need to implement additional optimizations, such as pagination or sampling.
Can I Use Chartkick to Create Maps?
Yes, Chartkick supports the creation of geochart maps. You can use the geochart method to create a map and provide data in the form of a hash, where the keys are country codes and the values are the data to be displayed. For example, geochart data will create a map where the color of each country corresponds to the value of data[country_code].
How Can I Debug Issues with My Charts and Graphs in Chartkick?
Chartkick provides several tools for debugging issues with your charts and graphs. First, you can use the inspect method to view the raw data and options used to create a chart. Second, you can use the browser’s developer tools to inspect the HTML and JavaScript generated by Chartkick. Finally, you can check the console for any error messages or warnings.
Can I Use Chartkick to Create Multi-Series Charts and Graphs?
Yes, Chartkick supports the creation of multi-series charts and graphs. You can do this by providing data in the form of a hash, where the keys are the series names and the values are the data for each series. For example, line_chart {"Series 1" => data1, "Series 2" => data2} will create a line chart with two series.