Debug Your Rails App With ruby-debug

Key Takeaways
- ruby-debug is a powerful alternative to the older breakpointer tool for debugging Rails applications, offering compatibility with newer versions of Ruby.
- Installation of ruby-debug is straightforward, utilizing RubyGems and requiring only a simple command line input to get started.
- ruby-debug offers an advanced debugging shell, similar to GDB for C, allowing for sophisticated code navigation and manipulation directly from the command line.
- Integration into Rails is seamless, with modifications to the `config/environments/development.rb` file enabling debugging in the development environment.
- ruby-debug is included in EdgeRails, which means it can be activated with a command line argument when starting the server, eliminating the need for explicit configuration in newer Rails setups.
- TextMate users benefit from specific integration features with ruby-debug, enhancing the debugging experience directly from the TextMate editor.
At the start of this year, I published a book through SitePoint titled Build Your Own Ruby On Rails Web Applications. You’ll forgive me if I’m a little biased, but it is, I believe, still the best beginner’s Rails book out there, despite the fact that many other books on Rails have been released since.
One of the best things about the Ruby on Rails framework is that it’s undergoing constant change — it’s continually being improved and tweaked. Unfortunately, this change means that anyone who purchased my book when it was initially published will have been faced with a quandary over which version of Ruby to use:
- You could follow the book’s advice and stick with Ruby 1.8.4. This would allow you to work your way happily through the book (including the chapter on debugging), but it would also mean that you wouldn’t receive the benefits of the bug fixes and security updates that come with having an up-to-date installation of Ruby.
- Alternatively, you could upgrade to a more recent version of Ruby. Doing so, however, would have prevented you from using the breakpointer client — a tool to which much of Chapter 11 is devoted.
At the time of the book’s publication, the breakpointer client was the best tool available for debugging a Rails application. However, breakpointer is not compatible with the latest version of the Ruby programming language.
So what’s a Rails developer to do?
In this article we’ll look at an alternative debugging tool for debugging Rails applications (or any Ruby script, for that matter) while still remaining up-to-date with the latest version of the Ruby interpreter. This tool is even slated to be bundled with future releases of Rails.
The magic new tool to which I’m referring is called ruby-debug.
A quick warning: this isn’t a beginners’ article. I’ll assume that you’ve either read my book, or have a solid understanding of how to develop a web application using Ruby on Rails. Ideally you’ll have Rails installed and will be comfortable with using the Interactive Ruby (irb) shell. It will also help if you’re familiar with shovell, the sample application used in the book; download the sample to play along at home (note: the download is 2.2MB in size).
What Broke Breakpointer?
Before we delve into the inner workings of ruby-debug, let’s look briefly at why a tool as useful as breakpointer came to be incompatible with the language for which it was designed to be used.
The breakpoint library, of which the breakpointer client is a part, was developed and released to the public by Florian Gross. It was built on top of a Ruby extension called binding.of_caller, which relied on a bug in Ruby’s implementation of trace calls. This bug, however, was fixed in Ruby 1.8.5! The result is that both the binding.of_caller extension and the breakpoint library became unusable. The library is also no longer being maintained, so it’s effectively dead.
Say Hello to ruby-debug
Back in July of 2006, Kent Sibilev released the first version of ruby-debug, describing it as “a faster implementation of the standard debug.rb.” Today, ruby-debug is the most viable option with regards to debugging Ruby scripts — and that includes Rails applications.
While it would be beyond the scope of this article for me to explain how ruby-debug works its magic behind the scenes, it suffices to say that ruby-debug uses a natively compiled Ruby extension that’s written in C. The result is that it performs amazingly well, even with very large Ruby scripts.
Comparing Feature Sets
As I described in the tutorial in my book, the breakpointer client allowed us to step into our application at run time and explore it from the command line. While the ruby-debug tool includes similar functionality, it goes way beyond what good old breakpointer had to offer.
Unlike breakpointer, which worked from a simple irb prompt, ruby-debug provides you with a more advanced shell, similar to that provided by GDB, the GNU debugger for the C programming language.
In this shell you can:
- Step forward and backward in your code.
- Execute and skip lines of code (without copying and pasting them from your code editor window).
- List the actual source context at which you’ve stopped your application.
- Step into
irbmode and make use of the same shell that’s used by breakpointer (if you’re someone who finds old habits difficult to shake).
Installing ruby-debug
The following steps will configure your system for debugging with ruby-debug.
First of all, we need to install the ruby-debug library. Since it’s distributed as a RubyGems package, the installation is as easy as typing the following command:
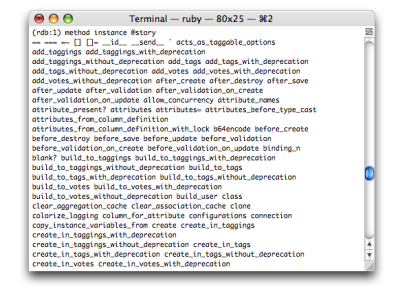
$ sudo gem install ruby-debug -yThe install script will prompt you to indicate the platform on which you’re installing the gem. If you’re on a Mac or a Linux system, select option 1; if you’re on a Windows machine, select option 2. The installation process should look similar to that shown in Figure 1.
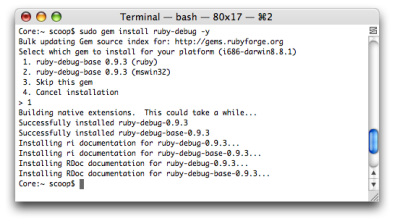
Y is for Yes, Please!
By invoking the gem command with the -y switch, we instructed the utility to automatically install all other packages upon which ruby-debug depends. In this case, those packages include the ruby-debug-base package containing the actual debugger code; the ruby-debug package contains the CLI (command line interface).
With ruby-debug happily installed, we can now place some hooks in our Rails application. For this example, we’ll use the completed shovell application from the book as an example of the process of debugging with ruby-debug. If you’d like to follow along with this example, you should download shovell, the sample application, before reading any further.
In Rails
Making a Rails application aware of ruby-debug is as simple as adding a line to the application’s config/environments/development.rb file:
# config/environments/development.rb

require "ruby-debug"
It makes sense to make this change to our development environment (as compared to, say, config/environment.rb), as this is the preferred environment in which you should perform your debugging. The aim should be to replicate any errors that occur in other environments, so debugging should rarely occur in a testing or production environment.
ruby-debug is part of EdgeRails
Many developers like being on the bleeding edge, and are happy to develop their applications with a version of Rails that’s not guaranteed to be as stable as the official release, in order to receive the very latest feature additions. This version of the framework is referred to as EdgeRails.
Explicitly adding ruby-debug to your application environment is unnecessary if you’re running EdgeRails — simply start the application server with the --debugger argument to load the ruby-debug library.
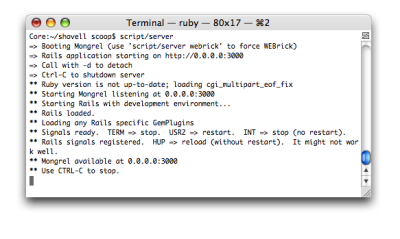
With this setting in place, you can fire up your application server from your Rails application’s root folder:
$ ruby script/serverFigure 2 shows the console output that results when we start the Mongrel server.
Bricks and Mongrels Only
If your development environment makes use of an alternative server, such as lighttpd with FastCGI, you won’t be able to use it as a debugging platform. You’ll need to be running either WEBrick or Mongrel.
At first glance, the console output doesn’t look much different from what we’re used to seeing when we run this command. However, keep a close eye on this window as we progress through this exercise.
Debugging an Application
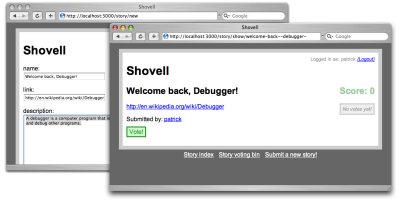
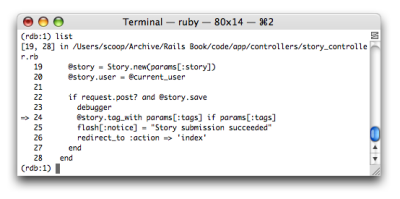
To see our debugger in action, we’ll take a look at a problem that I’ve secretly introduced to the application’s code. If you look at Figure 3, you’ll notice that although we’ve provided a description for the new story we submitted, it doesn’t show up on the final story page. If you’ve read the book, you’ll notice that this example is identical to the example in Chapter 11; instead of solving it with breakpointer, we’ll use ruby-debug.
So, let’s crack the ruby-debug whip at this problem. First, add the debugger keyword to the new action in app/controllers/story_controller.rb, like so:
def new
@story = Story.new(params[:story])
@story.user = @current_user
if request.post? and @story.save
debugger
@story.tag_with params[:tags] if params[:tags]
flash[:notice] = "Story submission succeeded"
redirect_to :action => 'index'
end
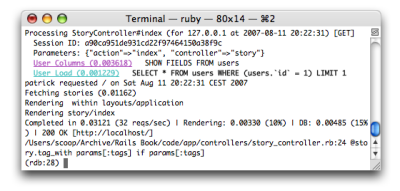
endAs was the case when we used breakpointer on this problem, when you try to submit a story, you’ll now experience the “hanging browser syndrome”, which indicates that your debugger statement has kicked in and you’re ready to debug.
Instead of firing up a separate client to connect to the inner workings of your application, ruby-debug has opened this debugger shell right inside the terminal window in which you’ve fired up your application server, as shown in Figure 4.
From this prompt you can explore your application while it’s paused mid-execution, using a variety of commands. Throughout this example, I’ll indicate the ruby-debug shell prompt using the characters (rdb), and commands typed at this prompt will appear in bold, as follows:
(rdb) listThe ruby-debug Commands
What follows is a quick rundown of the most important ruby-debug commands, along with a brief description of what they do. Don’t worry too much about remembering every last detail — the built-in help command will list all the available commands for you. You can also use the help <commandname> syntax to get help with a specific command.
backtrace: Display a trace of the execution stack, similar to what is displayed when your application raises an exception.break/delete: Display a list of breakpoints that have been set in your application. This command is also used to set new breakpoints, or delete existing ones, from within the ruby-debug shell.cont: Leave the current debugger shell and resume execution of the application until the next breakpoint is encountered.irb: Invoke an interactive Ruby interpreter at the current point of execution, similar to the shell used by the breakpoint library.list: Display the code fragments surrounding the current point of execution. (We’ll make use of this command in a moment.)method/method instance: Explore the available class methods and instance methods, respectively.next/step: Continue execution one step at a time — this is a huge improvement over the breakpoint library.p/pp: Short for print and pretty print respectively, these commands can be used to evaluate Ruby expressions and display the value of variables to the console.quit: Exit the debugger. Note that this will also exit the application server if it was invoked from the command line, as demonstrated above. To just exit the current debugging session, usecont.reload: Reload the Ruby source files from disk. This can be useful if you’ve changed class definitions and want to reload them dynamically without leaving the current debugging session.
For a list of all available commands and options, use the help command.
Moving Around in the Shell
Now that we’ve been dropped into a shell, it’s time to make use of some of the commands we just discussed to get to the root of our problem (which is that our stories are ending up without descriptions).
First of all, let’s find out exactly where we are in the execution of our story submission. This is the job of the list command, as shown in Figure 5.
As you can see, the list command displays a source code listing with an arrow pointing to the line of code that is next to be executed.
At this point, we can examine parts of the working environment from the irb shell, such as the @story instance variable or the params hash. Type irb at the prompt, and let’s investigate the description attribute of the story object that’s stored in our @story variable:
(rdb) irb

irb> @story.description

=> nil
The output of inspecting this variable is shown in Figure 6.
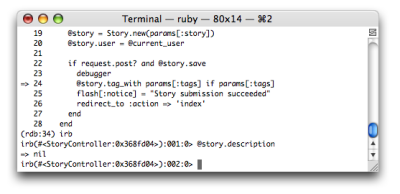
As you can see, even though we’ve entered a beautifully phrased story description into the form, the relevant description attribute of the new story object is nil, or empty.
But hang on a minute! Isn’t there a command in ruby-debug that allows us to evaluate Ruby expressions and inspect variables without going through the hassle of using irb? There sure is! Let’s exit the irb shell (using the command exit) and continue poking around from outside the shell.
Back in the native ruby-debug shell, we can use the pp (pretty print) command to display the value of our story’s description once it’s populated through the web form:
(rdb) pp params[:story][:description]

=> nil
If you type this into your ruby-debug shell, you’ll see that it also returns an empty object. So, as a last resort, let’s take a peek at the full params hash, which contains the values of all form fields that have been submitted, no matter which scope they reside in:
(rdb) pp params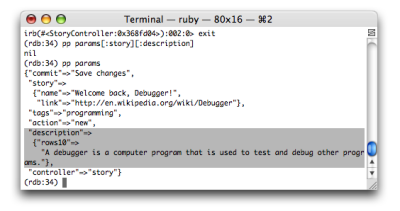
As you can see, pp actually formats the output for us to make it more readable than the output we’re used to seeing in the standard irb shell (hence the word “pretty”). While this feature is not exclusive to ruby-debug (the pp library can be loaded outside of ruby-debug as well), it’s certainly convenient that ruby-debug makes use of it automatically.
The section I’ve highlighted in Figure 7 is the root of the problem. As you can see, the description is indeed present in the params hash, but it’s not part of our story. While the story’s name and link attributes are sitting nicely together in the params[:story] hash, the description is sitting separately in params[:description].
Now, how did that happen? If we take a look at our form template (located at app/views/story/new.rhtml) it appears that I’ve “accidentally” deleted a few characters:
new.rhtml
# Wrong:

<p>

  description:<br />

  <%= text_area :description, :rows => 10 %>

</p>
new.rhtml
# Wrong:

# Right:

<p>

  description:<br />

  <%= f.text_area :description, :rows => 10 %>

</p>
Instead of going through the FormBuilder object that the form_for helper provides, my code was calling text_area without applying the scope of the form field. As a result, the description was ending up as a separate entry in the params hash, and our story was never receiving its value.
But What About All the Fancy Tools in ruby-debug?
Admittedly, we haven’t had to use any of ruby-debug’s more advanced features to debug this example problem. But when we’re forced to debug more complicated code, ruby-debug’s advanced features become really handy.
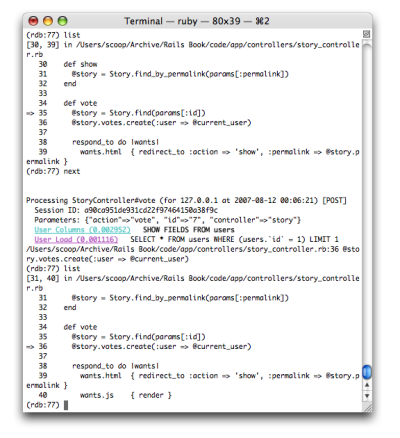
Let’s first take a look at the stepping methods. To do so we’ll need to move our debugger statement into a method that contains a little more code than the previous example (so that we can actually step through each line). The best candidate for this task is the vote action of our StoryController; here’s a version of this method to which I’ve added the debugger statement:
story_controller.rb (excerpt)
def vote

  debugger

  @story = Story.find(params[:id])

  @story.votes.create(:user => @current_user)


  respond_to do |wants|

    wants.html  { redirect_to :action => 'show', :permalink => @story.permalink }

    wants.js    { render }

  end

end
To invoke the debugger in this new location, exit your current debugging session (if you haven’t already) using the cont command. This will resurrect your stalled browser and allow you to continue browsing the shovell application. Now, select a story from the upcoming stories queue and click the Vote! button to engage the debugger once more.
Previously, we saw how the list command could be used to give us an indication of where in the source code our application was currently paused. When it’s paused, we can use the next command to advance to the next line of code. Typing next will display the regular Rails log output for the following line, then return you to the ruby-debug prompt. From here you can once again use list to check your new location in the application, as I’ve done in Figure 8.
To explore the methods provided by an object that you’re curious about, you can use the method command. The following command will produce a list of instance methods provided by the @story object, sorted alphabetically, as shown in Figure 9:
(rdb) method instance @story
The
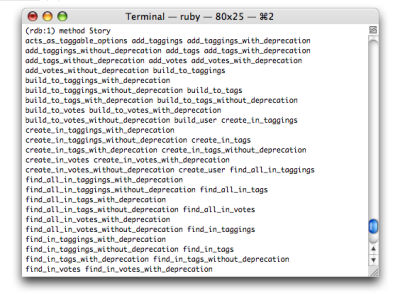
methodcommand can be used to list class methods, too. The following command will produce an alphabetically sorted list of class methods provided by theStoryclass, as shown in Figure 10.
(rdb) method Story
Manually Setting Breakpoints
While using the
nextcommand can be useful if you know exactly where in your application to go poking around, it can be less useful in a Rails application. The level at which the stepping occurs can in some circumstances be far too granular, and can result in your stepping through multiple lines of core library files instead of your own code.To gain a little more control over where the debugger halts execution, you can manually set breakpoints at the locations you desire. Breakpoints can be set by specifying either:
- a combination of filename and line number
- a class name and the name of an instance method or class method
As a practical example of setting manual breakpoints, we’re going to move the halt point from its current location (inside the vote action of StoryController) to the RJS template that’s rendered when that same action is requested to render a JavaScript response. We’ll do all of this without ever opening a text editor, or stepping over every line between the current point of execution and the code of the RJS template.
The last line of the RJS template at app/views/story/vote.rjs reads:
vote.rjs (excerpt)
page[:vote_history].replace_html :partial => 'vote',
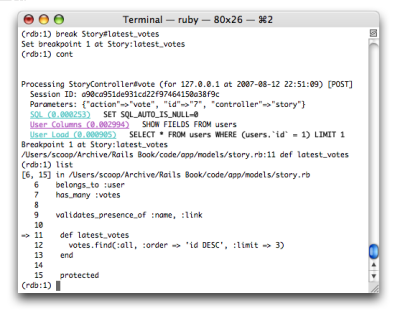
:collection => @story.latest_votesIt therefore makes sense to choose the latest_votes instance method of a Story object as our new breakpoint. To do so, execute the following command in the ruby-debug shell:
(rdb) break Story#latest_votesYou can now let go of the current breakpoint by typing the cont command in the ruby-debug shell. Execution will resume until the @story.latest_votes call is executed, at which point the application will pause again. To verify that we’re paused exactly where we expect to be, type list. Figure 11 confirms that I’ve stopped my application at the beginning of the latest_votes method.
Source-code Reloading
A Rails application, when run in development mode, automatically adopts all changes that are made to the source files without requiring you to restart the application server. ruby-debug includes a similar feature to avoid stale code passages from being displayed in the stack traces and listings output by the list command. If you can afford it (performance-wise), type the following at the ruby-debug prompt:
(rdb) set autoreloadWith this setting, ruby-debug will automatically reload your Ruby scripts from disk whenever necessary. If this appears to slow down your development progress significantly, you can instead periodically invoke the reload command whenever you think you’re getting stale representations of your code.
TextMate Integration
Those developers who develop their Rails applications on a Mac using the TextMate editor will be pleased to know that the author of ruby-debug happens to be a fan of TextMate as well. Fortunately, ruby-debug ships with some nice hooks that you can use to integrate the debugger with the editor.
First of all, you can open the file in which your application is currently paused using the tmate command. This eases the round-trips between your terminal window and your editor quite a bit.
I’d also recommend that you install the Ruby Debug Bundle for TextMate. This package gives you ultimate control over setting breakpoints from within TextMate itself.
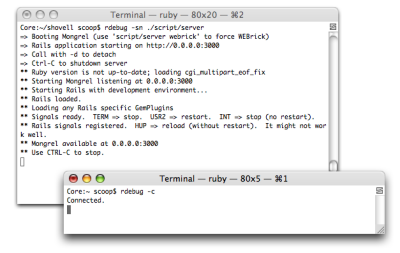
After you’ve installed the bundle, you’ll need to launch your application a little differently. Here’s how to start your application server to take advantage of ruby-debug’s remote debugging facilities (the $ indicates that we’re typing this in an operating system shell):
$ rdebug -sn ./script/serverUnlike the local debugging facility that we’ve been using thus far, you can safely minimize the terminal window in which you started your application server — we need to fire up a separate debugging client (from a new command prompt) to enable communication between TextMate and ruby-debug.
Open a new terminal window and type the following command:
$ rdebug -cYou should see the message “Connected”, as shown in Figure 12.
You’ll need to leave this window open and accessible, as this will be the window that displays the ruby-debug console output once a breakpoint is encountered.
As soon as that’s accomplished, you can use the bundle’s only keyboard shortcut, Cmd-Shift-B, to open up a menu of all the available commands, shown in Figure 13.
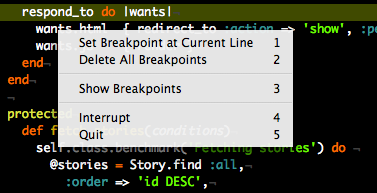
You can use this menu to set a breakpoint at the position of the cursor in the current TextMate editing window. You can also show or delete all breakpoints that have been set, or even interrupt or quit the debugging shell right from the convenience of your text editing window.
Conclusion
ruby-debug is a worthy successor to the old (and admittedly hackish) technique of debugging your Ruby application using the breakpoint library. Better yet, it’s compatible with all the most recent releases of the Ruby language interpreter. ruby-debug comes packed with many welcome shortcuts and powerful navigation commands that make debugging Ruby scripts and Rails applications a joyful and rewarding experience.
For further reading on ruby-debug and many helpful articles and links to Ruby resources, I thoroughly recommend you subscribe to Kent Sibilev’s weblog.
Frequently Asked Questions (FAQs) about Debugging Rails App with Ruby Debug
How do I install Ruby Debug for Rails application?
To install Ruby Debug for your Rails application, you need to add the gem to your Gemfile. Open your Gemfile and add the following line: gem 'debug'. After adding the gem, run bundle install in your terminal to install it. Once installed, you can use the debug commands in your Rails application.
How do I use Ruby Debug to debug my Rails application?
Ruby Debug provides several commands that you can use to debug your Rails application. You can set breakpoints in your code using the debugger command. When your application reaches a breakpoint, it will pause and allow you to inspect the current state of your application. You can also step through your code line by line using the next and step commands.
What is the difference between the next and step commands in Ruby Debug?
The next and step commands in Ruby Debug are used to step through your code. The next command moves to the next line of code, while the step command moves into the method or block of code that is currently being executed. This allows you to inspect the inner workings of your methods and blocks.
How can I view the current state of my variables in Ruby Debug?
You can view the current state of your variables in Ruby Debug using the p command followed by the name of the variable. This will print the current value of the variable to the console. You can also use the pp command to pretty print the value of the variable, which can be useful for inspecting complex data structures.
How can I continue execution after reaching a breakpoint in Ruby Debug?
After reaching a breakpoint in Ruby Debug, you can continue execution of your application using the continue command. This will resume execution until the next breakpoint is reached or the end of the program is reached.
How can I remove a breakpoint in Ruby Debug?
You can remove a breakpoint in Ruby Debug using the delete command followed by the number of the breakpoint. You can view all your current breakpoints using the breakpoints command, which will list the breakpoints along with their numbers.
Can I use Ruby Debug in the Rails console?
Yes, you can use Ruby Debug in the Rails console. To do this, you need to start the console with the --debugger option. This will allow you to use the debug commands in the console.
How can I debug a Rails application running in a server environment with Ruby Debug?
To debug a Rails application running in a server environment, you can use the remote command in Ruby Debug. This will start a remote debugging session that you can connect to from your local machine.
Can I use Ruby Debug to debug tests in Rails?
Yes, you can use Ruby Debug to debug tests in Rails. To do this, you need to add the debugger command to your test code where you want to set a breakpoint. When you run your tests, execution will pause at the breakpoint and allow you to inspect the current state of your test.
How can I debug a Rails application running in a Docker container with Ruby Debug?
To debug a Rails application running in a Docker container, you can use the remote command in Ruby Debug. This will start a remote debugging session that you can connect to from your local machine. You will also need to expose the debug port in your Dockerfile or docker-compose file.
Patrick has been developing web applications for ten years. Founder and lead developer of the freshmeat.net software portal, he and his Rails consultancy and application development company, limited overload were responsible for a major relaunch of Germany's biggest infotainment community. Patrick lives in Wiesbaden, Germany. His weblog can be found at poocs.net.


Published in
·Business·Conversion·Entrepreneur·Entrepreneurship·Entrepreneurship·Marketing·Revenue·September 17, 2015