

Key Takeaways
- The F12 Developer Tools in Internet Explorer 9 offer a range of features to aid in website development and debugging, including a Network Inspection Tab, HTML and CSS inspection, script debugging and console use, script performance improvement, and compatibility mode changes.
- The Network Inspection Tab allows developers to monitor and optimize site performance, including viewing network resources, capturing resources being loaded on the current page, and exporting data in CSV or XML format for further analysis.
- Debugging and testing CSS and HTML is simplified with the F12 Developer Tools, which allow developers to select any element and view its associated HTML and CSS, edit HTML on the fly, and change styles to test and debug the selected CSS.
- The F12 Developer Tools also offer powerful client-side script debugging capabilities, including the ability to set breakpoints, control script execution, inspect variables and the call stack, and execute statements on the fly using the console’s command line. Additionally, the Profiler tab allows for script performance testing, providing data on the time spent on custom methods and built-in scripting functions.
Can you imagine building and debugging a website’s code without the assistance of some kind of integrated development and debugging tools? For those of us who have been developing sites and web apps for more than a few years, we don’t have to imagine that—it was a reality we dealt with on a regular basis.
But times have changed. The heavy demands and responsibility placed on web developers today have necessitated the rise of developer tools in all modern browsers.
With the release of IE9 Beta and its built-in F12 Developer Tools, the IE team has advanced on its commitment to helping developers debug their front-end code quickly and improve site performance.
In this article, I’ll walk you through some of the most important features of IE9’s F12 Developer Tools, with a particular focus on what’s new and what’s most practical:
3. Script Debugging and Using the Console
4. Improving Script Performance
5. Changing the UA String and Compatibility Modes
6. Putting it Together
Network Inspection Tab
The Network tab, new to IE9, allows you to monitor and optimize site performance.
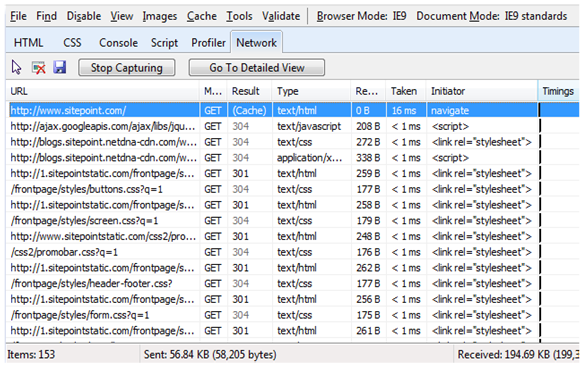
To view network resources (as shown above in SitePoint), hit F12 to open the Developer Tools (alternatively you can choose the “F12 developer tools” option from IE9’s Tools menu); then click the Network tab.
For better performance, the Network tab by default does not start capturing resources immediately. To start viewing resources being loaded on the current page, click the Start Capturing button and then refresh the page. Resources will continue to display only in the current tab, and will stop when you’ve clicked the Stop Capturing button or closed the tab.
The screenshot above shows a summary of the resources being loaded. It includes information on requested URLs, files loaded via HTML or CSS, Ajax-based requests, and resources loaded dynamically via JavaScript (for example, if an image element’s src attribute is changed).
From a summary view, any item can be double-clicked to bring up a detailed view of that particular item. The detailed view includes request headers, response headers, cookies, and timings.
Data displayed in the detailed view can be exported in CSV or XML format. This option is available by means of the Save icon, which opens up the save dialog shown below:
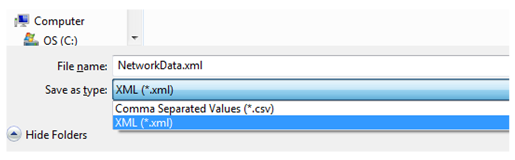
This can come in handy for sharing information with other developers or filing a bug. There’s even a third-party online tool called the HTTP Archive Rule Runner, which will accept XML-based data and run some YSlow tests against the inputted data for analysis.
To test the new Network tab in IE9 Beta, you can visit the Network Monitoring Demo on the IE9 Test Drive site, or read more about the Network tab feature on the MSDN IEBlog.
Inspecting HTML and CSS
DOM elements and styles are also easy to find by opening the F12 Developer Tools and clicking the Select element by click icon.
This option (which is also available in the Find menu, or by pressing Ctrl-B) gives you the ability to select any element and bring up its associated HTML and CSS. Here’s an example showing the SitePoint logo with the equivalent HTML code on display within the tree-node structure:
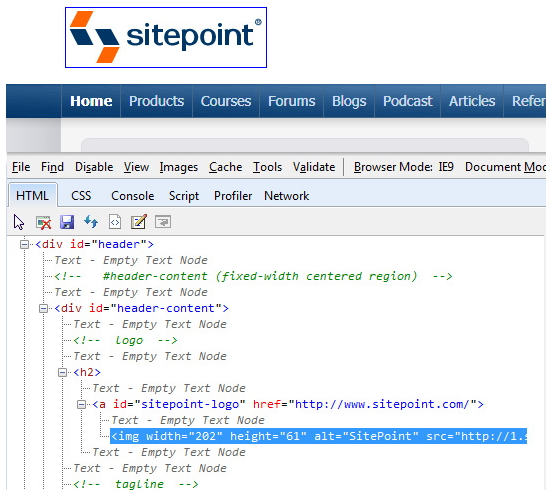
Once the Select element by click option is chosen, any item on the web page that you hover over will get a blue border (as seen on the SitePoint logo above). This allows you to specifically choose which area of the page you want to examine.
The DOM pane allows you to edit the HTML on the fly and see the changes in the window immediately. To do this, just click the Edit icon and edit the HTML as you would in a regular text editor. When you’re finished editing, depress the Edit button and the changes will be visible in the viewport.
Next to the DOM tree, you’ll see all the CSS styles associated with the selected element, as shown below:
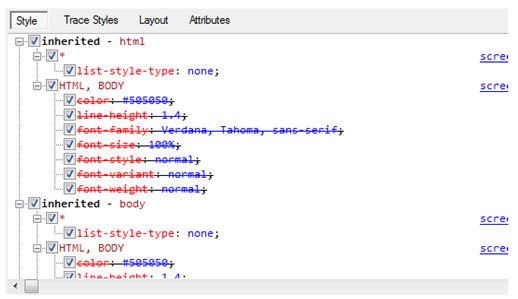
IE9’s F12 Developer Tools let you change the styles on the fly to test and debug the selected CSS.
The styles listed for the selected element are shown in the Properties Pane (the right side of the Developer Tools) in cascading order and according to specificity; hence, the styles that appear at the bottom are the ones that appear later in the cascade, or have more specificity. Overridden styles appear with a line through them, so this can be taken into consideration when trying to debug a CSS problem.
You can alternatively select the Trace Styles option, which will display the applied properties in alphabetical order without selectors present.
Further information about the selected element is available using the Layout and Attributes options. For a more extensive discussion of these features, see Debugging HTML and CSS with the Developer Tools on MSDN.
Back in the Primary Pane (the left side of the tools), you can switch from the HTML tab to the CSS tab. The CSS tab lists all the properties and values found in the selected style sheet, and they’re fully editable, with changes taking effect immediately. The CSS tab also has a style sheet selector that lets you switch between style sheets. This can come in handy on large sites that use multiple CSS files.
Script Debugging and Using the Console
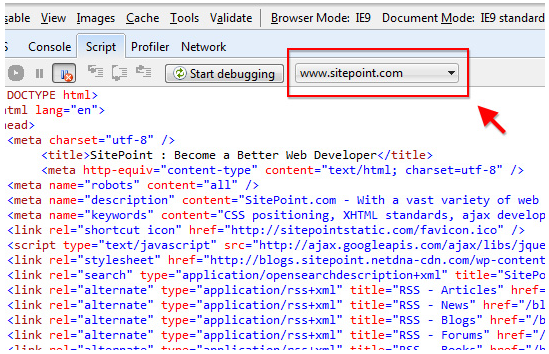
As is expected with any good developer tools, IE9 provides powerful client-side script debugging capabilities that help developers solve issues that might come up when dealing with complex code. To begin debugging scripts on your page, open the F12 Developer Tools and choose the Script tab.
From here, a number of options are available. A drop-down list allows you to select a particular script to work with, as indicated in the screenshot below:
Click the Start debugging button to debug a chosen script. This will unpin the F12 Developer Tools from the browser window, and the script’s contents will appear, along with the Console on the right side, as shown below:
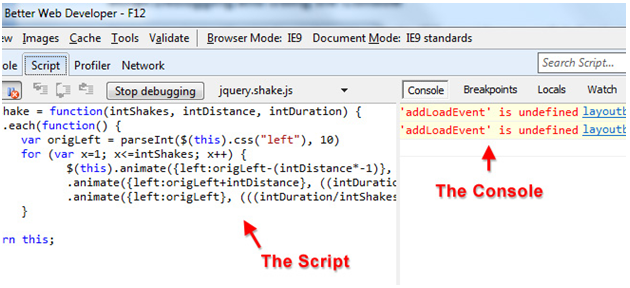
Any script errors present in the page (as in the example above) will automatically display in the Console.
During the debugging process, you can set breakpoints (with optional conditions), control execution of the script, or inspect variables and the call stack.
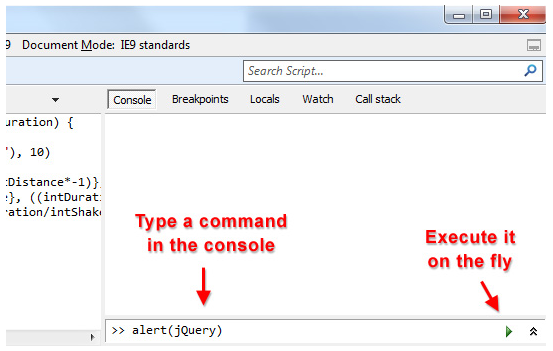
When the Console option is selected, you can execute statements on the fly by typing them into the console’s command line. The Console feature is new in IE9’s F12 Developer Tools, and provides a number of invaluable features to developers.
Any valid line of code can be run inside a paused script (by hitting enter or clicking the Run script button next to the Console’s command line), as shown below:
If necessary, you can change the Console’s command line to multiline, which will allow you to insert more complex commands and scripts for debugging purposes. Naturally, in multiline mode, hitting Enter on your keyboard will not execute the script; instead, it will move the cursor to a new line. To execute the typed code in this mode, you would click the Run script icon.
The command line in the Console also lets you log errors and other information to assist in debugging your scripts.
Improving Script Performance
Debugging your scripts is just one aspect of the development cycle. In addition to the debugging features already discussed, the F12 Developer Tools allow scripts to be tested for performance using the Profiler tab.
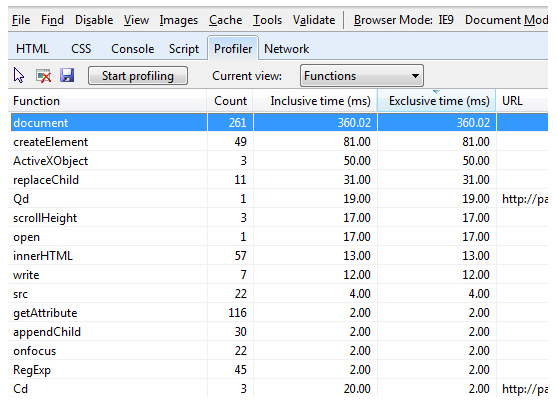
The script profiler feature gives data on the amount of time your scripts spend on custom methods and built-in scripting functions. A button in the Profiler tab lets you start and stop the profiling process, so you can control the data that’s collected.
The screenshot below shows partial results from profile execution on SitePoint’s home page:
The data can be viewed either in Function view or Call tree view, and the resulting data can be sorted and rearranged by clicking column headings or removing headings.
Each time you start and stop the profiler, a different profiling session is recorded. All your profiling sessions are available in a Reports drop-down list and are searchable, as shown in the image below:
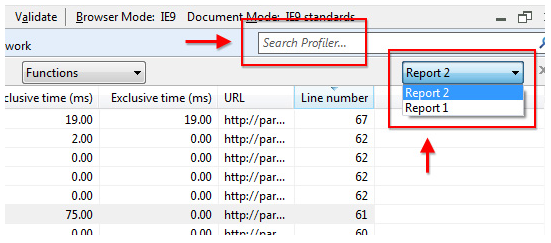
The search functionality adds yellow highlighting to your search terms found in the selected report, making it easy to scan for the search results within the context of the report. It also gives you the ability to jump to the next search result using the previous and next buttons. This can come in handy when trying to track down specific method names inside a lengthy report.
Finally, any profile data you capture can be easily exported in CSV format by clicking the Export data icon. This will bring up a save dialog, through which you can store your data locally.
This is just a sampling of the script-enhancing and debugging capabilities available to developers using IE9 and its integrated F12 Developer Tools. With the web app boom in full swing, website performance has never been more important; IE’s tools have made great strides to assist developers in this crucial area of development.
For further information on these and other script-enhancing features, you can check out Discovering Internet Explorer Developer Tools and Profiling Script with the Developer Tools on MSDN.
Changing the UA String and Compatibility Modes
A feature newly added to IE9’s F12 Developer Tools is the ability to change the User Agent (UA) string that’s read by the web server through request headers. Although this won’t make IE9 mimic the rendering of a different browser, it can allow you to run functionality and content that’s targeted to other web browsers (for example, a warning message or other notification for a user with an older browser or browser version).
Different rendering modes for previous versions of Internet Explorer, however, are available using the improved Browser Mode and Document Mode options. Those options are available at any time the F12 Developer Tools are open, as shown below:
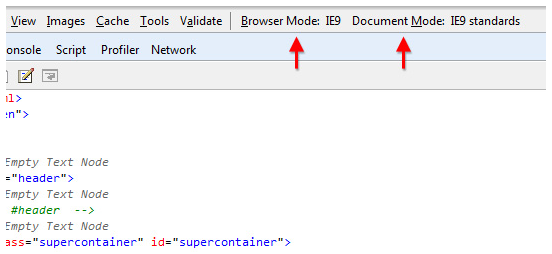
Each mode produces a drop-down list of options to change the way the page is rendered. Although these options don’t mimic the original rendering environments exactly, they do provide a fairly accurate and easy-to-use method of testing in different modes:
- Browser Mode—IE7, IE8, IE9, and IE9 in IE7 Compatibility View
- Document Mode—Quirks Mode, IE7 Standards, IE8 Standards, and IE9 Standards
Doing rapid testing for various versions and modes of Internet Explorer has never been easier, with developers standing to directly benefit. For more information on IE Browser and Document Modes, check out these blogs :
These days, sites and web apps are being built with complex scripting. They require more focus on performance and demand faster debugging tools. In this light, IE9’s F12 Developer Tools are much improved. As we near the launch of IE9 in 2011 (the Platform Preview is now in version 7), and as IE9’s market share increases, these and other tools that integrate support for web standards and optimized code will become invaluable to web developers.
Give IE9’s new F12 Developer Tools a test drive to discover whether the new and improved features can help your development for the modern browser. The full “how-to” can be found on MSDN Developer Tools.
Why not take our short quiz for a spin and see how much you picked up from this article.
This tutorial has been made possible by the support of Microsoft. In cooperation with Microsoft and independently written by SitePoint, we strive to work together to develop the content that’s most useful and relevant to you—our readers.
Frequently Asked Questions about F12 Developer Tools in Internet Explorer 9
How can I access the F12 Developer Tools in Internet Explorer 9?
To access the F12 Developer Tools in Internet Explorer 9, you simply need to press the F12 key on your keyboard. Alternatively, you can also access it by clicking on the gear icon located at the top right corner of the browser, then select “F12 Developer Tools” from the drop-down menu. This will open the developer tools panel at the bottom of your browser window.
What is the purpose of the Console tab in F12 Developer Tools?
The Console tab in F12 Developer Tools is a powerful feature that allows you to interact with the webpage using JavaScript. It logs diagnostic information in the development process and allows you to write, manage, and monitor JavaScript on demand. It’s a great tool for debugging and testing your code.
How can I use the Network tab in F12 Developer Tools?
The Network tab in F12 Developer Tools provides detailed information about each network request made by your webpage or application. It allows you to inspect the headers, preview the responses, and measure the performance. To use it, simply select the Network tab and click the “Start capturing” button to begin recording network activity.
What is the use of the Debugger tab in F12 Developer Tools?
The Debugger tab in F12 Developer Tools allows you to debug your JavaScript code within the browser. It provides features like breakpoints, watch expressions, and a call stack view, which can help you find and fix issues in your code more efficiently.
How can I inspect elements on a webpage using F12 Developer Tools?
To inspect elements on a webpage, select the DOM Explorer tab in F12 Developer Tools. Then, use the select element tool (the cursor icon) to pick an element on the webpage. The selected element’s HTML will be highlighted in the DOM Explorer, and you can view or modify its CSS properties in the Styles pane.
What is the Profiler tab in F12 Developer Tools used for?
The Profiler tab in F12 Developer Tools is used for analyzing the runtime performance of your webpage or application. It helps you identify functions that could be optimized for better performance by recording and analyzing the time taken by each function during the execution of your code.
How can I use the Emulation tab in F12 Developer Tools?
The Emulation tab in F12 Developer Tools allows you to simulate different screen sizes, resolutions, and orientations, which can be useful for testing responsive designs. You can also emulate different user agent strings to test how your webpage behaves in different browsers.
Can I modify the HTML and CSS of a webpage in real-time using F12 Developer Tools?
Yes, you can modify the HTML and CSS of a webpage in real-time using the DOM Explorer in F12 Developer Tools. This is a great way to test changes without having to edit and reload your code.
What is the purpose of the Performance tab in F12 Developer Tools?
The Performance tab in F12 Developer Tools provides a visual timeline of your webpage’s or application’s load performance. It helps you identify bottlenecks and optimize your code for better performance.
Can I debug JavaScript in Internet Explorer 9 using F12 Developer Tools?
Yes, you can debug JavaScript in Internet Explorer 9 using the Debugger tab in F12 Developer Tools. It provides a full set of debugging tools, including breakpoints, watch expressions, and a call stack view.