

An expense manager is a financial budget application that’s used to collect and analyze expenses. They help people budget and save money by monitoring income and how an individual, business or family is spending their money.
Expense manager apps vary and can come with a range of features. In this tutorial I will show how to create a simple expense manager app using Cordova. I will use jQuery Mobile for UI and Chart.js to create display charts to provide insights into income and spending.
The aim of this tutorial is to show you how to organize and store the data of an expense manager app (or any similar app) and create the basic features every more complex app should have.
Key Takeaways
- Utilize Apache Cordova alongside jQuery Mobile and Chart.js to develop a simple, cross-platform expense manager app that tracks and analyzes financial data.
- Implement HTML5 local storage to manage and store app data in JSON format, ensuring data persistence across sessions.
- Design a user-friendly interface with multiple pages for updating budgets, adding transactions, listing transactions, and displaying spending trends via graphical charts.
- Leverage Cordova plugins like Notification and Device to enhance app functionality, such as updating budgets and adding transactions with real-time notifications.
- Explore the extension of app capabilities by integrating third-party APIs, adding budgeting tools, and implementing monetization strategies to create a comprehensive financial management tool.
Starting
In the starting template I need to include jQuery, jQuery mobile and Chart.js. I won’t cover installing and creating a Cordova Application here, if you haven’t done this before, read the getting started guide. Instructions to run and build the application are available on the same page.
Give the Application an appropriate name and add the platforms you want to support. I am using Cordova’s Notification plugin and Device plugin in this tutorial, to add these find instructions here.
You can find the final code of this project on gitHub.
Note : Every time we change the code of the project you will need to rebuild it before rerunning the emulator.
Inside the www/index.html file, add the following JavaScript and CSS files in the head tag:
<style>

        @-ms-viewport { width: 100vw ; zoom: 100% ; }

        @viewport { width: 100vw ; zoom: 100% ; }

        @-ms-viewport { user-zoom: fixed ; }

        @viewport { user-zoom: fixed ; }

    </style>
    <link rel="stylesheet" href="https://code.jquery.com/mobile/1.4.5/jquery.mobile-1.4.5.min.css">
    <script src="https://code.jquery.com/jquery-2.1.4.min.js"></script>

    <script src="https://code.jquery.com/mobile/1.4.5/jquery.mobile-1.4.5.min.js"></script>
    <script src="https://cdn.rawgit.com/nnnick/Chart.js/master/Chart.js"></script>
Here I added jQuery, jQuery Mobile and Chart.js from CDNs. You can embed these files locally so that the app works without an Internet connection.
Data Structure
In this tutorial I am going to use HTML5 local storage to store the app’s data.
I will be organizing all the data into an array that will be a property of an object. The object is stored as a JSON string in the local storage.
Here is an overview of how our data will look:
{

    data: [

            [

                ["06-2015", "Total Spendings", "Total Available Budget"],

                [

                    ["item1", "cost"] , ["item2", "cost"]

                ]

            ],

            [

                ["07-2015", "Total Spendings", "Total Available Budget"],

                [

                    ["item1", "cost"] , ["item2", "cost"]

                ]

            ],

            [],

            []

        ];

}
Each element of the data array represents information about a particular month. Every month element is also an array with a date, total spending, the available budget and cost of purchased items. New months are added to the end of the data array.
When the app loads for the first time, local storage will be empty, so the data structure needs to be initiated. Here the code checks for the object in the local storage. As it’s empty it will create and store a new one. Place this code in a script tag at the bottom of the index.html page, before the closing body tag:
var info = null;
document.addEventListener("deviceready", function(){

    if(!localStorage.getItem("em_data"))

    {

        var date = new Date();

        var today = date.getMonth() + "-" + date.getFullYear();
        var em_data = {data: [[[today, 0, 0], []]]};

        localStorage.setItem("em_data", JSON.stringify(em_data));

    }
    info = JSON.parse(localStorage.getItem("em_data"));

}, false);
Here I am adding the current month to the array. I created an info variable used throughout the app to access data. Whenever I make changes to the info variable I need to update local storage.
Creating the Home Screen
Let’s create a home screen for our app which will display first when the app loads.
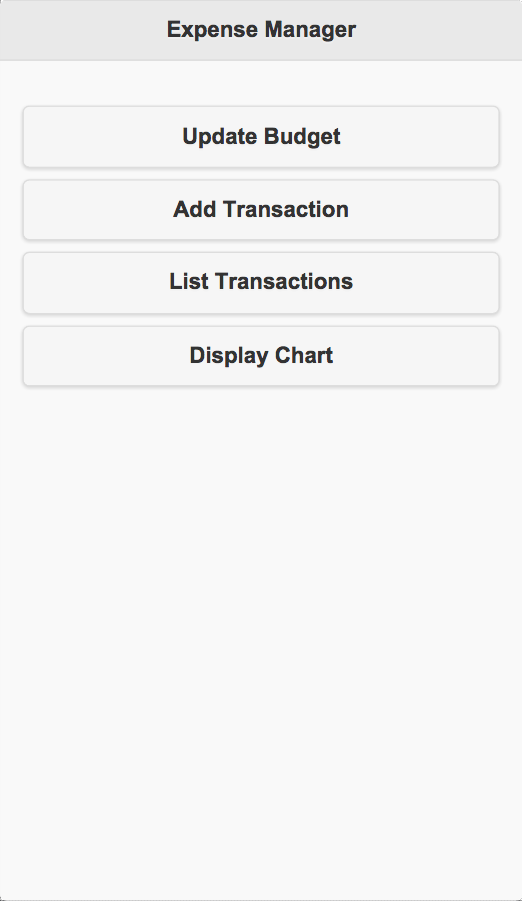
In the home screen of our app I will place four buttons. These are for updating this month’s budget, adding new purchased item, listing all purchased items and showing a graph to analyze six months of spending.
Here is the code to create a jQuery mobile page for our home screen. Place this code in the body tag of the index.html page (You can probably replace the divs that are there):
<div data-role="page" id="home">

  <div data-role="header">

    <h1>Expense Manager</h1>

  </div>
  <div data-role="main" class="ui-content">

    <p>

        <a target="_blank" href="#update_budget" style="text-decoration: none"><button>Update Budget</button></a>

        <a target="_blank" href="#add_transaction" style="text-decoration: none"><button>Add Transaction</button></a>

        <a target="_blank" href="#list_transactions" style="text-decoration: none"><button>List Transactions</button></a>

        <a target="_blank" href="#chart" style="text-decoration: none"><button>Display Chart</button></a>

    </p>

  </div>

</div>
Here I placed four buttons on the page, each of them pointing to a new page. Here is how the page looks:
Note: Code for all the other pages should be added below this, so that this page loads first.
Creating a Page to Update the Budget
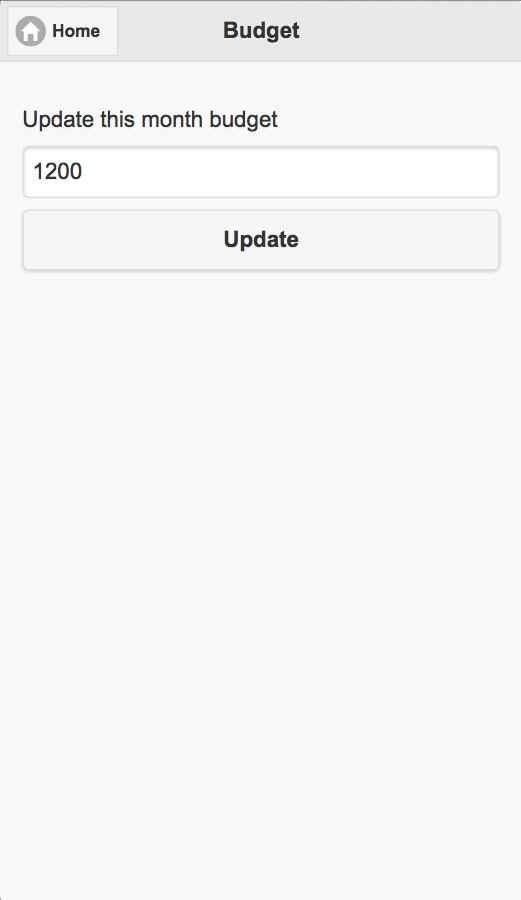
When a user clicks on the Update Budget button a new page is displayed where a user can update the total available spending budget for the month.
Next, display a textbox and a button to update the budget. Place the code in the body tag of the index.html file:
<div data-role="page" id="update_budget">

  <div data-role="header">

    <a target="_blank" href="#home" class="ui-btn ui-icon-home ui-btn-icon-left">Home</a>

    <h1>Budget</h1>

  </div>
  <div data-role="main" class="ui-content">

    <p>

        Update this month budget

        <input type="text" id="month_budget" />

        <a target="_blank" href="javascript:update_budget()" style="text-decoration: none"><button>Update</button></a>

    </p>

  </div>

</div>
The text box should by default display the budget of the current month. So add an event listener to update the budget before the page loads.
To update the value of the textbox every time before the page loads, place this code in the script tag of index.html file:
function update_month()

{

    var date = new Date();

    var today = date.getMonth() + "-" + date.getFullYear();

    if(info.data[info.data.length - 1][0][0] != today)

    {

        info.data[info.data.length] = [];

        info.data[info.data.length - 1][0] = [];

        info.data[info.data.length - 1][1] = [];

        info.data[info.data.length - 1][0][0] = today;

        info.data[info.data.length - 1][0][1] = 0;

        info.data[info.data.length - 1][0][2] = 0;
        localStorage.setItem("em_data", JSON.stringify(info));

    }

}
$(document).on("pagebeforecreate","#update_budget",function(){

    update_month();

    document.getElementById("month_budget").value = info.data[info.data.length - 1][0][2];

});
Before updating the textbox value invoke the update_month function to check if the current month is available in the data array. Otherwise it creates a new array element representing the current month.
The update_budget function is invoked when Update Budget is clicked. Place this code in the script tag of the index.html page:
function update_budget()

{

    info.data[info.data.length - 1][0][2] = document.getElementById("month_budget").value;

    localStorage.setItem("em_data", JSON.stringify(info));
    navigator.notification.alert("This month budget is updated", null, "Budget Edit Status", "Ok");

}
Here is how the page looks:
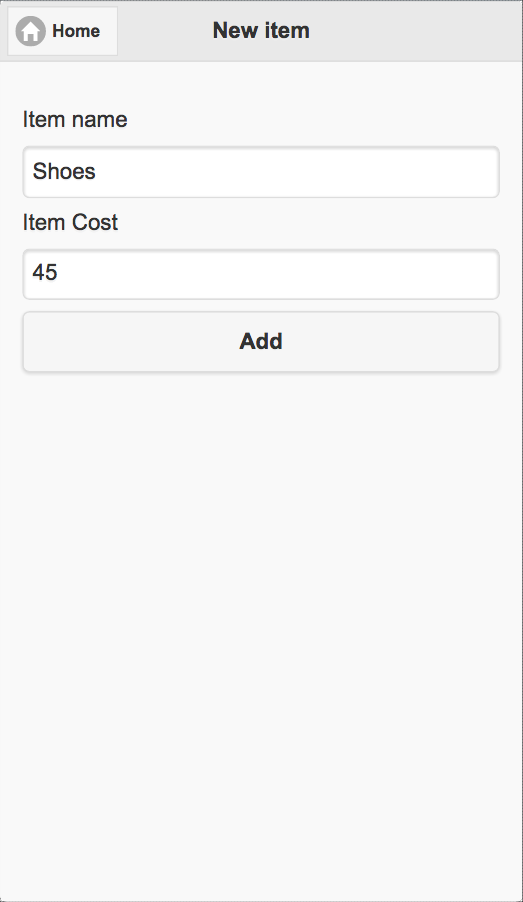
Creating a Page to Add Items Purchased
When a user clicks the Add Transaction button, a new page is displayed where they can add details of newly purchased items such as name and cost. Place this code in the body tag of the index.html file that displays two textboxes and a button to add a new item:
<div data-role="page" id="add_transaction">

  <div data-role="header">

    <a target="_blank" href="#home" class="ui-btn ui-icon-home ui-btn-icon-left">Home</a>

    <h1>New item</h1>

  </div>
  <div data-role="main" class="ui-content">

    <p>

        Item name

        <input type="text" id="item_name" />

        Item Cost

        <input type="text" id="item_cost" />

        <a target="_blank" href="javascript:add_item()" style="text-decoration: none"><button>Add</button></a>

    </p>

  </div>

</div>
Before the page loads check if the current month is present in the data array and if not, create a new element in the data array representing the current month. Place this code in the script tag of the index.html page to invoke the update_month function before the page loads:
$(document).on("pagebeforecreate","#add_transaction",function(){

    update_month();

});
Finally comes the add_item function, invoked when user clicks the Add button on the page. Here is the code for the add_item function. Place this code in the script tag of the index.html page:
function add_item()

{

    var item = [document.getElementById("item_name").value, document.getElementById("item_cost").value];

    info.data[info.data.length - 1][1][info.data[info.data.length - 1][1].length] = item;

    info.data[info.data.length - 1][0][1] = info.data[info.data.length - 1][0][1] + parseInt(document.getElementById("item_cost").value);

    localStorage.setItem("em_data", JSON.stringify(info));
    navigator.notification.alert("New item has been added to this month transactions", null, "Transaction", "Ok")

}
Here is how the page looks:
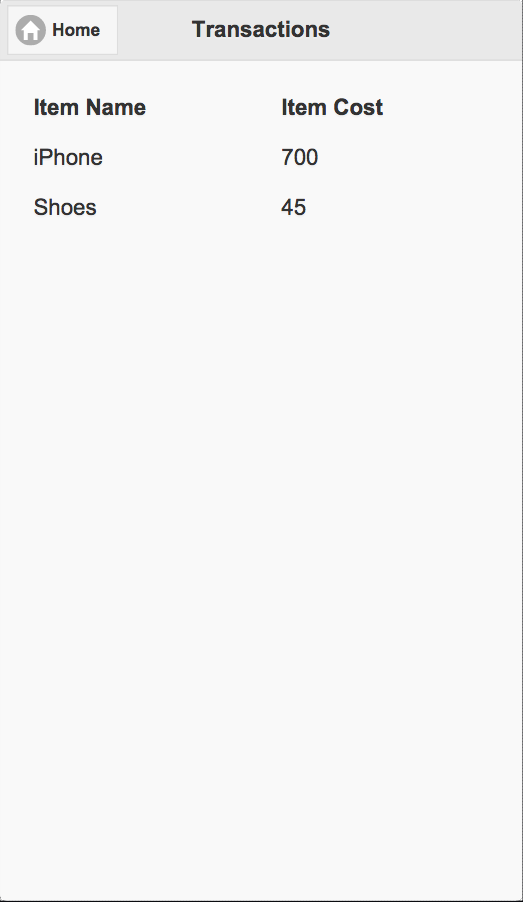
Creating a Page to display Purchased Items
When a user clicks on the List Transactions button, a new page is displayed where they can see a list of items (and their price) purchased during the current month.
Display a jQuery table listing the purchased items. Place this code in the body tag of the index.html file:
<div data-role="page" id="list_transactions">

  <div data-role="header">

    <a target="_blank" href="#home" class="ui-btn ui-icon-home ui-btn-icon-left">Home</a>

    <h1>Transactions</h1>

  </div>
  <div data-role="main" class="ui-content" id="listTable"></div>

</div>
Before the page loads retrieve the list of currently purchased items, generate the jQuery table HTML code and insert it into the page. Place this code in the script tag of the index.html page:
$(document).on("pagebeforecreate","#list_transactions",function(){
    update_month();
    var html = '<table id="table" data-role="table" data-mode="column" class="ui-responsive"><thead><tr><th>Item Name</th><th>Item Cost</th></tr></thead><tbody>';
    for(var count = 0; count < info.data[info.data.length - 1][1].length; count++)

    {

        html = html + "<tr><td>" + info.data[info.data.length - 1][1][count][0] + "</td><td>" + info.data[info.data.length - 1][1][count][1] + "</td></tr>";
    }
    html = html + "</tbody></table>";
    document.getElementById("listTable").innerHTML = html;

});
Here is how the page looks:
Creating a Page to display Chart
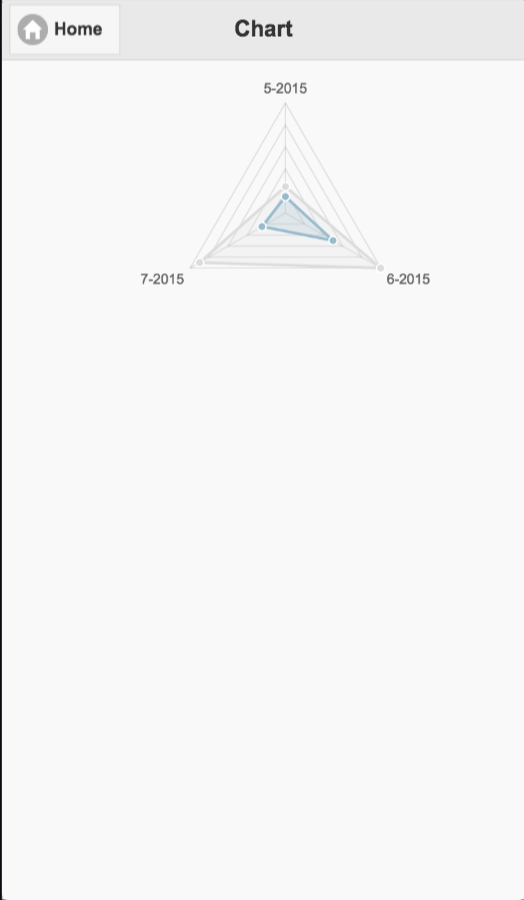
When a user clicks on the Display Chart button, a new page is displayed showing a Radar chart of the spending and budget of the last 6 months.
Here is the code for the page that displays the chart. Place this code in the body tag of the index.html file:
<div data-role="page" id="chart">

  <div data-role="header">

    <a target="_blank" href="#home" class="ui-btn ui-icon-home ui-btn-icon-left">Home</a>

    <h1>Chart</h1>

  </div>
  <div data-role="main" class="ui-content">

      <canvas id="monthly_canvas" style="height: 100%; width: 100%"></canvas>

  </div>

</div>
A in the page acts as a placeholder for the chart. Initiate chart.js and provide data to the library to render the chart on the canvas. Place this code in the script tag of the index.html page:
$(document).on("pagebeforecreate","#chart",function(){

    var start = 0;

    var end = 0;
    if(info.data.length <= 6)

    {

        start = 0;

        end = info.data.length - 1;

    }

    else

    {

        start = info.data.length - 6;

        end = info.data.length - 1;

    }
    var labels = [];
    for(var iii = start; iii <= end; iii++)

    {

        labels[labels.length] = info.data[iii][0][0];

    }
    var monthly_budget = [];
    for(var iii = start; iii <= end; iii++)

    {

        monthly_budget[monthly_budget.length] = info.data[iii][0][2];

    }
    var monthly_spent = [];
    for(var iii = start; iii <= end; iii++)

    {

        monthly_spent[monthly_spent.length] = info.data[iii][0][1];

    }
    setTimeout(function(){
        var lineChartData = {

            labels : labels,

            datasets : [

                {

                    label: "Monthy Budget",

                    fillColor : "rgba(220,220,220,0.2)",

                    strokeColor : "rgba(220,220,220,1)",

                    pointColor : "rgba(220,220,220,1)",

                    pointStrokeColor : "#fff",

                    pointHighlightFill : "#fff",

                    pointHighlightStroke : "rgba(220,220,220,1)",

                    data : monthly_budget

                },

                {

                    label: "Monthly Spendings",

                    fillColor : "rgba(151,187,205,0.2)",

                    strokeColor : "rgba(151,187,205,1)",

                    pointColor : "rgba(151,187,205,1)",

                    pointStrokeColor : "#fff",

                    pointHighlightFill : "#fff",

                    pointHighlightStroke : "rgba(151,187,205,1)",

                    data : monthly_spent

                }

            ]
        }
        var ctx = document.getElementById("monthly_canvas").getContext("2d");

        window.myLine = new Chart(ctx).Radar(lineChartData, {

            responsive: true

        });

    }, 500);

});
The code above retrieves the dates and spending information for the last 6 months and chart.js is initiated asynchronously using setTimeout. I initiated chart.js after 500ms to allow time for the page to render, otherwise the canvas will fail to render graphics.
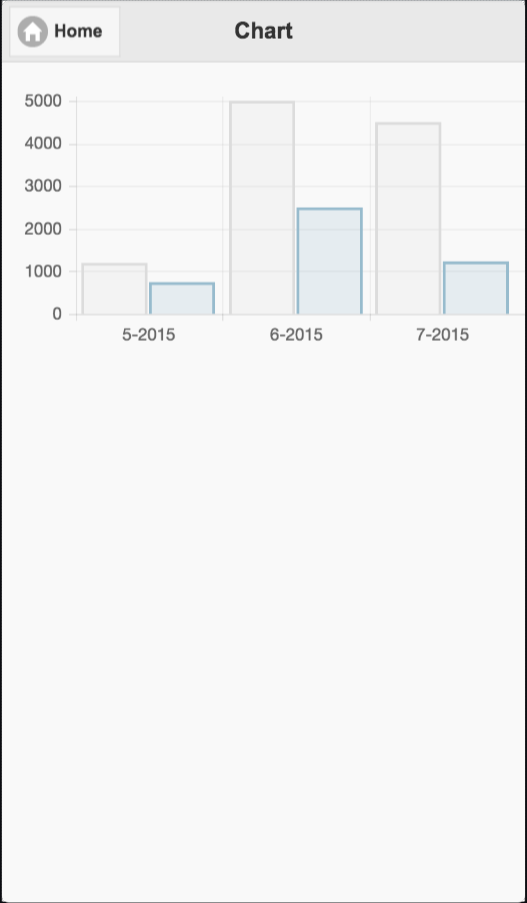
You can display different kinds of charts by calling the respective methods of the chart object. Here I displayed a radar chart, so the Radar method of the chart object is invoked. To display a bar chart, call the Bar method with the same arguments.
Learn more about chart.js here on SitePoint.
Here is the Bar and Radar charts with 3 months of transactions:
Final Thoughts
Currently the app is functional, but basic and can be deployed to multiple platforms. The next steps are providing intelligent advice on how to reduce spending, or adding notifications. Let me know your experiences trying this tutorial and ideas for expanding it.
Frequently Asked Questions about Creating an Expense Manager App with Apache Cordova
How does Apache Cordova compare to other platforms for creating expense manager apps?
Apache Cordova is a mobile development framework that allows for the development of mobile apps using HTML, CSS, and JavaScript. This is a significant advantage over other platforms that require knowledge of specific programming languages like Java for Android or Swift for iOS. With Cordova, you can create a single app that works on multiple platforms, which saves time and resources. However, it’s worth noting that native apps may offer better performance and a more seamless user experience.
Can I integrate third-party APIs with my Apache Cordova expense manager app?
Yes, Apache Cordova allows for the integration of third-party APIs. This means you can incorporate features like linking to bank accounts or credit cards, similar to what some of the top expense manager apps offer. This can greatly enhance the functionality of your app and provide a more comprehensive expense tracking solution for your users.
How secure is an expense manager app created with Apache Cordova?
Security is a crucial aspect of any app, especially one that handles sensitive financial information. Apache Cordova provides a secure platform for app development. However, the security of your app also depends on how you handle data storage and transmission. It’s recommended to use secure and encrypted methods for storing and transmitting data to ensure the privacy and security of your users’ information.
Can I add budgeting features to my Apache Cordova expense manager app?
Absolutely. With Apache Cordova, you can add a variety of features to your app, including budgeting tools. This can help users set spending limits, track their progress, and get alerts when they’re nearing or exceeding their budget. This feature is common in many top-rated expense manager apps and can add significant value to your app.
How customizable is an expense manager app created with Apache Cordova?
Apache Cordova offers a high level of customization. You can design your app’s user interface to match your brand, add features that cater to your target audience’s needs, and even integrate with other services or platforms. This flexibility allows you to create an app that stands out from the competition and meets your users’ specific needs.
Can I monetize my Apache Cordova expense manager app?
Yes, there are several ways to monetize your app. You can offer in-app purchases for premium features, run ads, or offer a subscription model for continued access to the app. It’s important to consider your target audience and what monetization strategies they’re likely to respond to when deciding on the best approach.
How user-friendly is an expense manager app created with Apache Cordova?
The user-friendliness of your app largely depends on your design and development choices. Apache Cordova allows for the creation of intuitive and easy-to-use apps, but it’s up to you to ensure your app’s user interface is clean, simple, and easy to navigate. User experience should be a top priority to ensure your app’s success.
Can I create an expense manager app with Apache Cordova if I don’t have a background in programming?
While Apache Cordova does simplify the app development process by allowing you to use HTML, CSS, and JavaScript, some knowledge of these languages is still required. However, there are many resources available online to help you learn these languages and get started with Apache Cordova.
How can I ensure my Apache Cordova expense manager app is reliable and performs well?
Performance and reliability are key to the success of your app. Apache Cordova provides a solid foundation, but it’s also important to regularly test your app on different devices and platforms to identify and fix any issues. Additionally, you should optimize your code for performance and consider using a CDN to ensure fast and reliable delivery of your app’s content.
How can I get feedback and improve my Apache Cordova expense manager app?
User feedback is invaluable for improving your app. You can encourage users to leave reviews on the app store, conduct user surveys, or even use in-app analytics to understand how users are interacting with your app. This information can guide your updates and improvements to ensure your app continues to meet the needs of your users.