


Software development is complex and, at some point, your Node.js application will fail. If you’re lucky, your code will crash with an obvious error message. If you’re unlucky, your application will carry on regardless but not generate the results you expect. If you’re really unlucky, everything will work fine until the first user discovers a catastrophic disk-wiping bug.
Key Takeaways
- Leverage advanced Node.js debugging tools like the V8 Inspector and VS Code’s integrated debugger to step through code, inspect variables, and manage breakpoints efficiently.
- Utilize environment variables and command-line options such as `NODE_ENV=development` and `–inspect` to activate detailed debugging features and improve visibility into application behavior.
- Implement logging strategically with Node.js’s `util.debuglog` or third-party modules like Winston to capture detailed, level-specific application logs for thorough analysis.
- Adopt test-driven development (TDD) and utilize code linting tools like ESLint to identify and mitigate bugs early in the development cycle, enhancing code quality and reliability.
- Employ Chrome DevTools for Node.js applications by using the `–inspect` flag to debug in a familiar browser environment, allowing for effective inspection of call stacks, variable states, and control flow.
What is Debugging?
Debugging is the black art of fixing software defects. Fixing a bug is often easy — a corrected character or additional line of code solves the problem. Finding that bug is another matter, and developers can spend many unhappy hours trying to locate the source of an issue. Fortunately, Node.js has some great tools to help trace errors.
Terminology
Debugging has its own selection of obscure jargon, including the following:
| Term | Explanation |
|---|---|
| breakpoint | the point at which a debugger stops a program so its state can be inspected |
| debugger | a tool which offers debugging facilities such as running code line by line to inspect internal variable states |
| feature | as in the claim: “it’s not a bug, it’s a feature”. All developers say it at some point during their career |
| frequency | how often or under what conditions a bug will occur |
| it doesn’t work | the most-often made but least useful bug report |
| log point | an instruction to a debugger to show the value of a variable at a point during execution |
| logging | output of runtime information to the console or a file |
| logic error | the program works but doesn’t act as intended |
| priority | where a bug is allocated on a list of planned updates |
| race condition | hard-to-trace bugs dependent the sequence or timing of uncontrollable events |
| refactoring | rewriting code to help readability and maintenance |
| regression | re-emergence of a previously fixed bug perhaps owing to other updates |
| related | a bug which is similar or related to another |
| reproduce | the steps required to cause the error |
| RTFM error | user incompetence disguised as a bug report, typically followed by a response to “Read The Flipping Manual” |
| step into | when running code line by line in a debugger, step into the function being called |
| step out | when running line by line, complete execution of the current function and return to the calling code |
| step over | when running line by line, complete execution of a command without stepping into a function it calls |
| severity | the impact of a bug on system. For example, data loss would normally be considered more problematic than a UI issue unless the frequency of occurrence is very low |
| stack trace | the historical list of all functions called before the error occurred |
| syntax error | typographical errors, such as console.lug() |
| user error | an error caused by a user rather than the application, but may still incur an update depending on that person’s seniority |
| watch | a variable to examine during debugger execution |
| watchpoint | similar to a breakpoint, except the program is stopped when a variable is set to a specific value |
How to Avoid Bugs
Bugs can often be prevented before you test your application …
Use a Good Code Editor
A good code editor will offer numerous features including line numbering, auto-completion, color-coding, bracket matching, formatting, auto-indentation, variable renaming, snippet reuse, object inspection, function navigation, parameter prompts, refactoring, unreachable code detection, suggestions, type checking, and more.
Node.js devs are spoiled for choice with free editors such as VS Code, Atom, and Brackets, as well as plenty of commercial alternatives.
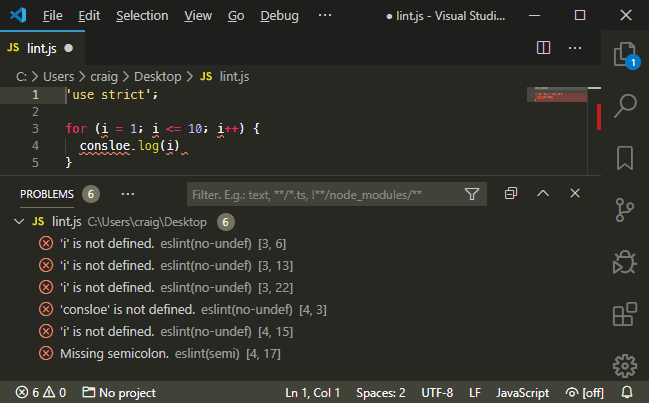
Use a Code Linter
A linter can report code faults such as syntax errors, poor indentation, undeclared variables, and mismatching brackets before you save and test your code. The popular options for JavaScript and Node.js include ESLint, JSLint, and JSHint.
These are often installed as global Node.js modules so you can run checks from the command line:
eslint myfile.js
However, most linters have code editor plugins, such as ESLint for VS Code and linter-eslint for Atom which check your code as you type:
Use Source Control
A source control system such as Git can help safe-guard your code and manage revisions. It becomes easier to discover where and when a bug was introduced and who should receive the blame! Online repositories such as GitHub and Bitbucket offer free space and management tools.
Adopt an Issue-tracking System
Does a bug exist if no one knows about it? An issue-tracking system is used to report bugs, find duplicates, document reproduction steps, determine severity, calculate priorities, assign developers, record discussions, and track progress of any fixes.
Online source repositories often offer basic issue tracking, but dedicated solutions may be appropriate for larger teams and projects.
Use Test-driven Development
Test-driven Development (TDD) is a development process which encourages developers to write code which tests the operation of a function before it’s written — for example, is X returned when function Y is passed input Z.
Tests can be run as the code is developed to prove a function works and spot any issues as further changes are made. That said, your tests could have bugs too …
Step Away
It’s tempting to stay up all night in a futile attempt to locate the source of a nasty bug. Don’t. Step away and do something else. Your brain will subconsciously work on the problem and wake you at 4am with a solution. Even if that doesn’t happen, fresh eyes will spot that obvious missing semicolon.
Node.js Debugging: Environment Variables
Environment variables that are set within the host operating system can be used to control Node.js application settings. The most common is NODE_ENV, which is typically set to development when debugging.
Environment variables can be set on Linux/macOS:
NODE_ENV=development
Windows cmd:
set NODE_ENV=development
Or Windows Powershell:
$env:NODE_ENV="development"
Internally, an application will enable further debugging features and messages. For example:
// is NODE_ENV set to "development"?
const DEVMODE = (process.env.NODE_ENV === 'development');

if (DEVMODE) {
  console.log('application started in development mode on port ${PORT}');
}
NODE_DEBUG enables debugging messages using the Node.js util.debuglog (see below), but also consult the documentation of your primary modules and frameworks to discover further options.
Note that environment variables can also be saved to a .env file. For example:
NODE_ENV=development
NODE_LOG=./log/debug.log
SERVER_PORT=3000
DB_HOST=localhost
DB_NAME=mydatabase
Then loaded using the dotenv module:
require('dotenv').config();
Node.js Debugging: Command Line Options
Various command-line options can be passed to the node runtime when launching an application. One of the most useful is --trace-warnings, which outputs stack traces for process warnings (including deprecations).
Any number of options can be set, including:
--enable-source-maps: enable source maps (experimental)--throw-deprecation: throw errors when deprecated features are used--inspect: activate the V8 inspector (see below)
By way of an example, let’s try to log the crypto module’s DEFAULT_ENCODING property, which was deprecated in Node v10:
const crypto = require('crypto');

function bar() {
  console.log(crypto.DEFAULT_ENCODING);
}

function foo(){
  bar();
}

foo();
Now run this with the following:
node index.js
We’ll then see this:
buffer
(node:7405) [DEP0091] DeprecationWarning: crypto.DEFAULT_ENCODING is deprecated.
However, we can also do this:
node --trace-warnings index.js
That produces the following:
buffer
(node:7502) [DEP0091] DeprecationWarning: crypto.DEFAULT_ENCODING is deprecated.
    at bar (/home/Desktop/index.js:4:22)
    at foo (/home/Desktop/index.js:8:3)
    at Object.<anonymous> (/home/Desktop/index.js:11:1)
    at Module._compile (internal/modules/cjs/loader.js:1151:30)
    at Object.Module._extensions..js (internal/modules/cjs/loader.js:1171:10)
    at Module.load (internal/modules/cjs/loader.js:1000:32)
    at Function.Module._load (internal/modules/cjs/loader.js:899:14)
    at Function.executeUserEntryPoint [as runMain] (internal/modules/run_main.js:71:12)
    at internal/main/run_main_module.js:17:47
This tells us that the deprecation warning comes from the code in line 4 (the console.log statement), which was executed when the bar function ran. The bar function was called by the foo function on line 8 and the foo function was called on line 11 of our script.
Note that the same options can also be passed to nodemon.
Console Debugging
One of the easiest ways to debug an application is to output values to the console during execution:
console.log( myVariable );
Few developers delve beyond this humble debugging command, but they’re missing out on many more possibilities, including these:
console method |
description |
|---|---|
.log(msg) |
output a message to the console |
.dir(obj,opt) |
uses util.inspect to pretty-print objects and properties |
.table(obj) |
outputs arrays of objects in tabular format |
.error(msg) |
output an error message |
.count(label) |
a named counter reporting the number of times the line has been executed |
.countReset[label] |
resets a named counter |
.group(label) |
indents a group of log messages |
.groupEnd(label) |
ends the indented group |
.time(label) |
starts a timer to calculate the duration of an operation |
.timeLog([label] |
reports the elapsed time since the timer started |
.timeEnd(label) |
stops the timer and reports the total duration |
.trace() |
outputs a stack trace (a list of all calling functions) |
.clear() |
clear the console |
console.log() accepts a list of comma-separated values. For example:
let x = 123;
console.log('x:', x);
// x: 123
However, ES6 destructuring can offer similar output with less typing effort:
console.log({x});
// { x: 123 }
Larger objects can be output as a condensed string using this:
console.log( JSON.stringify(obj) );
util.inspect will format objects for easier reading, but console.dir() does the hard work for you.
Node.js util.debuglog
The Node.js util module offers a built-in debuglog method which conditionally writes messages to STDERR:
const util = require('util');
const debuglog = util.debuglog('myapp');

debuglog('myapp debug message [%d]', 123);
When the NODE_DEBUG environment variable is set to myapp (or a wildcard such as * or my*), messages are displayed in the console:
NODE_DEBUG=myapp node index.js
MYAPP 9876: myapp debug message [123]
Here, 9876 is the Node.js process ID.
By default, util.debuglog is silent. If you were to run the above script without setting a NODE_DEBUG variable, nothing would be output to the console. This allows you to leave helpful debug logging in your code without cluttering the console for regular use.
Debugging with Log Modules
Third-party logging modules are available should you require more sophisticated options for messaging levels, verbosity, sorting, file output, profiling, and more. Popular options include:
Node.js V8 Inspector
In the following sections, the pagehit project developed in other tutorials is used to illustrate debugging concepts. You can download it with:
git clone https://github.com/sitepoint-editors/pagehit-ram
Or you can use any of your own code.
Node.js is a wrapper around the V8 JavaScript engine which includes its own inspector and debugging client. To start, use the inspect argument (not to be confused with --inspect) to start an application:
node inspect ./index.js
The debugger will pause at the first line and display a debug> prompt:
< Debugger listening on ws://127.0.0.1:9229/6f38abc1-8568-4035-a5d2-dee6cbbf7e44
< For help, see: https://nodejs.org/en/docs/inspector
< Debugger attached.
Break on start in index.js:7
  5 const
  6   // default HTTP port
> 7   port = 3000,
  8
  9   // Node.js modules
debug>
You can step through the application by entering:
contorc: continue executionnextorn: run the next commandstepors: step into a function being calledoutoro: step out of a function and return to the calling commandpause: pause running code
Other options include:
- watching variable values with
watch('myvar') - setting breakpoints with the
setBreakpoint()/sb()command (it is usually easier to insert adebugger;statement in your code) restarta script.exitthe debugger (the initial.is required)
If this sounds horribly clunky, it is. Only use the built-in debugging client when there’s absolutely no other option, you’re feeling particularly masochistic, and you’re not using Windows (it’s often problematic).
Node.js Debugging with Chrome
The Node.js inspector (without the debugger client) is started with the --inspect flag:
node --inspect ./index.js
Note: nodemon can be used instead of node if necessary.
This starts the debugger listening on 127.0.0.1:9229, which any local debugging client can attach to:
Debugger listening on ws://127.0.0.1:9229/20ac75ae-90c5-4db6-af6b-d9d74592572f
If you’re running the Node.js application on another device or Docker container, ensure port 9229 is accessible and grant remote access using this:
node --inspect=0.0.0.0:9229 ./index.js
Alternatively, you can use --inspect-brk to set a breakpoint on the first statement so the application is paused immediately.
Open Chrome and enter chrome://inspect in the address bar.
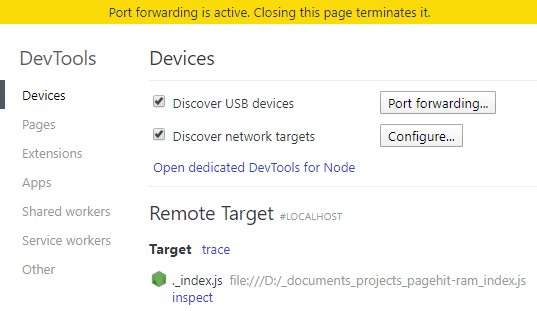
Note: if the Node.js application does’t appear as a Remote Target, ensure Discover network targets is checked, then click Configure to add the IP address and port of the device where the application is running.
Click the Target’s inspect link to launch DevTools. It will be immediately familiar to anyone with browser debugging experience.
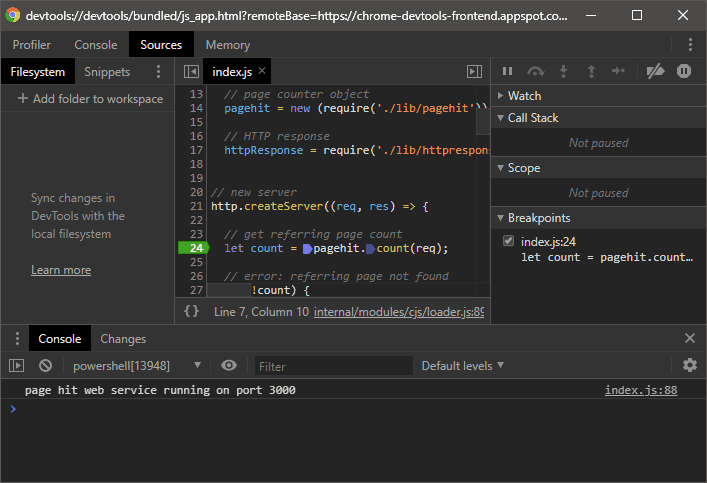
The + Add folder to workspace link allows you to select where the Node.js files are located on your system, so it becomes easier to load other modules and make changes.
Clicking any line number sets a breakpoint, denoted by a green marker, which stops execution when that code is reached:
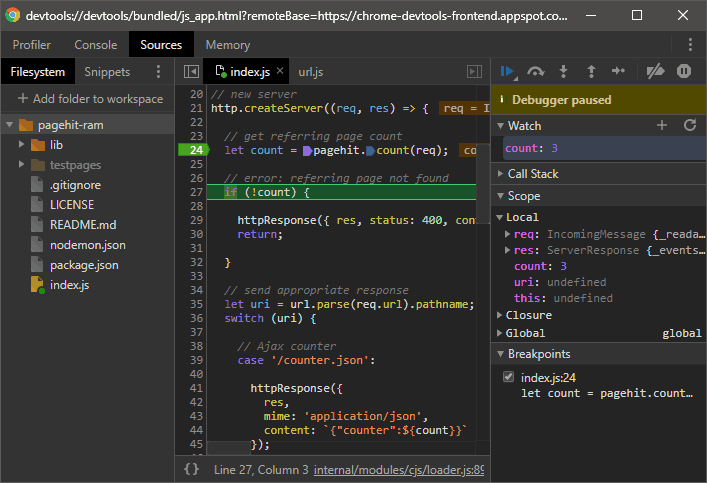
Variables can be added to the Watch pane on the right by clicking the + icon and entering their name. Their value is shown whenever execution is paused.
The Call Stack pane shows which functions were called to reach this point.
The Scope pane shows the state of all available local and global variables.
The Breakpoints pane shows a list of all breakpoints and allows them to be enabled or disabled.
The icons above the Debugger paused message can be used to resume execution, step over, step into, step out, step through, deactivate all breakpoints, and pause on exceptions.
Node.js Debugging with VS Code
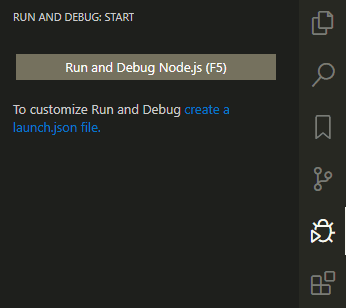
VS Code Node.js debugging can be launched without any configuration when you’re running a Node.js application on your local system. Open the starting file (typically index.js), activate the Run and Debug pane, and click the Run and Debug Node.js (F5) button.
The debugging screen is similar to Chrome DevTools with a Variables, Watch, Call stack, Loaded scripts, and Breakpoints list.
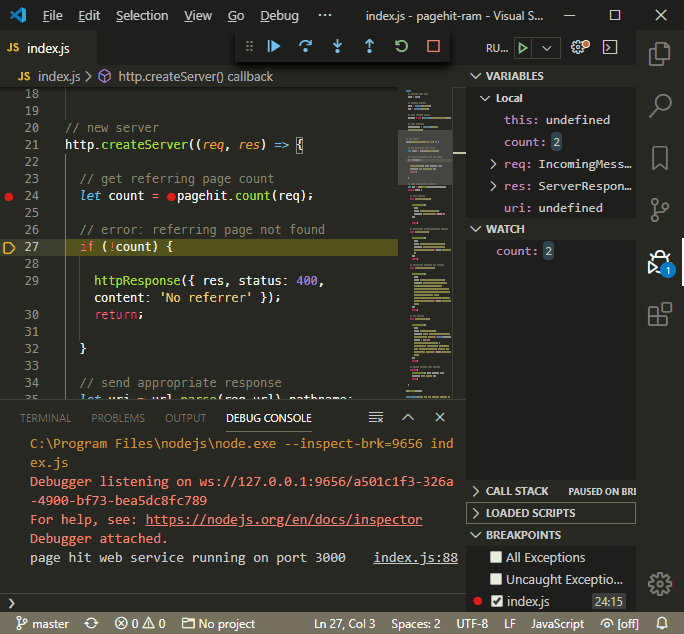
A breakpoint can be set by clicking the gutter next to the line number. You can also right-click.
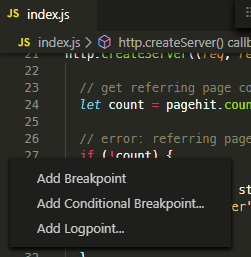
With this right-click, you can set the following:
-
A standard breakpoint.
-
A conditional breakpoint which stops when criteria are met — for example,
count > 3. -
A logpoint, which is effectively
console.log()without code! Any string can be entered with expressions denoted in curly braces — for example,{count}to display the value of thecountvariable.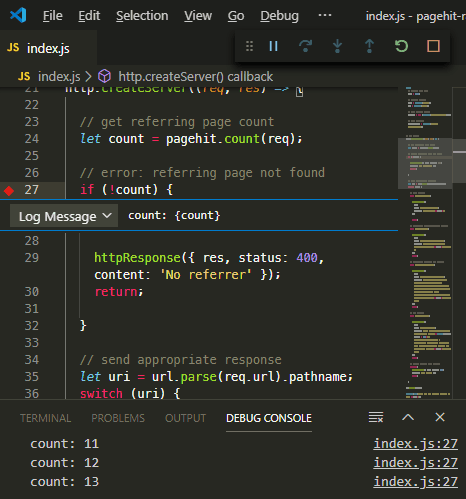
Note: don’t forget to hit Return for VS Code to create your conditional breakpoint or logpoint.
The debugging icon bar at the top can be used to resume execution, step over, step into, step out, restart, or stop the application and debugging. Identical options are also available from the Debug item in the menu.
For more information, refer to Debugging in Visual Studio Code.
Advanced Debugging Configuration
Further configuration is required when you’re debugging a remote service or need to use different launch options. VS Code stores launch configurations in a launch.json file generated inside the .vscode folder within your project. To generate or edit the file, click the cog icon at the top right of the Run and Debug pane.
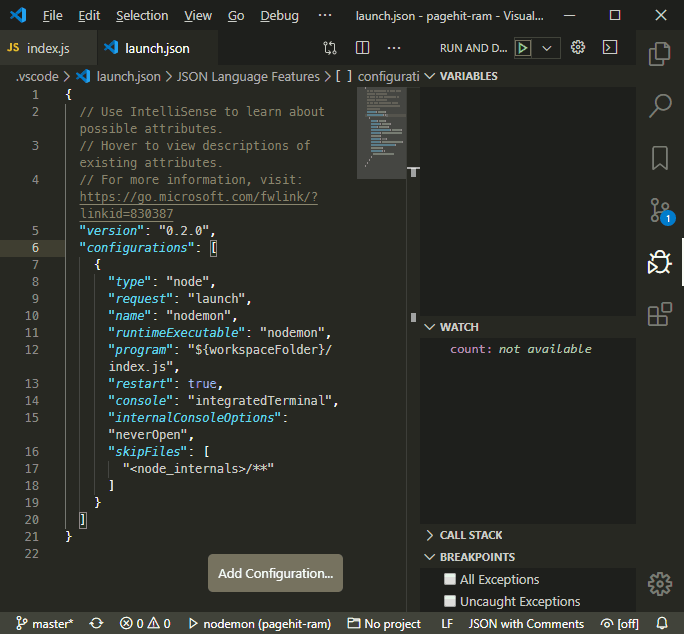
Any number of configuration settings can be added to the configurations array. Click the Add Configuration button to choose an option. VS Code can either:
- launch a process using Node.js itself, or
- attach to a Node.js inspector process, perhaps running on a remote machine or Docker container
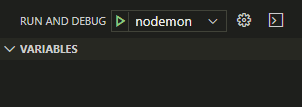
In the example above, a single Nodemon launch configuration has been defined. Save launch.json, select nodemon from the drop-down list at the top of the Run and Debug pane, and click the green start icon.
For further information, see VS Code Launch configurations.
Other Node.js Debugging Tools
The Node.js Debugging Guide provides advice for other IDEs and editors including Visual Studio, JetBrains, WebStorm, Gitpod, and Eclipse. Atom also has a node-debug extension.
ndb offers an improved debugging experience with powerful features such as attaching to child processes and script blackboxing so only code in specific folders is shown.
The IBM report-toolkit for Node.js works by analyzing data output when node is run with the --experimental-report option.
Finally, commercial services such as LogRocket and Sentry.io integrate with your live web application in both the client and the server to record errors as they’re encountered by users.
Get Debugging!
Node.js has a range of great debugging tools and code analyzers which can improve the speed and reliability of your application. Whether or not they can tempt you away from console.log() is another matter
FAQs About Debugging Node.js Applications
Common debugging tools for Node.js include the built-in debugger, Node.js Inspector, Visual Studio Code with integrated debugging, and third-party tools like Node.js’s ndb and node-debug.
You can start debugging by running your Node.js script with the inspect or inspect-brk flag, like this: node inspect your-script.js. This will launch the debugger and allow you to set breakpoints and inspect your code.
inspect and inspect-brk in Node.js debugging? inspect allows you to attach the debugger after the application starts, while inspect-brk will break the application at the very beginning, allowing you to set breakpoints before any code is executed.
You can set breakpoints by using the debugger statement in your code or by using the built-in debugger’s break command. In IDEs like Visual Studio Code, you can simply click in the left margin of the code editor to set breakpoints.
console.log statement in debugging? While debugging, you can use console.log statements to output information to the console, helping you understand the state of your application at different points in the code.
To debug asynchronous code, use async/await, and set breakpoints within your asynchronous functions. Debugging tools will halt at these breakpoints, allowing you to inspect the async code’s state.
Performance debugging can be done with tools like the built-in --inspect flag, flamegraphs, and profiling tools like clinic.js. These tools help identify bottlenecks and slow code execution.
Remote debugging allows you to debug a Node.js application running on a different server or environment. You can use remote debugging by specifying the host and port options when starting the debugger and connecting to it from your local development environment.