
Key Takeaways
- Shiny and R platforms are becoming vital in the merging of data science and web development, enabling smoother interaction between statistical computing platforms and the web. This is driven by the need for more interactive user interfaces in data analysis and the growing role of cloud-based applications.
- The Shiny platform allows for the creation of user-friendly applications that can instantaneously manipulate and visualize data. This is achieved through the use of reactive expressions, which automatically update the values of one variable based on changes in another.
- Shiny can be customized using HTML to modify the user interface of the web page. This allows further personalization of the design and layout of the app, enhancing the user experience.
- While Shiny is primarily designed for R programming, it can also be used with other languages like JavaScript to customize the user interface. This flexibility makes Shiny a versatile tool for creating dynamic and interactive web applications.

With the advent of data science and the increased need to analyze and interpret vast amounts of data, the R language has become ever more popular. However, there’s increasingly a need for a smooth interaction between statistical computing platforms and the web, given both 1) the need for a more interactive user interface in analyzing data, and 2) the increased role of the cloud in running such applications.
Statisticians and web developers have thus seemed an unlikely mix till now, but make no mistake that the interactions between these two groups will continue to increase as the need for web-based platforms becomes ever more popular in the world of data science. In this regard, the interaction of the R and Shiny platforms is quickly becoming a cornerstone of interaction between the world of data and the web.
In this tutorial, we’ll look primarily at the commands used to build an application in Shiny — both on the UI (user interface) side and the server side. While familiarity with the R programming language is invariably helpful in creating a Shiny app, expert knowledge is not necessary, and this example will cover the building of a simple statistical graph in Shiny, along with some basic commands illustrating how to customize the web page through HTML.
Installing and Loading Shiny Web Apps
To start off, we must first install the RStudio platform in order to create and run a Shiny Web App. RStudio can be downloaded from the RStudio website.
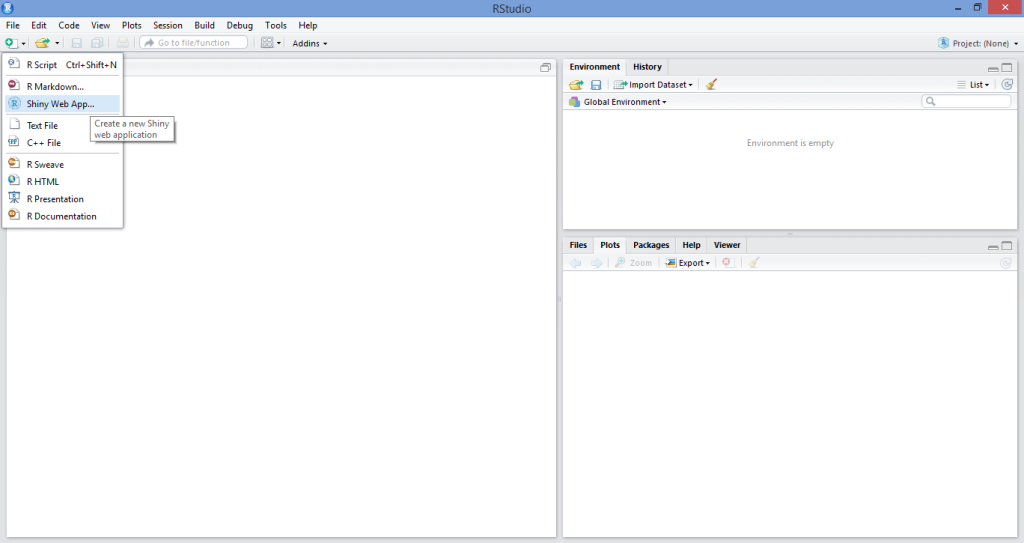
Once we’ve loaded the RStudio platform, we then create our new Shiny web application by selecting the New File option, and then the Shiny Web App… option.
Upon doing that, we’re presented with an interface that allows us to name our application (I’ve named it “OurFirstApp”, but feel free to come up with other creative names!), and we then select Multiple File (ui.R/server.R) as our application type:
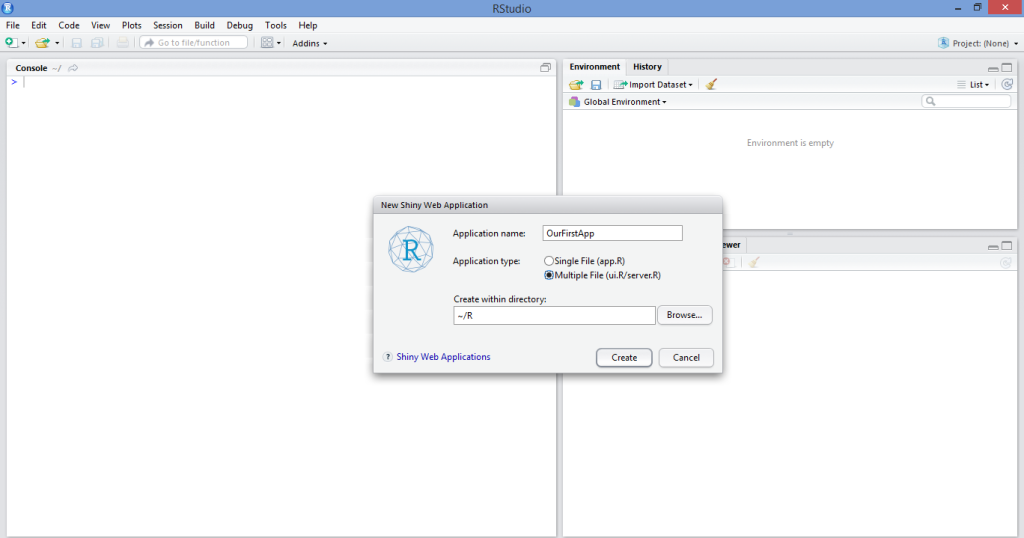
While we could select Single File (app.R), this literally just combines the ui.R and server.R scripts into one. I personally prefer to keep the two separate in order to keep the code less cluttered, but this is a matter of personal preference.
As a side note, there’s also a web platform available on the Shinyapps site, which allows users to share their Shiny applications online, as well as use the rsconnect package to control such applications remotely from the R console. While the methodology for doing this is outside the scope of this article, I definitely intend on expanding this topic further in subsequent articles given interest.
In any case, once we have named our Shiny Web App and opened up the source code, we’re presented with a template app that uses a dataset “Old Faithful Geyser Data” to generate a histogram. For the purposes of this tutorial, we’ll be writing our own app and customizing it according to our needs.
Running the Application
As already stated, the primary components of a Shiny Web App are the user interface side (ui.R) and the server side (server.R).
For this particular app, we’re going to create a simple line graph with a plot of N observations on the x-axis and probability of occurrence on the y-axis. Essentially, this app creates a slider allowing us to select a value (N) between 1–50. N can be thought of as the number of trials, i.e. if a value of 2 is selected, then 2 trials equal a probability of 100 percent. On the other hand, if a value of 50 is selected, then 50 trials must be conducted for the probability of occurrence to equal 100 percent. On a graph where N = 50, then sliding back down to N = 25 would correspond to a 50 percent probability, and the graph updates to reflect this automatically. Note that this is somewhat of an overly simplistic example mathematically, but is merely being used to illustrate how reactivity works in the context of graph generation across the Shiny platform.
While the below code will ultimately be modified slightly to allow for greater customization using HTML, it’s the code used to create both the ui.R and server.R files:
ui.R
#Call the “shiny” library
library(shiny)

#Define the UI for application that draws a probability plot
shinyUI(fluidPage(

  #Name the Title of the applicationh
  titlePanel("Probability Plots"),

  #Create a sidebar with a slider input for number of trials
  sidebarLayout(
    sidebarPanel(
       sliderInput("lambda",
                "Number of trials:",
                min = 1,
                max = 50,
                value = 1)
  ),

    #Show a plot of the generated probability plot
    mainPanel(
       plotOutput("ProbPlot")
    )
  )
))
server.R
#Define the “shiny”, “ggplot2” and “scales” libraries
library(shiny)
library(ggplot2)
library(scales)

#Shiny Application
shinyServer(function(input, output) {

#Create a reactive expression
output$ProbPlot <- renderPlot({

  #Generate lambda value based on input$lambda from ui.R
  n=1:100
  lambda <- seq(min(n), max(n), length.out = input$lambda)
  probability=lambda

  #Generate the probability plot
  plot(probability, type = "o", col = 'blue', border = 'white', xlab="N (Number of Observations)", ylab ="Probability of occurrence")

})

})
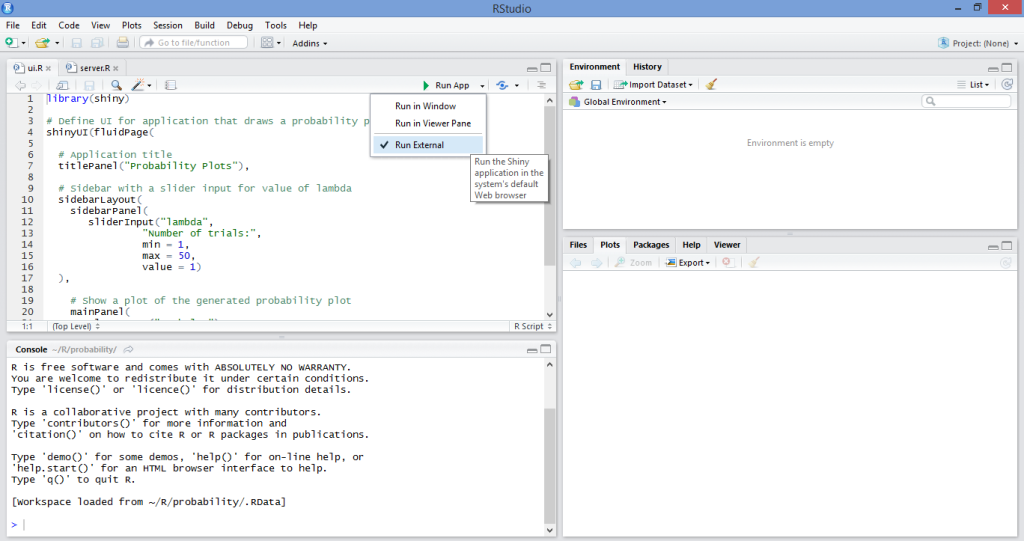
We then run our application by selecting the Run External option as below, and then selecting Run App:
Once we run our application, we observe that the graph then updates automatically, allowing us to visually analyze on a line graph the relationship between N and probability of occurrence depending on the number of trials we’ve selected:
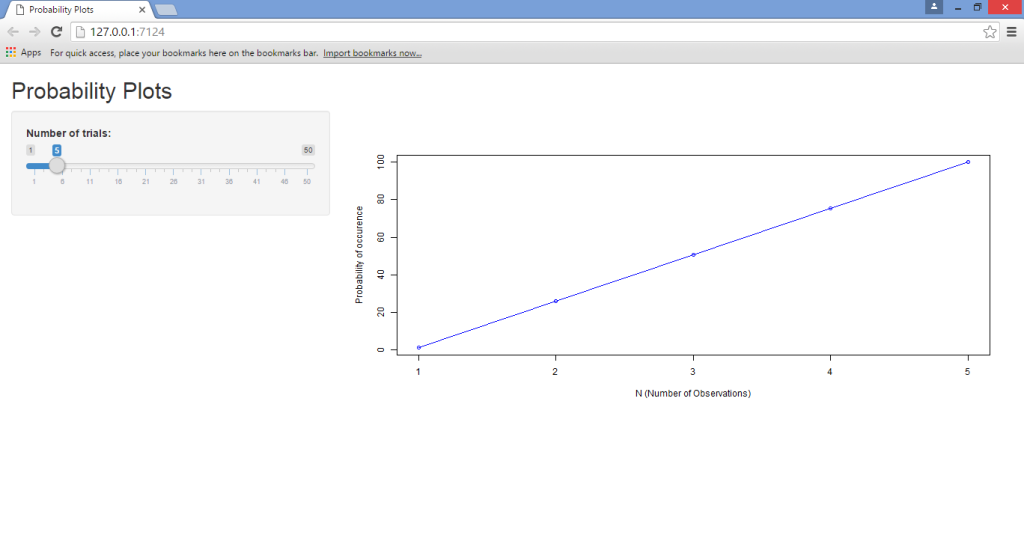
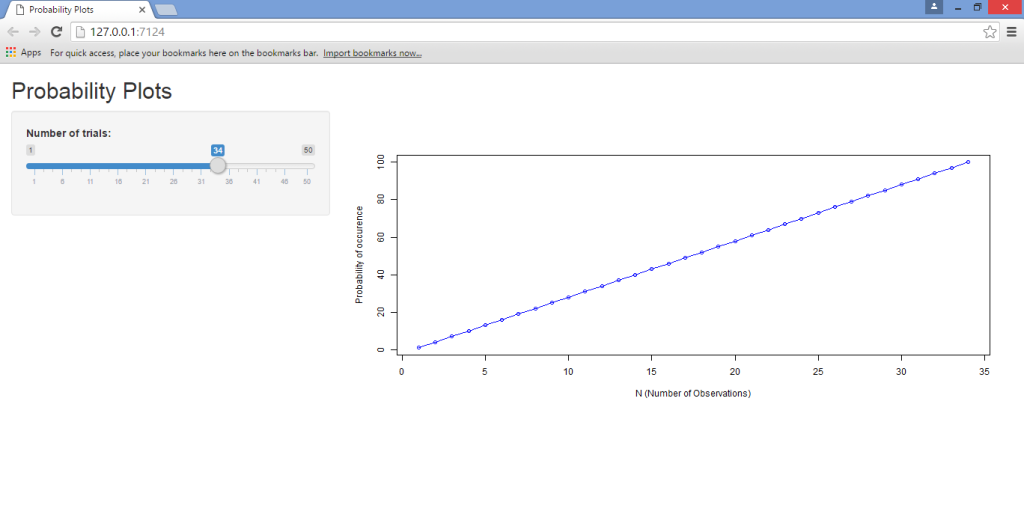
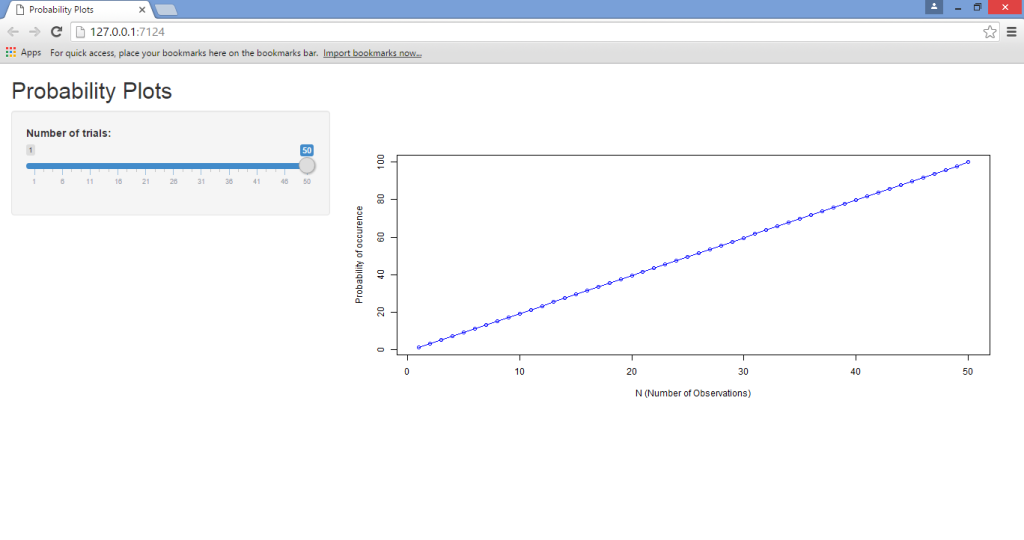
As we can see, running this app through Shiny has made it much more user-friendly, in that the slider allows for instantaneous manipulation and observation of the results. This is known as a reactive expression, where the values of one variable automatically update given changes in another. Had we chosen to run this program using R solely, then we would need to type a new value for N into the source code each time we wish to run the program, and this is ultimately very monotonous and inefficient — especially for users who don’t already have R language knowledge.
Some points to note from the above scripts:
- The
sidebarLayoutfunction is what allows us to create the sliding sidebar that enables us to input a specific value for the number of trials. We’re defining this by means of themin(minimum value),max(maximum value), andvalue(which is the number of values between each value in the series). - Note that, in the
server.Rscript, the code includes both the ggplot2 and scales libraries. When running the program yourself, you will notice that these two libraries are not strictly required to run this particular application. However, I have included them as the ggplot2 library is of great use when running more sophisticated graphs, while the scales library allows for greater customization of graph data that requires different scaling methods across a range of axes or legends. - Moreover, we see that when we generate a lambda value (for the second-last command of the
server.Rscript), we do so by making the variable a function of the minimum and maximum value ofn, which we have defined as 1 to 100. This is where we define the interaction betweennand our probability function (known as lambda), which in turn gives rise to a reactive expression:
#Generate lambda value based on input$lambda from ui.R
  n=1:100
  lambda <- seq(min(n), max(n), length.out = input$lambda)
  probability=lambda
HTML Customization
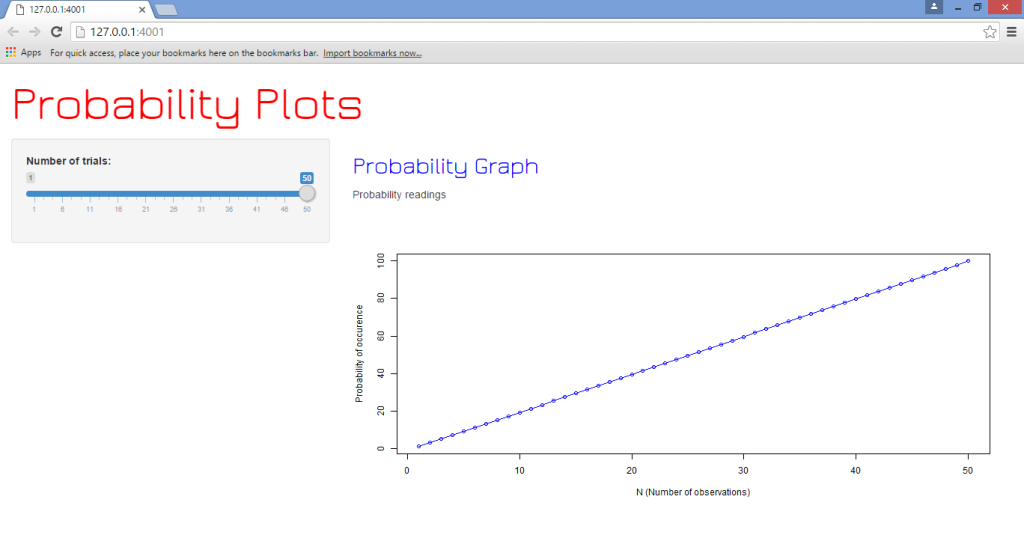
As seen above, we created an application that is able to use a reactive expression in updating a line graph and its axes instantaneously. However, given that we are creating a web page with the application after all, suppose that we wish to update the page design using HTML?
The HTML editing that we’ll perform here is, in itself, quite basic. For this tutorial, we’ll simply concentrate on how to edit the titles of the web page in terms of font and color. However, the purpose behind this is to illustrate specifically how to edit the user interface code in R to be able to customize the web page, which is the main takeaway for this tutorial. This involves a slight modification of the ui.R file that we generated above to allow for HTML inserts.
One of the most important things to note is that we are only modifying our ui.R file — the server.R file remains the same as above. This is clearly because HTML is being used for the purposes of modifying the user interface; it’s not being used to modify the parameters of the application itself.
(The template that I’m using to edit the headings of the web page in this instance is based on Chris Beeley’s Second Edition of Web Application Development with R Using Shiny. I have personally found it to be a great guide, and highly recommend it to anyone looking to increase their knowledge of R/Shiny programming and web platforms.)
The modified ui.R program that we use to construct the updated web page is as follows:
ui.R
#Call the “shiny” library
library(shiny)

# Define UI for application that draws a probability plot
shinyUI(fluidPage(
  tags$head(HTML("<link href='http://fonts.googleapis.com/css?family=Jura' rel='stylesheet' type = 'text/css'>")),

  h2("Probability Plots", style = "font-family: 'Jura'; color: red; font-size: 64px;"),

  # Application title
  #titlePanel("Probability Plots"),

  # Sidebar with a slider input for value of lambda
  sidebarLayout(
    sidebarPanel(
       sliderInput("lambda",
                "Number of trials:",
                min = 1,
                max = 50,
                value = 1)
  ),
    # Show a plot of the generated probability plot
    mainPanel(
      h3("Probability Graph", style = "font-family: 'Jura'; color: blue; font-size: 32px;"),
      HTML("<p>Probability readings</p>"),
       plotOutput("ProbPlot")
    )
  )
))
In looking at the difference between this ui.R script and that of the previous one, we note that we’re adding to the shinyUI(fluidPage) command by defining Google Fonts as the font family using the tags$head command. Moreover, we use the h2 heading to define the “Probability Plots” heading for the page itself, and subsequently the h3 heading to define the “Probability Graph” for the graph we have plotted.
Once we run the above code in conjunction with the server.R script, we generate the following graph (along with the same slider selection and reactivity as we observed previously):
Conclusion
In this tutorial, we’ve covered:
- The procedures to install RStudio and load a Shiny Web App in R
- How to create a plot in Shiny and form reactive expressions
- Using HTML to customize Shiny webpages.
Needless to say, this application is merely touching the tip of the iceberg in terms of Shiny’s many capabilities with the R platform.
Moreover, Shiny can also be used with other languages such as JavaScript in customizing the user interface of the respective web pages being loaded by the application. However, the above tutorial serves to act as a baseline in developing and running Shiny applications.
I hope this tutorial has been helpful and of interest to you. Let us know what you think in the comments below, and tell us if there are any other Shiny and R topics you’d like us to cover.
Frequently Asked Questions about Merging Data Science and Web Development
What is the significance of merging data science and web development?
The integration of data science and web development is a game-changer in the tech industry. Data science provides valuable insights from large data sets, while web development makes these insights accessible and understandable to users. By merging these two fields, we can create interactive, data-driven websites and applications. This combination allows for real-time data analysis and visualization, enhancing user experience and decision-making processes.
How does Shiny R facilitate the merging of data science and web development?
Shiny R is a powerful tool that bridges the gap between data science and web development. It allows data scientists to create interactive web applications without the need for extensive knowledge in HTML, CSS, or JavaScript. With Shiny R, data scientists can focus on the data analysis part, while the package takes care of the web development aspect. This makes the process of creating data-driven web applications more efficient and accessible.
What are the prerequisites for using Shiny R?
To use Shiny R effectively, you need to have a basic understanding of R programming and data analysis. Familiarity with HTML and CSS can be beneficial but is not necessary as Shiny R abstracts most of the web development complexities.
Can I use other programming languages with Shiny R?
Shiny R is primarily designed for R programming. However, it does allow for the integration of other languages like JavaScript for more advanced functionalities. This flexibility makes Shiny R a versatile tool for creating dynamic and interactive web applications.
How does Shiny R compare to other web development tools?
Unlike traditional web development tools, Shiny R is specifically designed for data science applications. It simplifies the process of creating interactive, data-driven web applications, making it a preferred choice for data scientists. However, for more complex web development tasks, traditional tools like HTML, CSS, and JavaScript may be more suitable.
What are some practical applications of Shiny R in web development?
Shiny R can be used to create a wide range of web applications, from simple data visualization tools to complex interactive dashboards. For instance, it can be used in business analytics to create real-time dashboards, in healthcare for patient data analysis, or in e-commerce for customer behavior analysis.
How does Shiny R handle real-time data?
Shiny R is capable of handling real-time data through reactive programming. This means that the application can automatically update and display new data without the need for manual intervention. This feature is particularly useful for applications that require real-time data analysis and visualization.
Is Shiny R suitable for large-scale web applications?
While Shiny R is a powerful tool for creating interactive web applications, it may not be the best choice for large-scale applications due to its server-side rendering. However, with proper optimization and the use of additional tools like Shiny Server or Shinyapps.io, it can be used for larger applications.
What are the limitations of using Shiny R for web development?
While Shiny R simplifies the process of creating web applications, it does have some limitations. For instance, it may not be suitable for complex web development tasks that require extensive customization. Additionally, as it is server-side, it may not perform well with large-scale applications without proper optimization.
How can I learn more about using Shiny R for web development?
There are many resources available online to learn about Shiny R. The official R Studio website provides comprehensive documentation and tutorials. Additionally, there are numerous online courses, blogs, and forums where you can learn and get help from the community.