

Key Takeaways
- Xdebug is a PHP extension that enhances code debugging and profiling, providing detailed stack traces for errors. This tutorial provides a step-by-step guide on setting up Xdebug with PHPStorm for Vagrant hosted PHP apps.
- The process involves installing and booting Homestead, installing a sample Laravel app, and configuring the xdebug.ini file to enable remote usage. PHPStorm also requires configuration, including adding a new server and creating a debug environment.
- The tutorial concludes with a testing phase to ensure the setup works as expected. The process is easily adaptable to integrate Xdebug into other IDEs, with only the PHPStorm sections likely needing changes.
By now, we’ve all learned to love Vagrant and the development flexibility it provides. No matter the platform, you can easily have a development environment up and running in no time that’s not only stable, but also identical in every regard to the environment your colleagues, mentors or mentees use. But as the applications we’re developing reside inside a virtual machine, they’re a bit tricky to debug with Xdebug which is, by default, tuned for localhost.
Xdebug is a PHP extension which allows you to debug and profile your code, view detailed and readable stack traces when errors happen, and much more. For a detailed walkthrough, see Shameer’s post. If you’re completely unfamiliar with it, you would do well to first install it following the procedures below, and then refer to the post linked above for a breakdown of everything Xdebug can do for you and your apps.
In this tutorial, we’ll set up Xdebug with PHPStorm for Vagrant hosted PHP apps.
Preparation
To prepare the environment, please install and boot Homestead.
Once it’s booted, vagrant ssh into it, and install a sample Laravel app. You can do this by executing:
composer create-project laravel/laravel Laravel --prefer-dist
When you get the Laravel greeting screen, you’re good to go.
Installing Xdebug
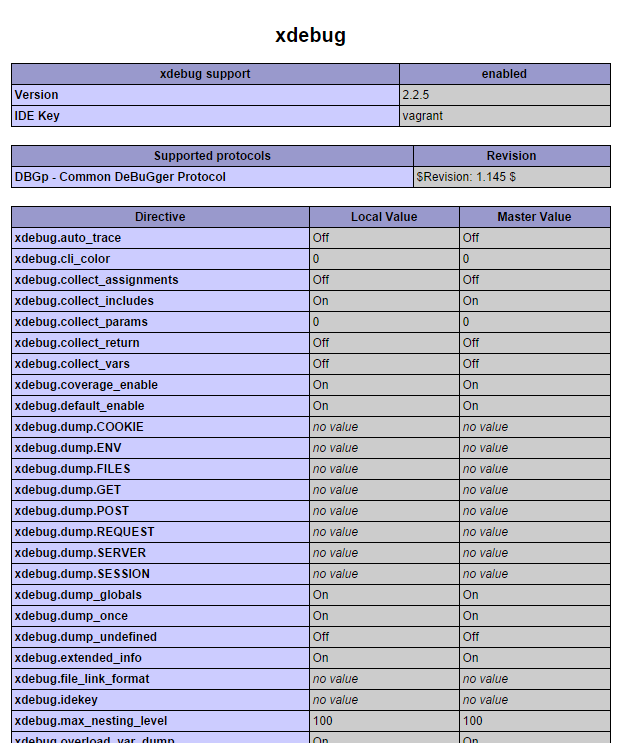
This step can be skipped. Homestead comes with Xdebug installed and enabled. You can see this by looking at phpinfo() after booting Homestead:
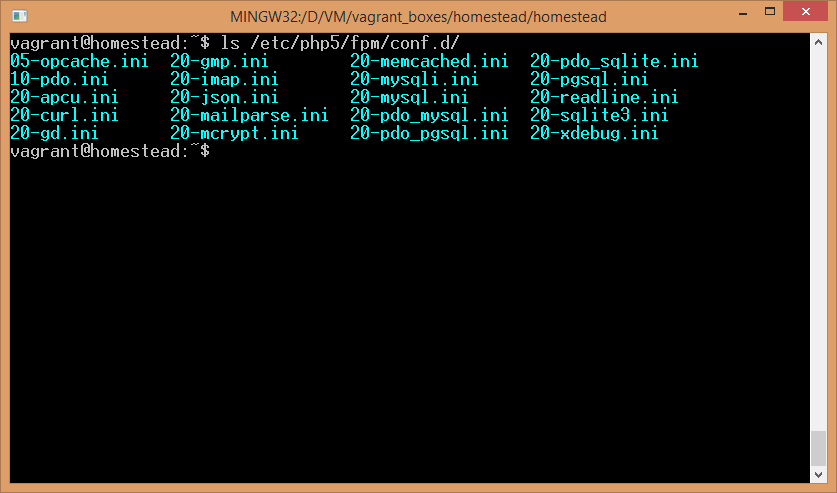
or by checking out the conf.d folders of PHP FPM and PHP CLI:
ls /etc/php5/fpm/conf.d

ls /etc/php5/cli/conf.d
If you see xdebug.ini in there, it’s loaded. If you’re using any other Vagrant box instead and xdebug isn’t present, refer to Shameer’s post for installation instructions.
Configuring xdebug.ini
To allow Xdebug to be used remotely, we need to alter the ini file and give it some parameters that are off by default. Homestead’s default xdebug.ini file (found in /etc/php5/mods-available) originally only contains the directive that tells PHP to enable it, but nothing else:
zend_extension=xdebug.so
Under that line, add the following options:
xdebug.remote_enable = on

xdebug.remote_connect_back = on

xdebug.idekey = "vagrant"
Close the file and restart php-fpm: sudo service php5-fpm restart. That’s all we need to configure on Xdebug’s end.
Configuring PHPStorm – Servers
PHPStorm needs a bit of configuration, too. First, use it to open the directory of the Laravel app we created in step 1:
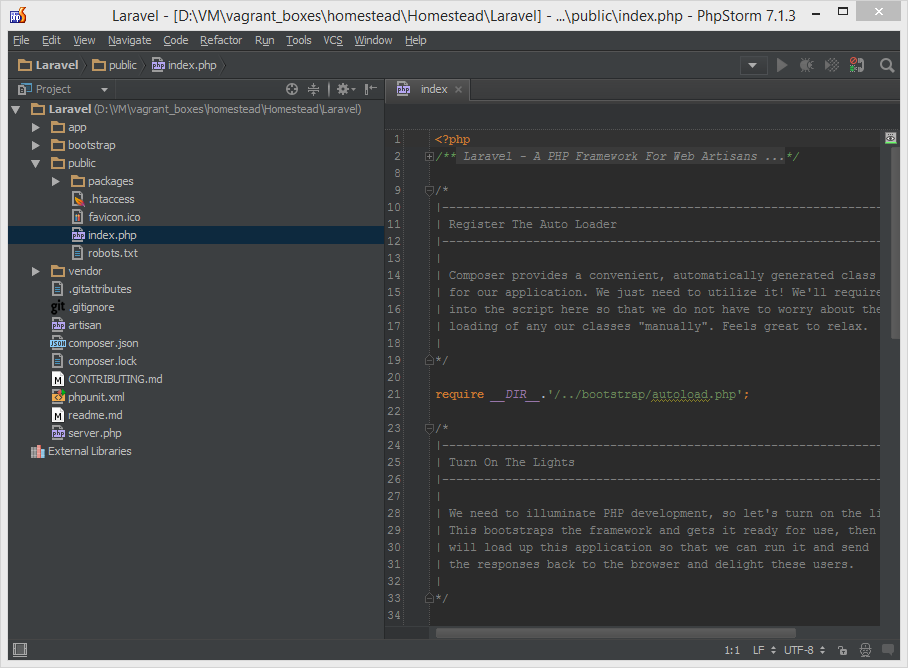
Then, go to project settings and under PHP -> Servers add a new one. Give it port 8000, the name of your choice, and under host, put the name of your site’s virtual host (default: homestead.app). Then, use Path Mappings to map paths so that the location of your codebase on the host machine corresponds to the location on the VM. Do the same for the public subfolder. Basically, transplant the folders block from Homestead.yaml to this window. Follow my example:
Configuring PHPStorm – Debug Configuration
To run the debugger on an app, we need to create a debug environment. Go into Run -> Edit Configurations. In there, create a new configuration for “PHP Web Application”:
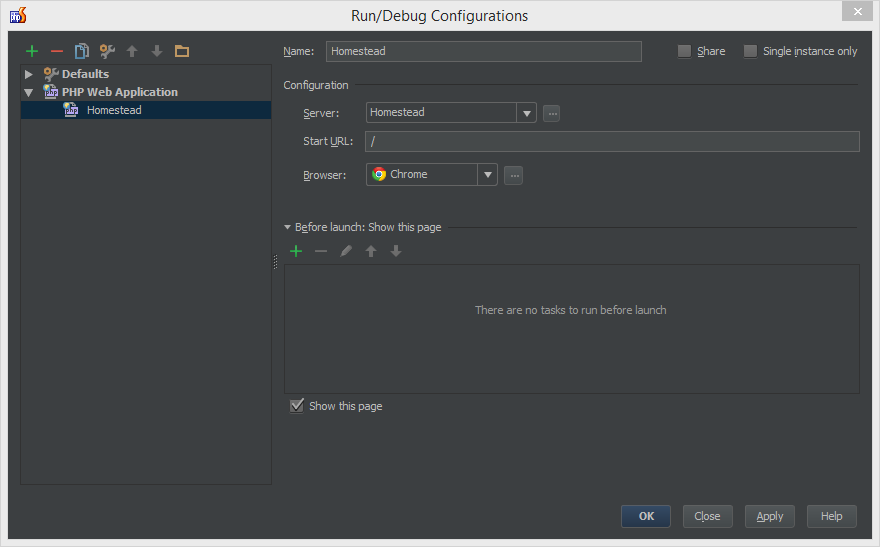
Apply the new settings and close the configuration.
Testing
That’s all there is to setting it up. Let’s see if it works as expected.
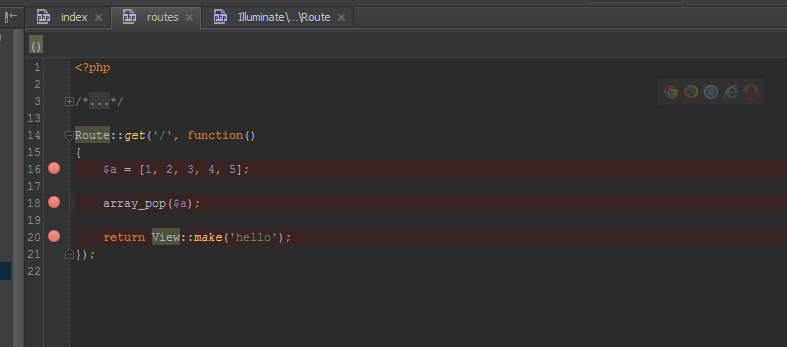
In app/routes.php, alter the home route’s closure so that it looks like the code below:
Route::get('/', function()

{

    $a = [1, 2, 3, 4, 5];
    array_pop($a);
	return View::make('hello');

});
Then, put a breakpoint next to each line of the closure that does something, like so:
Let’s test these breakpoints. If you have the app open in your browser, close that tab now, otherwise PHPStorm won’t be able to re-run it. Then, go to Run -> Debug and run your predefined debug configuration. A new tab should launch and immediately return you to PHPStorm with an output similar to this one:
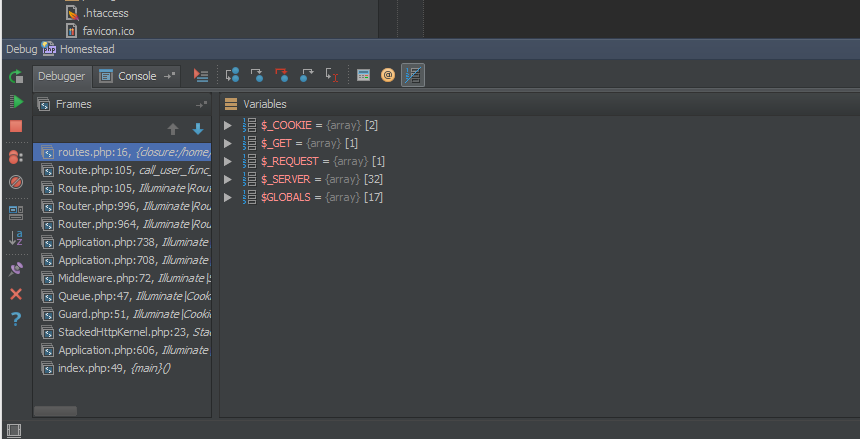
The left frame lists the stacktrace – the files the request already went through – and stops at routes.php, our file. You’ll notice in the right panel that only the superglobals are declared – no other variables are present at this time. Clicking the Resume button moves on to the next breakpoint and produces the following output:
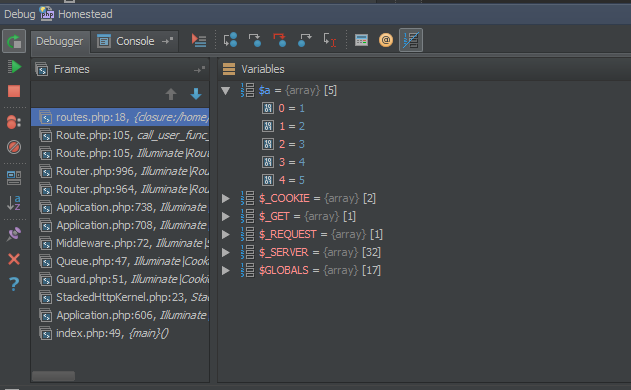
Notice our $a variable is there now. Also notice you can expand it to see what it contains. Clicking the Resume button once more produces a slightly different output:
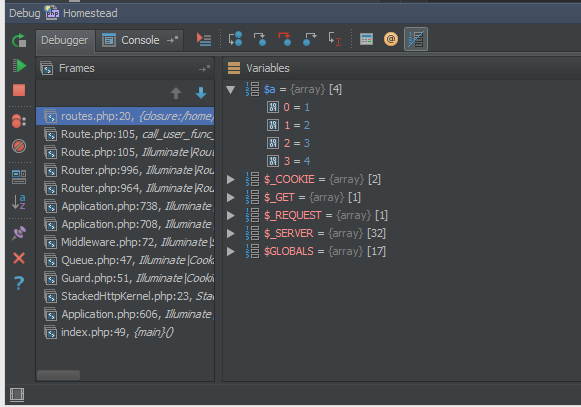
Our $a array has one less element due to the array_pop operation we performed. This proves our breakpoints work as intended, and Xdebug has been successfully set up.
Conclusion
Despite initial impressions, Xdebug is very easy to install for use via Vagrant when one knows what has to be done. These instructions are easily applicable to Xdebug’s integration into any other IDE as well, so feel free to adapt them as you see fit – only the PHPStorm sections likely need changing.
Do you debug through the VM layer? Are you using any other approaches? Have any problems we neglected to mention? Let us know!
Frequently Asked Questions (FAQs) about Installing Xdebug with PhpStorm and Vagrant
How do I install Xdebug on PhpStorm with Vagrant?
To install Xdebug on PhpStorm with Vagrant, you need to follow a series of steps. First, you need to install Vagrant and VirtualBox. After that, you need to install PhpStorm and configure it to use Xdebug. You also need to configure Xdebug in your php.ini file. Once you have done all these, you can start debugging your PHP code with Xdebug in PhpStorm.
What is Xdebug and why should I use it?
Xdebug is a PHP extension that provides debugging and profiling capabilities. It allows you to step through your code, view variable values, and stack traces. This makes it easier to understand how your code works and to identify any errors or inefficiencies. Xdebug is an essential tool for any PHP developer as it greatly improves the debugging process.
How do I configure PhpStorm to use Xdebug?
To configure PhpStorm to use Xdebug, you need to go to the settings menu and select ‘Languages & Frameworks’, then ‘PHP’, and then ‘Debug’. Here, you can set the debug port and enable the ‘Listen for PHP Debug Connections’ option. You also need to configure the PHP interpreter to use Xdebug.
How do I configure Xdebug in my php.ini file?
To configure Xdebug in your php.ini file, you need to add several lines of code. These include specifying the path to the Xdebug extension, setting the remote_enable and remote_autostart options to 1, and specifying the remote_host and remote_port. The exact code you need to add will depend on your specific setup.
Why am I getting a ‘Connection Refused’ error when trying to use Xdebug?
A ‘Connection Refused’ error usually means that Xdebug is trying to connect to a port that is not open or is being blocked by a firewall. You need to ensure that the port specified in your Xdebug configuration is open and that any firewalls are configured to allow connections to this port.
How do I use Xdebug to debug my PHP code?
To use Xdebug to debug your PHP code, you need to start a debugging session in PhpStorm. You can do this by clicking on the ‘Start Listening for PHP Debug Connections’ button. Then, you need to set breakpoints in your code where you want the execution to pause. When you run your code, the execution will pause at these breakpoints, allowing you to inspect the values of variables and the call stack.
Can I use Xdebug with other IDEs besides PhpStorm?
Yes, Xdebug can be used with a variety of IDEs, not just PhpStorm. However, the process for installing and configuring Xdebug may vary depending on the IDE you are using.
Why is my Xdebug not stopping at breakpoints?
If Xdebug is not stopping at breakpoints, it could be due to a number of reasons. One possibility is that the path mapping in your PhpStorm configuration is incorrect. Another possibility is that the Xdebug extension is not properly installed or configured.
How do I install Xdebug on a remote server?
To install Xdebug on a remote server, you need to follow the same steps as for a local installation, but with a few additional steps. You need to ensure that the Xdebug extension is installed on the server and that the server’s php.ini file is correctly configured. You also need to configure PhpStorm to connect to the remote server.
How do I profile my PHP code with Xdebug?
To profile your PHP code with Xdebug, you need to enable the profiler in your Xdebug configuration. You can then run your code and Xdebug will generate a profiling file. This file can be analyzed with a tool like KCacheGrind or QCacheGrind to get detailed information about the performance of your code.