In this article, we’ll demystify Google Analytics 4, digging in to what’s new in Google Analytics and how it will affect your research into users and their behavior.
Contents:
- Coming to Terms with a Completely New Version of Google Analytics
- Why Use Analytics Data for UX?
- How is Google Analytics 4 different from Universal Analytics?
- How to Get Started with Google Analytics 4
- How to Measure User Behavior with the Explore Feature
Key Takeaways
Coming to Terms with a Completely New Version of Google Analytics
I’ve been using Google Analytics (GA) to help understand user behavior for many years now. I’ve found it so useful that I’ve even written a book for SitePoint on how to use analytics data as part of user research. So when Google first announced that it was releasing Google Analytics 4, I was concerned about what this would mean for my process.
Google Analytics 4 is a completely new version of Google Analytics, not just an incremental version upgrade. Until recently, the version of Google Analytics that everybody was using was Universal Analytics. This has been in place since 2012 and, although it’s seen changes over the years, the core reporting system and functionality have remained largely the same.
When I first started using Google Analytics 4, it seemed completely alien to me, and I just couldn’t get my head into it. I then went through a version of the Five Stages of Grief as I came to terms with the change:
- Denial. My first thought was to ignore it and hope it went away. Not all of Google’s products make it past the beta stage, so I hoped it wouldn’t make it out into the real world.
- Anger. As it became apparent that GA4 wasn’t going away, I was angry at the move. Why were they planning on completely changing a tool that was working well?
- Bargaining. I then became hopeful that Google would continue to support Universal Analytics as an alternative. This hope didn’t last long, though, as Google soon announced it would be “sunsetting” Universal Analytics in July 2023.
- Depression. Depression might be too strong a word, but I was upset about the prospect of losing an important tool in my user research kit. Some level of data analysis has played a part in almost all of my research projects, and this was now under threat.
- Acceptance. Finally, after much reluctance, I gave in to the fact that GA4 is here to stay. I set some time aside to learn all I could about the new tool in order to start using it for my work.
Ultimately, I was pleasantly surprised at the potential for GA4 as a user research tool. As something of a reluctant convert to GA4, I’d like to convince you to take the leap. The tips in this article should help you get started.
Why Use Analytics Data for UX?
Before I talk about GA4 specifically, it’s worth covering why I think analytics should play a part in your UX and user research work.
Good UX is based on evidence. This is often qualitative (qual) evidence, such as observations from usability testing or findings of field research. Using only qualitative evidence, though, means overlooking a huge amount of quantitative data that may be available to you.
Quantitative (quant) data is primarily numerical and can be measured. One major source of quantitative UX data is website analytics, and it can be even more compelling than qualitative evidence. Qual and quant go hand in hand to give a rounded picture of the overall user experience.
There are several advantages of using quantitative data alongside your qualitative research:
- As quantitative data is less subjective, your analytics can provide facts that are hard to argue with.
- While qualitative research takes time, analytics data is often readily available and gives fast results.
- There’s a unique insight from analytics data, as you’ll have a huge amount of data available to analyze — meaning you can make decisions based on the experience of thousands of users rather than purely relying on speaking to a few users.
- As mentioned, quantitative analytics analysis often combines well with other user research methods to give a rounded picture of the user experience.
- Finally, analytics offers an effective way to present your findings in a way that stakeholders can relate to.
Having established the many advantages to including a quantitative analytical angle in your research process, let’s look at how GA4 differs from the current version of Google Analytics.
How is Google Analytics 4 different from Universal Analytics?
GA4 isn’t just an upgrade on Universal Analytics. It’s a whole different reporting system.
The fundamental differences are covered in the following table.
| Universal Analytics | Google Analytics 4 | |
|---|---|---|
| Reporting model | Session-based, primarily page-views | User, event and action based |
| Platforms covered | Web only | Web and App |
| Cross-device reporting | Limited to large accounts | Used prominently based on Signals |
| Pre-defined reports | Large amount of reports | Limited to basics |
| Custom reporting | Limited options | Lots of flexibility |
| Audience definition | Limited options | Flexibility in defining and segmenting |
| Learning curve | Fairly simple | More complicated! |
The reporting model has changed from essentially just measuring pageviews to including more event-based tracking. Events are a measure of a specific interaction or occurrence on your website or app. For example, you can use an event to measure when someone loads a page, clicks a link, or completes a purchase, or even to measure system behavior, such as when an app crashes or an impression is served. This means that you’re able to better analyze user engagement with your website or app, rather than just seeing which pages they looked at. While event tracking was a part of Universal Analytics, it required manual setup and was generally underutilized.
The fact that Google Analytics 4 natively measures behavior for both websites and apps means you can centralize your analysis and you don’t have to use different tools.
The cross-device reporting is another big benefit. Cross-device tracking is core to GA4. It identifies users based on a User ID, Google Signals and a Client ID. This allows you to see individual users who visit your site from different devices, when previously these people would have been shown as two separate users.
Perhaps the main change, as far as analysts are concerned, is the lack of pre-defined reports. In Universal Analytics you could see the majority of details about your users and their behavior by browsing the reports. In GA4 it’s likely that you’ll need to set up your own reports in the Explore section. (More on this later.)
The principles behind segmenting your users are broadly the same across Universal Analytics and Google Analytics, though there’s more flexibility in Google Analytics 4. The increase in event tracking gives more opportunity to create segments based on specific user behavior.
How to Get Started with Google Analytics 4
GA4 has a steep learning curve. In fact, it might actually be even steeper if you’re already accustomed to using Universal Analytics! It took me a long time to get my head into the basics, so hopefully the tips below will help you shortcut some of the more confusing elements.
Pre-set reports
As mentioned, there are fewer pre-set reports in GA4. The navigation appears in the same place, on the left side of the screen, but there are fewer options. The top-level reporting categories have changed significantly.
| Universal Analytics report categories | Google Analytics 4 report categories |
|---|---|
|
|
While there are now more top-level categories, the options within these have reduced, and you may find it difficult to find some of your old favorite reports!
The navigation within reports has changed too. On first glance, it appears there’s less flexibility, but looking more closely will show that options to search reports and to add secondary dimensions are still available. The stripped-back, minimalist feel of the UI may initially be confusing, but most features are still there if you look for them!
The configuration of pre-set reports in GA4 has changed significantly since its initial launch, and is likely to continue to change over time. I would recommend browsing through what’s available and getting familiar with where the data that’s important to you can be found. The following pre-set reports are those that are most useful for finding out more about your users and their behavior:
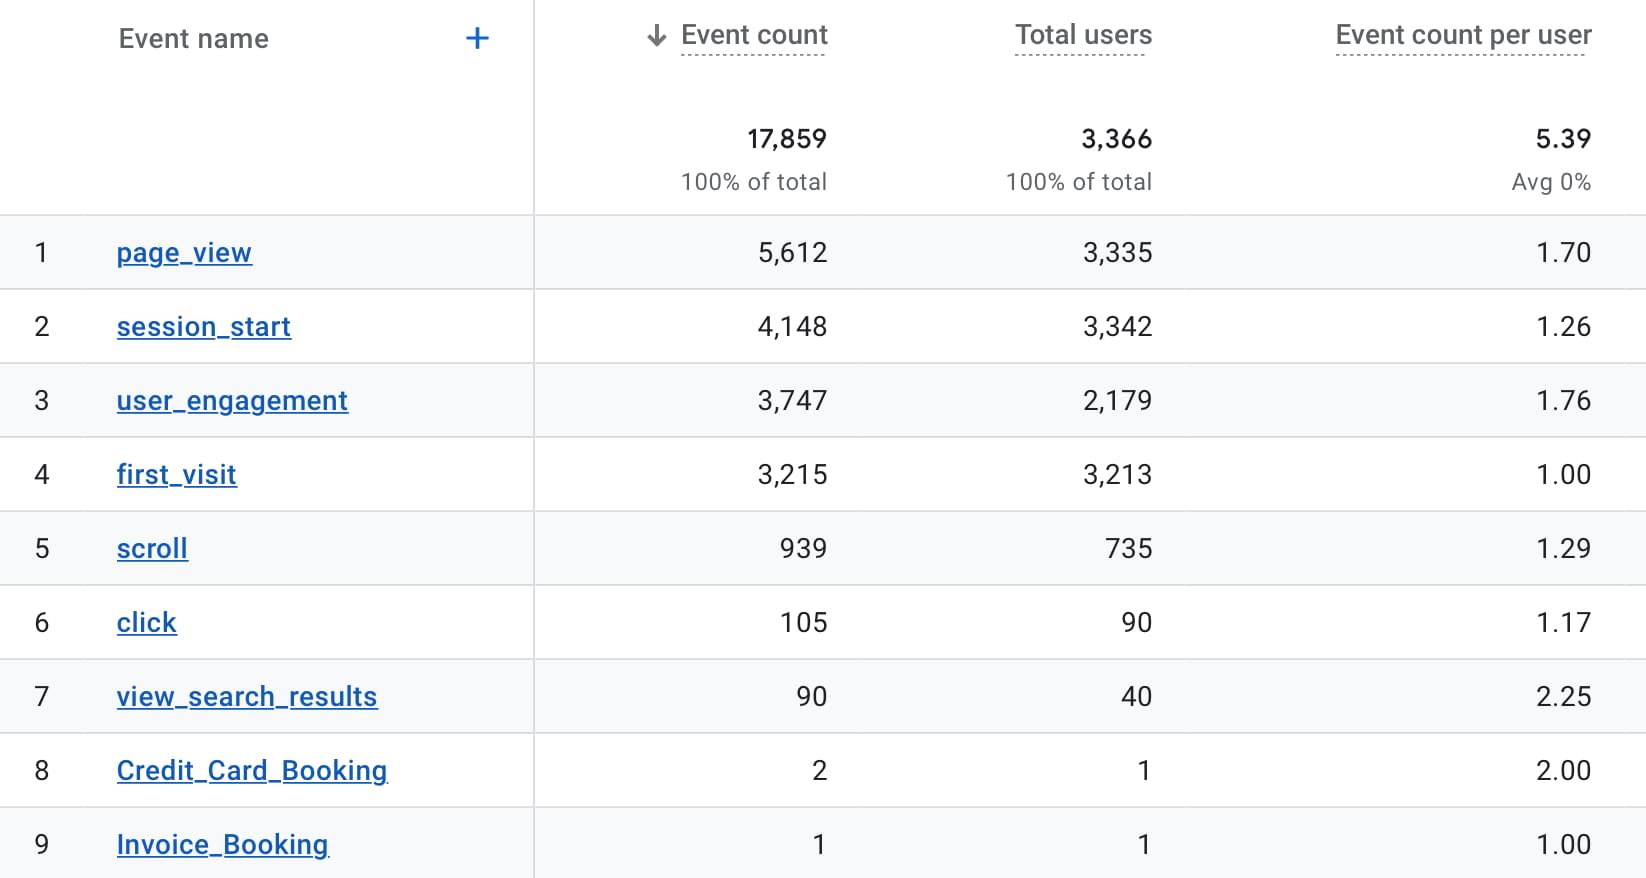
- Events. As covered previously, GA4 uses event-based tracking, and this is where you’ll see details on what users are doing when on your website
- Page and screens. This replaces the All Pages report from Google Analytics and can tell you which pages your users are viewing.
Overall, though, you’re likely to want to use more custom reporting than you’ve been used to with Universal Analytics. That’s where the Explore feature comes in…
Custom reporting (aka Explore)
The Explore section can be found directly below the Reports section. This is where you can set up custom reports on the data that matters to you.
Explore gives you the ability to set up all manner of different types of reports using all the dimensions and metrics that are available in Google Analytics 4. This enables you to really dive into learning more about who your users are and how they’re interacting with your site. Think of Explore as being like the old custom reports, but on steroids.
How to Measure User Behavior with the Explore Feature
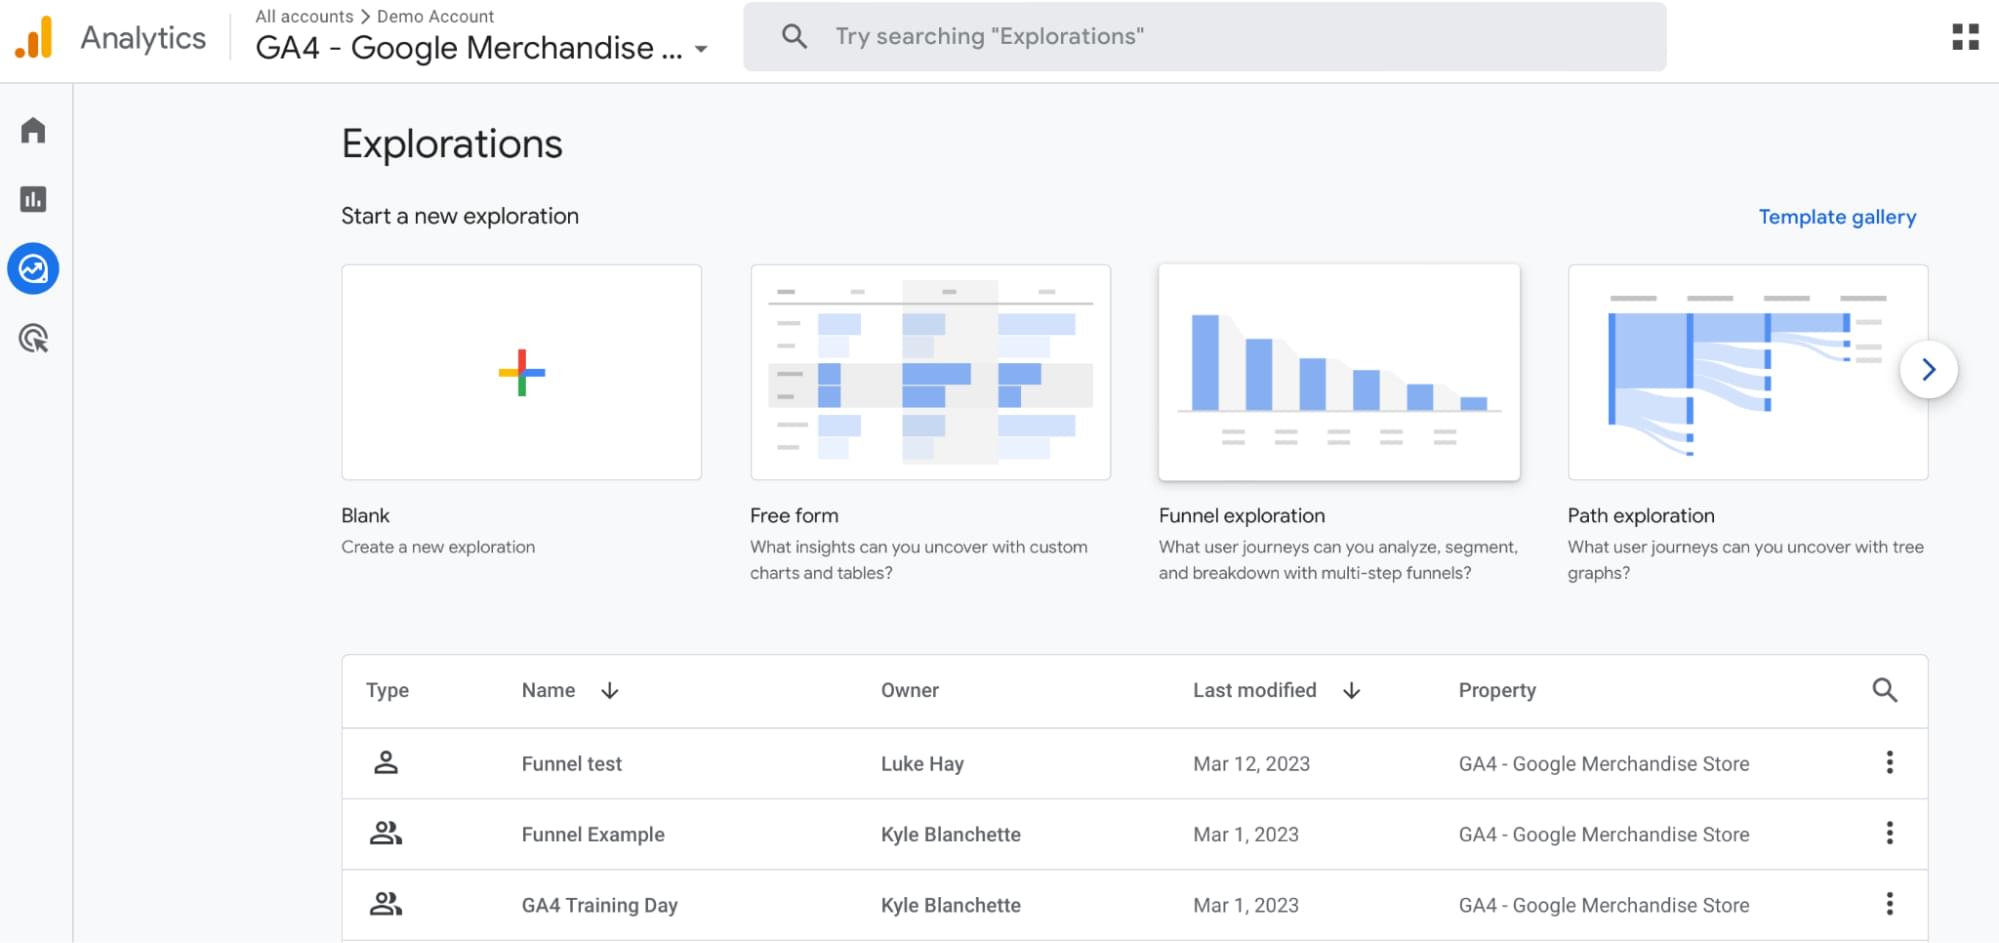
When you first access the Explore feature, it may feel a bit unfamiliar and overwhelming. You’ll have the option to use Free Form, Funnel or Path explorations. These are just different ways of visualizing your data. It’s likely you’ll mainly use Free Form, but the Funnel and Path options can be useful when looking at how users are navigating through your website or app.
Here’s a top-level outline of the three main options, though we’ll also cover these in more detail later:
- Freeform. This allows you to choose combinations of dimensions and metrics in table or graph formats.
- Funnel. This is where you can track where users drop out through a predefined funnel, such as a checkout.
- Path. This allows you to track navigation by viewing user pathways through your website or app.
To start with, though, let’s look at how you can use this reporting feature to find out more about who your users are.
Finding out about your users
An often overlooked area of Google Analytics is how it can be used to find out who your users are. As with Universal Analytics, the following data, which is available in Google Analytics 4, can tell you more about your users:
- Location (continent, country, city)
- Language
- Age
- Gender
- Device ownership
- Browser choice
- Content of interest
- Time of browsing
You’ll need to keep in mind that GA4 requires you to change your settings in order to start collecting demographic data.
Once you’re all set up and ready to go, you can combine the above dimensions with relevant metrics. You might want to see how many older users are visiting your site, or look at which locations are responsible for the most traffic.
Once you’ve got a better idea of who’s using your website or app, you’ll want to consider how they’re interacting and engaging when they’re there.
Engagement and interaction
While knowing the amount and type of traffic is important for better understanding the user experience, you’ll also need to look at how people are engaging with your website. As with Universal Analytics, some of the key metrics to look at here include:
- Engagement time
- Exit rate
- Pages per session
- Bounce rate
It’s important to note that the bounce rate metric has been changed in GA4. In Universal Analytics, Bounce Rate is the percentage of people who leave your web page without interacting with it. In Google Analytics 4, Bounce Rate is now the percentage of sessions that weren’t engaged sessions. Engaged sessions are a new metric in GA4, describing a visit that lasts more than ten seconds or includes a conversion.
You can combine these metrics with a range of dimensions to understand more about your users’ behavior, and to help spot potential problem areas. Some starting points for identifying potential problem areas include:
- pages/screens with a high exit rate
- time spent on pages, either longer or shorter than expected, which can indicate issues
- low engagement rates for dimensions such as device type or country
- navigational issues, such as high drop-outs in funnels
- any outlying engagement metrics for specific demographic groups
Another important area for measuring engagement is Events. Interactions in Google Analytics 4 are counted as Events, and these include things like scrolling and clicking within pages.
Perhaps the most key consideration for analyzing user behavior in GA4 are Conversion Events. These are the Events that you have marked as being the most important and are a replacement for Goals in Google Analytics. Examples of conversion events could be someone downloading a key resource, completing a form, or taking another notable action while using your website or app. You can specify which of your events are Conversion Events within the Admin area of GA4.
Navigation and user journeys
Tracking user journeys through your site or app is key to understanding the overall user experience. This will help you to spot how people are navigating, and can also help to identify where there may be navigational issues.
There are two options within the Explore area that are useful for analyzing user journeys:
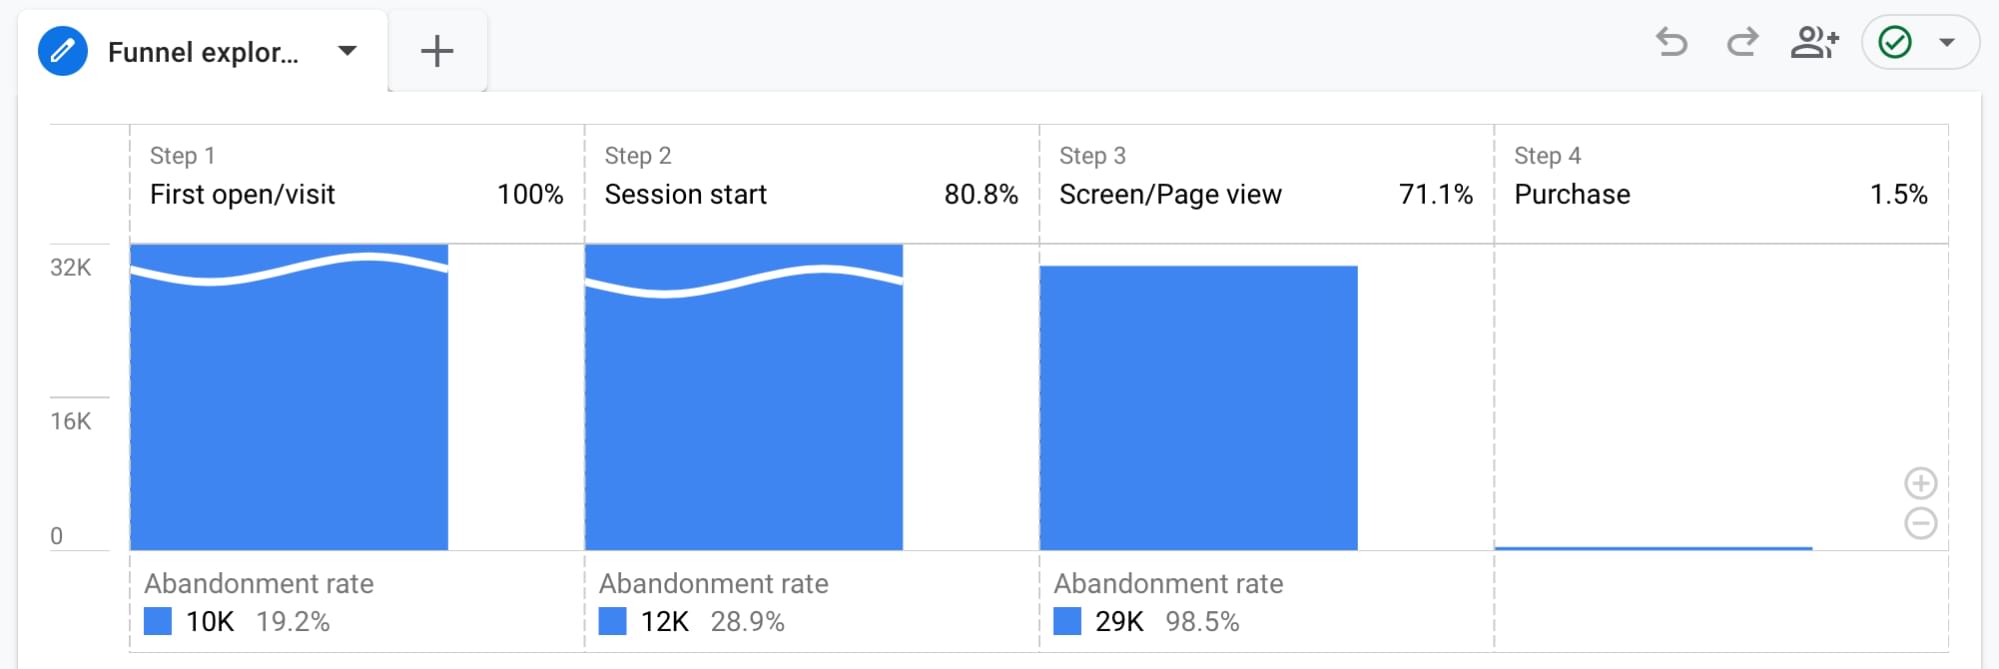
- Funnel exploration. This lets you visualize the steps your users take to complete a task and quickly see how well they’re succeeding or failing at each step.
 )
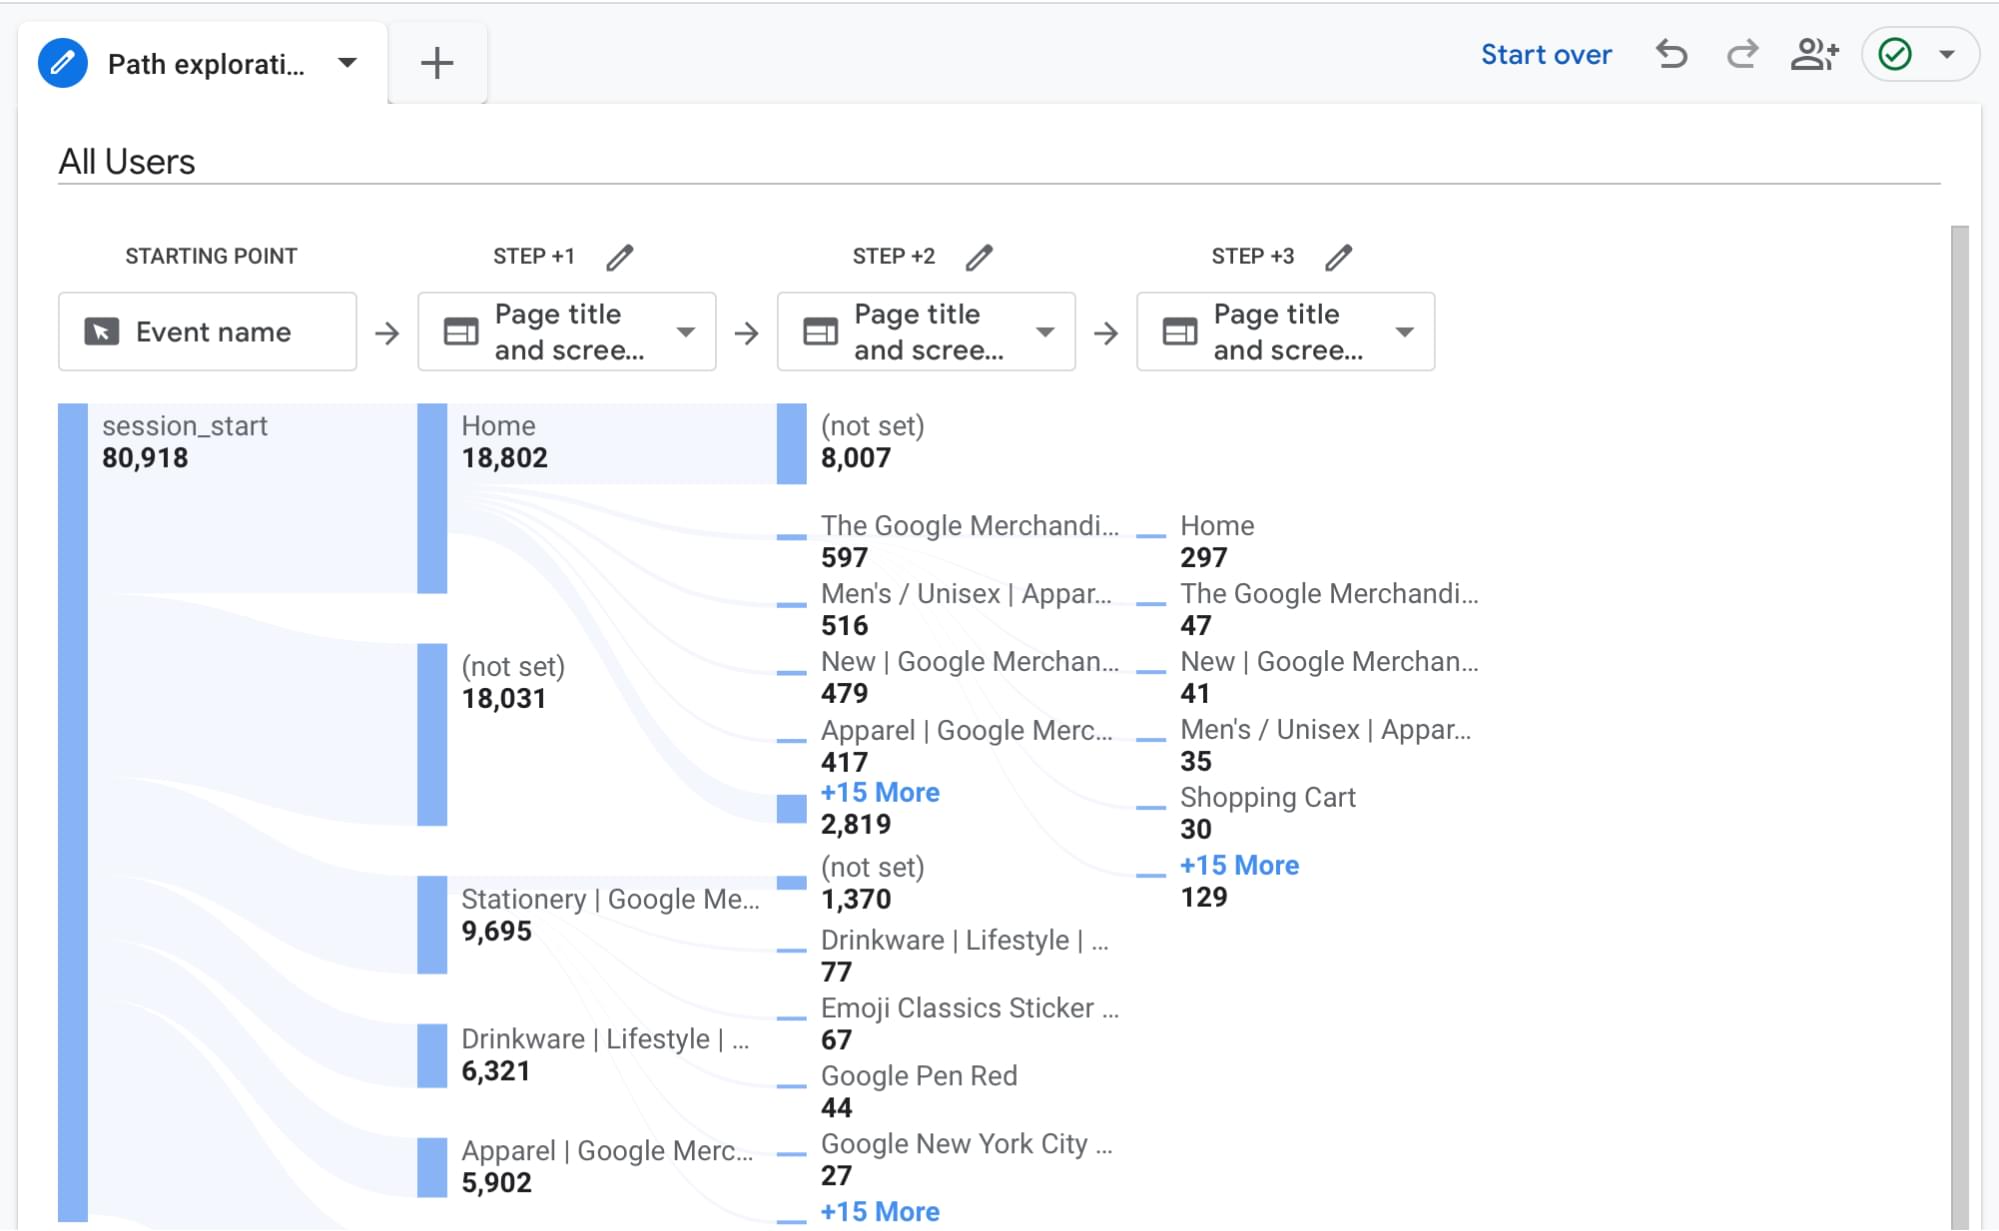
) - Path exploration. This is similar to funnel exploration, but allows you more freeform analysis of user journeys.
You should use Funnel exploration to cover predetermined linear paths, such as an ecommerce checkout. This can help you understand which steps of the process might be causing issues — and which you can then investigate with more qualitative research methods.
Path Exploration is useful for getting a broader view of navigation across your website. It takes elements of the User Flow reports from Universal Analytics but allows more customization and flexibility.
Finally, to better understand user navigation you’ll also want to look at Site Search data. This works in a similar way to Universal Analytics, though you’ll want to check your setup to ensure it’s working correctly. Site search will tell you how many people are using your internal search functionality, and also what search terms they’re using.
Conclusion
Whether you like it or not, Google Analytics — in its Universal Analytics form, as we’ve known it for a long time — will cease to exist soon. Your options are either to stop using analytics data, find an alternative analytics provider, or to get your head into Google Analytics 4 and work out how it can help you understand more about your users and their behavior.
I recommend biting the bullet and diving into GA4. Once you get stuck into the Explore feature, you should be able to create reports quite quickly, which will give you a solid foundation for learning more about your users and their behavior.
Don’t stop using quantitative analytics as part of your user research process. Learn how to use Google Analytics 4 so you can develop a deeper understanding of your users’ experience.
Frequently Asked Questions (FAQs) about Google Analytics 4
What are the key differences between Google Analytics 4 and Universal Analytics?
Google Analytics 4 (GA4) is a more advanced version of the previous Universal Analytics (UA). GA4 is designed to provide more insightful and integrated data analysis. It uses an event-based tracking system, unlike UA which uses session-based tracking. This means GA4 can track and analyze user interactions more accurately. GA4 also offers cross-platform tracking, allowing you to track user behavior across multiple devices and platforms. It also includes AI-powered insights and predictions, enhanced privacy features, and more flexible reporting.
How does Google Analytics 4 handle user privacy?
GA4 has been designed with privacy at its core. It includes features like data deletion requests and consent mode, which help businesses comply with data privacy regulations. GA4 also uses advanced machine learning models to fill in the gaps where user data is incomplete due to privacy restrictions.
Can I use Google Analytics 4 and Universal Analytics simultaneously?
Yes, you can use both GA4 and UA simultaneously on your website. This is actually recommended by Google during the transition period. This way, you can start collecting data with GA4 while still having access to your UA data.
How does the event-based tracking in Google Analytics 4 work?
GA4’s event-based tracking system allows you to track specific interactions users have with your website or app. These can be anything from page views to button clicks. You can also set up custom events to track specific actions that are unique to your business.
What are the AI-powered insights in Google Analytics 4?
GA4 uses advanced machine learning models to provide predictive insights. These can help you anticipate future actions your customers might take. For example, it can predict churn probability or the potential revenue you could earn from a particular group of customers.
How does cross-platform tracking work in Google Analytics 4?
GA4 allows you to track user behavior across multiple devices and platforms. This means you can track a user’s journey from their first interaction with your website on their mobile device, to their final purchase on their desktop.
How can I set up Google Analytics 4?
Setting up GA4 involves creating a new property in your Google Analytics account, installing the GA4 tracking code on your website, and configuring your event tracking. Google provides detailed guides on how to do this.
What are the reporting features in Google Analytics 4?
GA4 offers more flexible and customizable reporting than UA. You can create custom reports based on the metrics and dimensions that matter most to your business. GA4 also includes new reports like the Analysis Hub and the Life Cycle report.
How does Google Analytics 4 handle data deletion requests?
GA4 includes a data deletion request feature. This allows you to delete specific user data from your reports, helping you comply with data privacy regulations.
What is the consent mode in Google Analytics 4?
Consent mode is a feature in GA4 that allows you to adjust how Google Analytics behaves based on the consent status of your users. This helps you comply with data privacy regulations like GDPR and CCPA.
Luke Hay is a UK-based UX Consultant who’s been working with websites since the 1990s. He prides himself on taking a user-centric, analytical approach to design, development and optimization of websites and apps. Luke currently splits his time between working as the Senior User Researcher at digital transformation agency Clearleft, and as a freelance UX and analytics consultant and trainer. Always involved in his local digital community, Luke has helped organize and curate events for UX Brighton, and is one of the organizers of UX Camp Brighton.

