
Key Takeaways
- Jenkins, an open-source automation server, is instrumental in PHP projects for continuous integration and delivery, allowing for real-time bug detection and resolution, as well as continuous feedback for code quality improvement.
- Jenkins works with a variety of tools for PHP projects, including PHP CodeSniffer, PHP MD, PHP CPD, PHP Depend, PHPLOC, PHPUnit, and PHPDox, each providing unique insights and metrics for code analysis.
- The strength of Jenkins lies in its ability to generate graphs and overviews that represent issues more effectively than command line retrieval, making it easier to identify and address problems in the code.
- In addition to the tools set up, Jenkins collects other information such as an overview of PHP CodeSniffer, PHP MD, and PHP CPD violations, and a ‘changes’ overview showing all commits made between builds.
The results of Jenkins come from different tools and will be placed in different locations within the Jenkins GUI. We will be navigating through two different pages. First we have the project view page, which is recognizable by the project name at the top. On this page, you get a general overview of the project and you can easily compare several builds. You can reach this page by clicking on the project from the default overview page. Next to the project view page, we also have the build view page. You can navigate to this page by clicking on a build number in the sidebar. Here, you will be able to view all kinds of details regarding this particular build.
Within this article, we will be going through each tool and have a look at what it reports back to us. In the end, we will also look at some extra details Jenkins collects for us. Since we build the same project several times, we will get straight lines within our graphs. In a real project, the graph would fluctuate.
PHP CodeSniffer
CodeSniffer is a tool which checks if your code is compliant with a general ruleset or your own custom ruleset. In our case, we configured that we would like to test our tool against PSR2. We defined this in the build.xml file.
<arg value="--standard=PSR2" />
On the overview page, you will see a graph named ‘Checkstyle Trend’. This graph represents the number of PRS2 issues in every build. In our code, we almost completely complied to the PSR2 standard, so our graph only shows one.
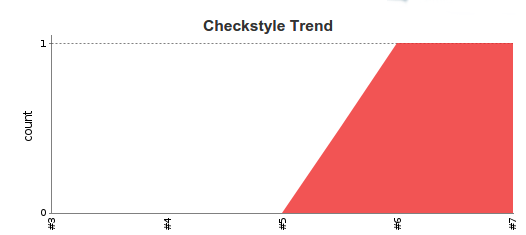
There is an additional graph lower on the page combining the data from 3 tools. CodeSniffer is one of them.
To see where the issue is located, you can either click on ‘checkstyle warnings’ in the left side menu for the latest build, or click on a particular build and then click on ‘checkstyle warnings’ for that particular build.
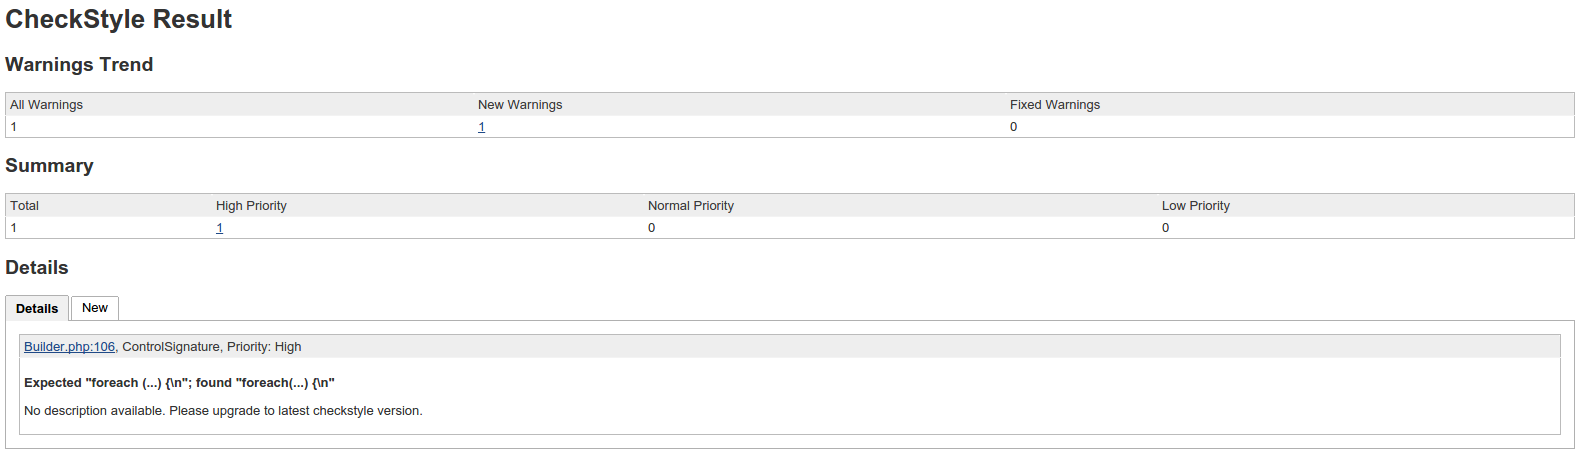
On this page, you can clearly see a description of the issue. Note that you have several filters available. In the top bar, you can clearly see how many issues are new and how many are fixed. You can click the number to get a clear view of the changes. In the summary, you can quickly see the issues categorized by priority.
PHP MD
MD stands for Mess Detector. This tool tries to indicate several problems within your code. This can be potential bugs, unused code or complicated methods. For the complete list of checks available, you can take a look at this page. Note that we aren’t checking for every single rule. You can define which rules you want to check for in the phpmd.xml file.
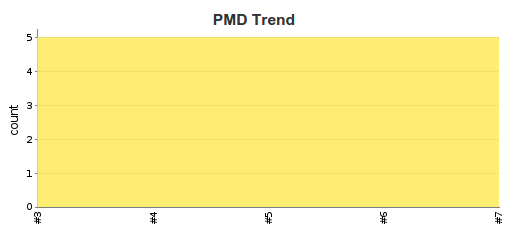
As with PHP CodeSniffer, we see a graph on the project view page which indicates how our mess detection is progressing over time.
To figure out what is going wrong, you can click on ‘pmd warnings’ in the left side menu to go to the latest build. If you prefer to view a different build, click on a build and then choose ‘pmd warnings’. You will end up on a page which is similar to the PHP CodeSniffer page.
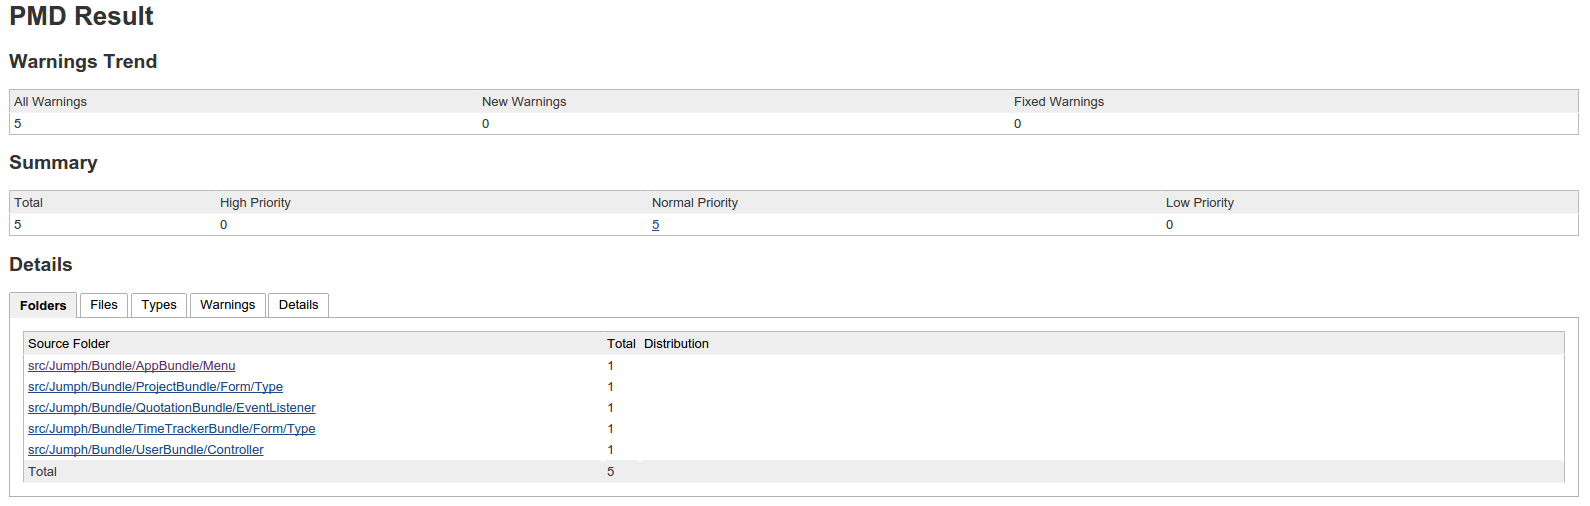
At the top, you can again see how many issues are new and how many are fixed. Next to that you also see the priority of each issue.
In the details page, you get more information about where you can locate the issue. There are many tabs available to give the same information in a different way. For example, you can click on ‘types’ to find out more about each type.
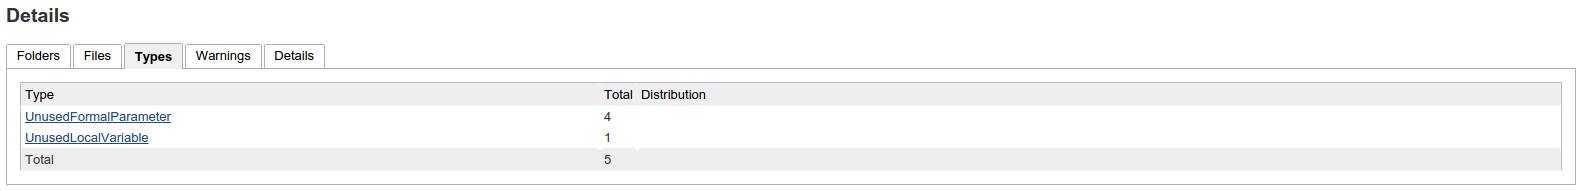
As you can see, the ‘UnusedFormalParameter’ is our biggest problem. By clicking it, we will once again see which files got an unused parameter.
PHP CPD
CPD stands for Copy Paste Detector. This tool will analyze all your code and look for multiple duplicate lines. If you have lots of duplicate lines, it could mean you should rewrite some parts so the logic is shared between multiple classes. Once again on the project view page, we will see the overall progress in all builds.
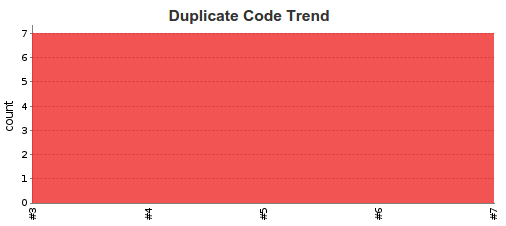
In the left side menu, we can click ‘duplicate code’ to get an overview of the problems found. As before, click on a build to get more information regarding that build. You will notice the overview looks similar like the previous pages. Let’s click on the details tab to get some more information.
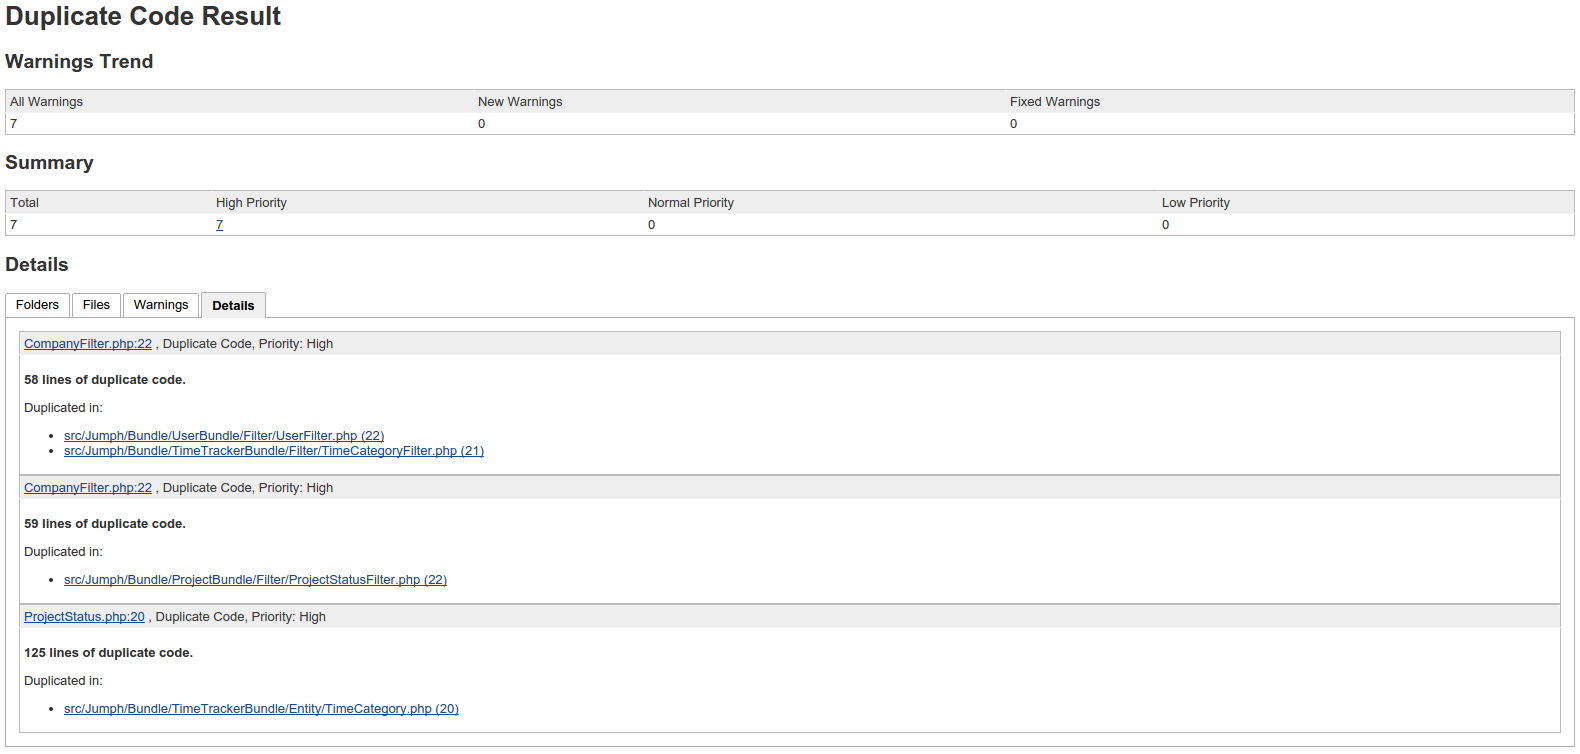
As you can see, there are 58 lines in the CompanyFilter class which are also in the UserFilter and TimeCategoryFilter class. Based on this data, you could decide that you are in need of some kind of BaseFilter which handles most parts for all 3 classes or implement a service. The solution depends on your case, PHP CPD just tells you where it found an issue.
PHP Depend
PHP Depend is probably the metric that’s hardest to understand. PHP Depend performs a static code analysis on your code base. It results in 2 images and an overview page. Perhaps you noticed that at the top of the project view page, there is some HTML which should display an image.
The fact that the images are not shown means you have to flip a switch in Jenkins’ configuration. Go to ‘manage jenkins’ and head to ‘Configure Global Security’. There is a select box with which you can configure the ‘markup formatter’. Set this to ‘Safe HTML’ and save your settings. If you now return to the project view page, you will notice the HTML is converted to two images.
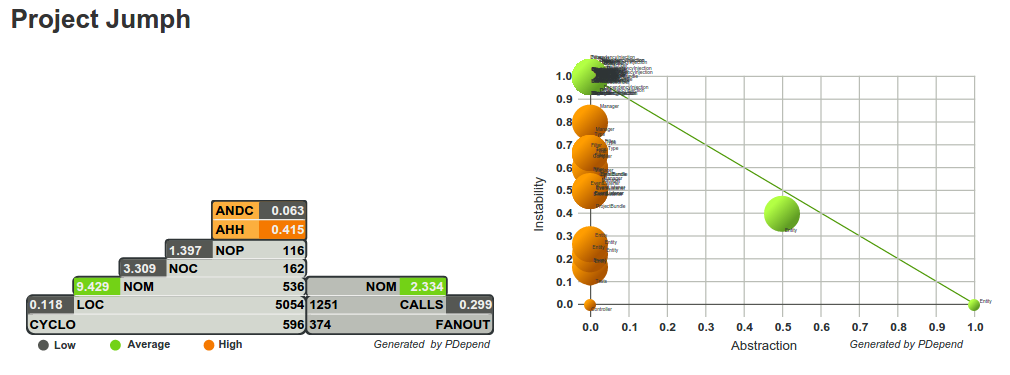
I suggest you read the official documentation of this tool to fully understand both graphs. For more information about the pyramid, you can check this link. For the abstraction instability chart you can check this link.
You can get more details by clicking on a specific build and then choosing ‘JDepend’ in the left side menu. You will get an overview like this.
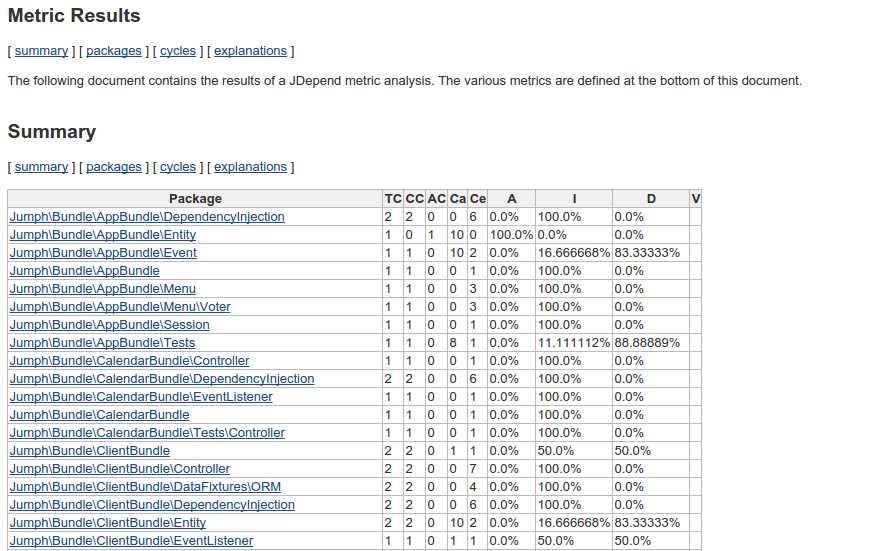
The explanation of this page is also rather big and complex, so I refer you to the official documentation in which everything is explained.
PHPLOC
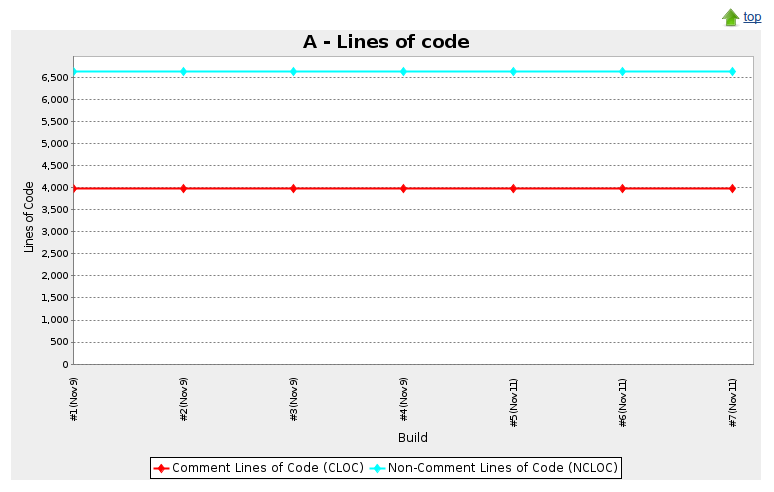
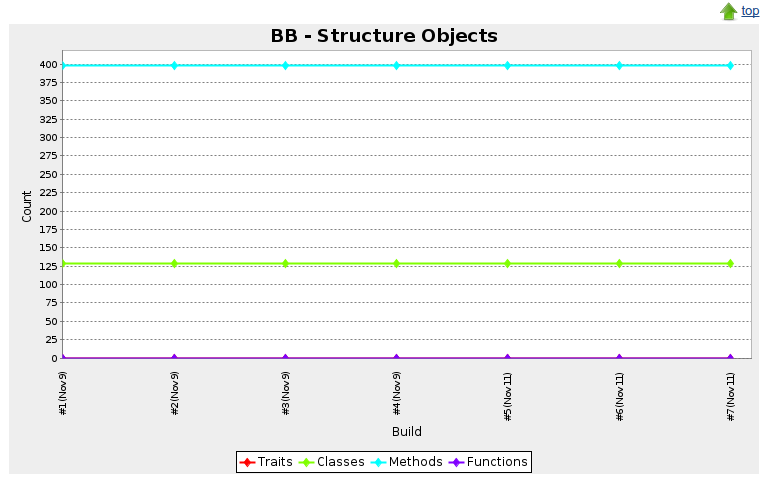
PHPLOC is a tool to quickly measure your project size. It shows you the total number of lines of code, the total number of static methods, etc. In the left side menu, you can click ‘plots’ to get the results of this tool. You have 11 plots at your disposal in which you can find this information. Below, you will see a screenshot of the plot which indicates the total lines of code and comments and the total amount of methods, classes, traits and functions.
PHPUnit
A big amount of statistics within Jenkins is generated by PHPUnit. On the overview alone, you will see 3 graphs generated by data coming from PHPUnit.
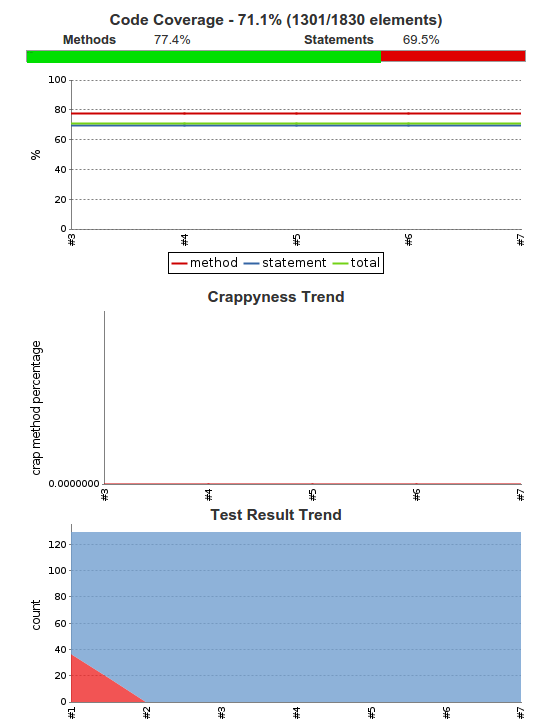
The first graph indicates how much of the code is covered with tests. In our case, 71.1%. To generate this coverage, xdebug is used in the background.
The second graph indicates your CRAP level. CRAP stands for Change Risk Analysis and Predictions. CRAP is calculated by checking the complexity of your code in combination with the amount of tests performed on the code. If you skimmed through the PHP MD rules, you might have noticed that PHP MD is also capable of checking the complexity of your code, but doesn’t take the unit tests in consideration. Read here to see how PHP MD calculates your complexity.
The final graph shows you how many tests succeeded and how many failed. In our case, they all succeeded.
In our left side bar menu, we have 2 items which are generated by PHPUnit. The first one is Crap. On this page you can see an overview of several graphs which indicate how high your current CRAP level is. At the bottom, you will actually see which methods are marked as CRAP. You will notice a column indicating the coverage and complexity.
The second menu item is ‘clover HTML report’. Within this page, you can get an overview per directory how much is covered by your unit tests.
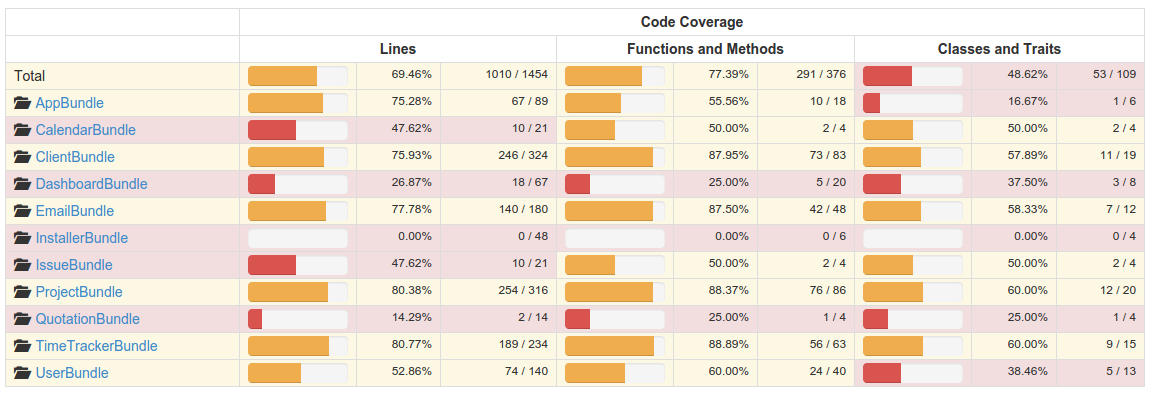
You can click on a directory to dive deeper into your source. If you reach a file, you can open up that file and see per line how much is covered. With colors, it’s indicated which parts are being tested and which are not. Hovering over a line indicates how many times this line has been called by your unit tests.
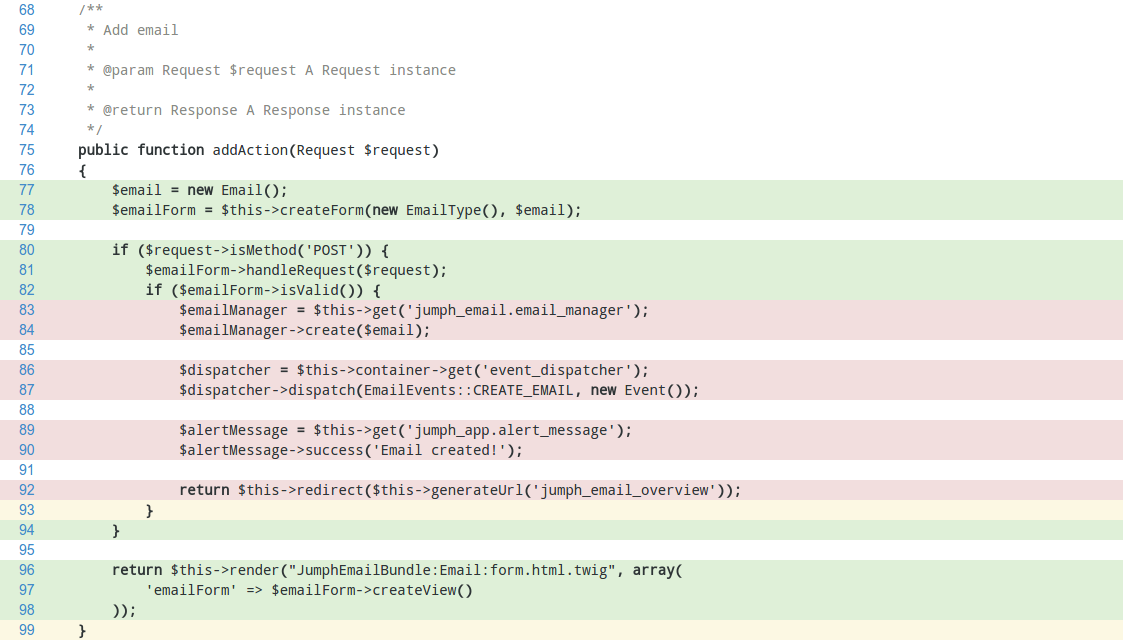
In our case we can clearly see that the part within the if statement is not called by a unit test. This is correct in our case. Only a GET request is performed on this method and not a POST request. If we implement a POST request in our unit test, this if statement will be marked green. This way you can easily spot any missing parts in your unit tests.
PHPDox
There are many tools that generate documentation based on your code and comments. PHPDox is just another tool which can perform this task for you. In the left side menu you can click on ‘API Documentation’ to go to your documentation. The nice thing about PHPDox is that it also includes the results of all the other tools.
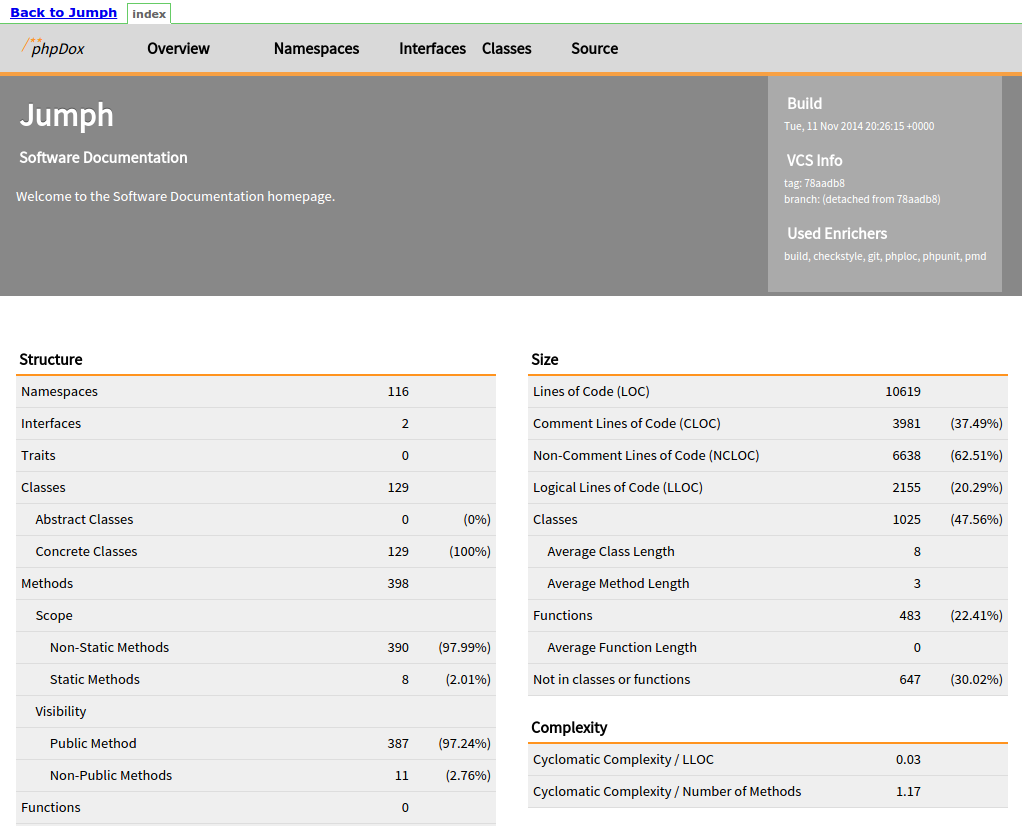
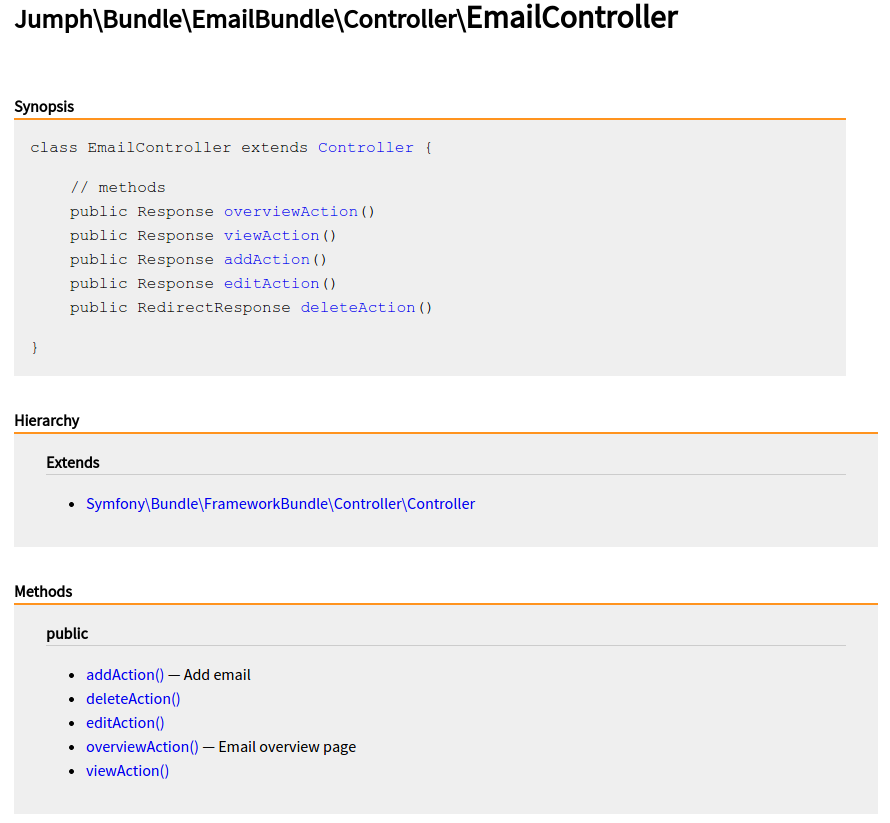
Through the navigation at the top, you can get an overview of all classes, but you can also dive deeper into a class and get an overview of all methods and descriptions. You can also view the history and the source of the file.
Other pages
Next to the tools we set up during the previous articles, Jenkins also collects other information for you. The violations plugin we installed creates an additional page which shows an overview of PHP CodeSniffer, PHP MD and PHP CPD.
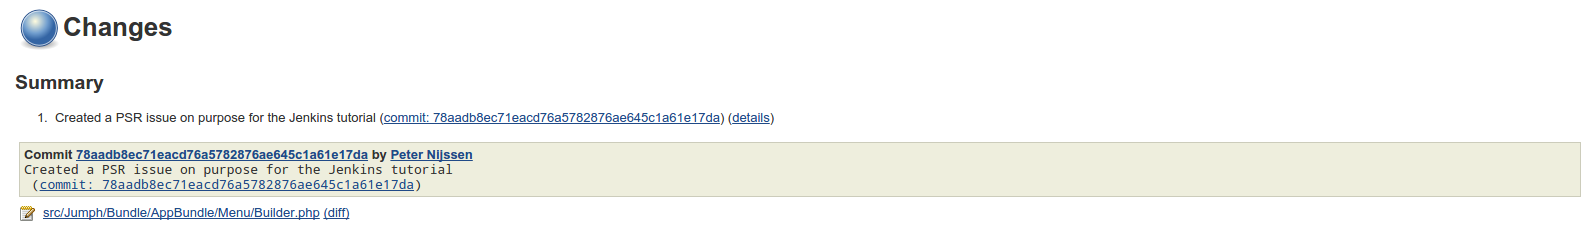
You can also click on a specific build and find a menu item named ‘changes’ in the left side menu. If you go to this page, you will see an overview of all commits made between the previous build and this build. If no changes were made of course, the page will just be blank.
Conclusion
In this article, we took a close look at the kind of metrics we get back from all the tools. All the information you retrieved can also be retrieved on the command line. The strength of Jenkins is that you can create graphs and overviews which better represent the issues.
In the final part, we will be swapping out some tools and adding some additional metrics. We will also take a look at how we can analyze our CSS, JavaScript and HTML code.
Frequently Asked Questions (FAQs) about Analyzing PHP Projects with Jenkins
What is Jenkins and why is it important in PHP projects?
Jenkins is an open-source automation server that enables developers to build, test, and deploy their software. It is particularly important in PHP projects because it allows for continuous integration and continuous delivery, ensuring that the code is always in a deployable state. Jenkins can compile and test your code, making it easier to discover and solve bugs quickly and efficiently. It also allows for continuous feedback, which is crucial for improving the quality of the code.
How do I install and configure Jenkins for my PHP project?
To install Jenkins, you need to download the latest stable Jenkins WAR file for Windows, Linux, macOS, or Docker. After downloading, you can run it using the command “java -jar jenkins.war”. For configuration, you need to install necessary plugins like Git, Maven, and PHP. Then, you can create a new job, select the ‘Freestyle project’ option, and configure it according to your project requirements.
What are the benefits of using Jenkins in PHP projects?
Jenkins offers several benefits for PHP projects. It automates the process of integration, testing, and deployment, reducing the time and effort required. It helps in identifying and fixing bugs early in the development cycle, improving the quality of the software. It also provides continuous feedback, which is crucial for making improvements and ensuring that the code is always in a deployable state.
How does Jenkins work with PHP Unit for testing?
Jenkins can be integrated with PHP Unit, a popular testing framework for PHP. Once integrated, Jenkins can automatically run the PHP Unit tests whenever a change is made to the code. This ensures that any new changes do not break the existing functionality. The results of the tests are then displayed in the Jenkins dashboard, making it easy to identify and fix any failed tests.
How can I troubleshoot common errors when using Jenkins with PHP?
Common errors when using Jenkins with PHP can be due to configuration issues, plugin problems, or compatibility issues. To troubleshoot, check the error logs in Jenkins, which can provide detailed information about the error. Also, ensure that all the plugins are up-to-date and compatible with your version of Jenkins. If the problem persists, you can seek help from the Jenkins community or consult online resources.
Can Jenkins be used for large-scale PHP projects?
Yes, Jenkins is highly scalable and can be used for large-scale PHP projects. It can handle multiple builds and tests simultaneously, making it ideal for large projects with a high volume of code. Additionally, Jenkins supports distributed builds, allowing you to distribute the build and test load to multiple machines.
How does Jenkins improve the efficiency of a PHP development team?
Jenkins improves the efficiency of a PHP development team by automating the build, test, and deployment processes. This reduces the time and effort required by the team, allowing them to focus on coding rather than managing these processes manually. Jenkins also provides continuous feedback, helping the team to improve the quality of their code and make necessary changes quickly.
What are some best practices for using Jenkins with PHP?
Some best practices for using Jenkins with PHP include keeping your Jenkins and plugins up-to-date, using a version control system like Git, configuring Jenkins to run tests automatically after each commit, and using the PHP CodeSniffer plugin to ensure that your code adheres to coding standards.
Can Jenkins be integrated with other tools used in PHP development?
Yes, Jenkins can be integrated with a wide range of tools used in PHP development, including version control systems like Git and SVN, build tools like Ant and Maven, and testing frameworks like PHPUnit and Behat. This makes Jenkins a versatile tool that can fit into almost any PHP development workflow.
How secure is Jenkins for PHP projects?
Jenkins is designed with security in mind and provides several features to help protect your PHP projects. These include the ability to restrict access to Jenkins, encrypt sensitive data, and audit log activity. However, like any tool, it’s important to keep Jenkins and its plugins up-to-date to protect against any potential security vulnerabilities.