

Chrome DevTools incorporates many sub-tools for debugging web applications on the client side — like recording performance profiles and inspecting animations — most of which you’ve likely been using since your early days of learning web development, mostly through the DevTools console.
Let’s look at some of those tools, focusing particularly on the console and the performance metrics.
To access Chrome’s DevTools:
- right click anywhere on a page, click Inspect from the context menu
- use the keyboard shortcuts
Ctrl + Shift + Ion Windows and Linux systems orAlt + Command + Ion macOS - use the keyboard shortcuts
Ctrl + Shift + Jon Windows and Linux systems orAlt + Command + Jon macOS.
Key Takeaways
- Utilize the Snippets Tool for Efficient JavaScript Coding: Instead of writing multi-line code directly in the console, use the Snippets tool in the Sources panel for a more efficient coding experience, allowing for execution within the current page context and code preservation for future use.
- Master the Console for Interactive Page Analysis: Learn to interact with web pages using the console to query and manipulate the DOM, monitor performance metrics, and execute JavaScript, enhancing debugging and development efficiency.
- Preserve and Manage Console History Effectively: Use commands and settings within the console to clear, preserve, or save the history, ensuring a streamlined workflow and easier debugging process.
- Optimize Performance with the DevTools Performance Tab: Record and analyze runtime and load-time performance to identify and address bottlenecks, using features like network throttling and CPU profiling to simulate different environments and optimize responsiveness.
- Leverage Advanced Console Features for In-depth Debugging: Utilize methods like `console.assert()`, `console.count()`, and `console.group()` to refine debugging, making error identification and logging more intuitive and organized.
- Conduct Comprehensive Audits with the Audits Tab: Use the integrated Lighthouse tool in the Audits tab to perform checks on performance, accessibility, and adherence to best practices, providing actionable insights and optimization recommendations.
The Snippets Tool
If you’re frequently writing JavaScript code right in the console, make sure to use the Snippets feature of DevTools instead, which is similar to a code editor and provides mechanisms to write JavaScript code snippets, run them in the context of the current page and save them for later. It’s better than writing multi-line JavaScript code directly in the console.
You can access the Snippets tool from the Sources panel. Once open, the console gets stacked below (if it doesn’t, just press Escape) so you can write, run your code and see the console output at the same time.
Using the Chrome DevTools Console
You can use the console to interact with any web page using JavaScript. You can query and change the DOM and query/output different types of performance information.
The console can be opened either as a full-screen dedicated panel or as a drawer next to any other DevTools panel by pressing Escape while DevTools is open and has focus.
When working with the browser’s console, if you want to enter multi-line expressions you need to use Shift + Enter, because just Enter will execute what’s in the input line at that moment.
The console history
You can clear the console history in different ways:
- by typing
clear()in the console - by calling
console.clear()method in the console or JavaScript code - by clicking on the red circle in the top left corner of the console
- by pressing
CTRL+Lin macOS, Windows and Linux - by right-clicking in the Console and then pressing Clear console.
You can preserve the log (by enabling the Preserve log checkbox) between page refreshes or changes until you clear the console or close the tab.
You can save the history in the Console as a text file by right-clicking in the console and selecting Save as…, then choosing the location of a log file.
Console variables
The variables you create in the Console are persisted until you do a page refresh, so pay attention to when you’re using keywords such as let or const when declaring variables. Running the same code or function for the second time will throw an Uncaught SyntaxError, saying that the identifier has already been declared. You can either use the OR (||) operator to check if the variable is already defined or you can use var to declare variables, since it doesn’t complain for previously declared variables.
Store as global variable feature
If you’re logging objects to the console from your code, you may want to reference these variables from the console so you can check their values. Instead of searching through the console lines, let the console do that for you. There are some built-in ways you can reference these objects.
You can use $_, which references the last object that was returned in the console.
Another way is to use Store as global variable (right-click menu option) with any object that’s logged to the console or returned from a function to turn it into a global variable. Your newly created global variable will be called temp1. If you store more variables as global, they’ll be called temp2, temp3, and so on.
Logging with console.log()
When building complex, client-side web applications, it’s preferable to use the debugging tools provided by the browser, which can help developers figure out what’s happening at the code level without interfering with the actual user interface of the application (that is, using alert and message boxes to debug errors).
Once you have the DevTools Console open, try to log a simple statement:
console.log("hello console");
The console.log() method can take many parameters and format specifiers.
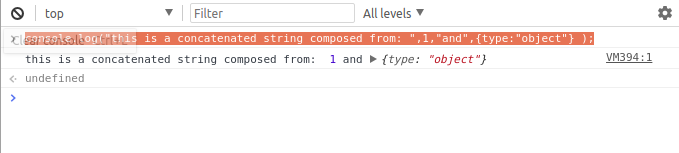
You can pass strings and other types of JavaScript variables, separated by commas, which will concatenate them into a single string with spaces in place of commas.
console.log("this is a concatenated string composed from: ",1,"and",{type:"object"} );
You can also add format specifiers:
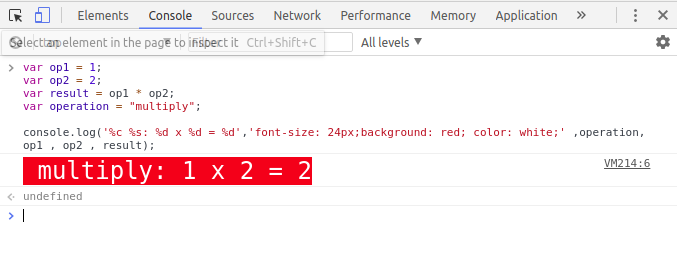
%s: specify placeholders for strings%d: specify placeholders for numbers%i: specify placeholders for integers%f: specify placeholders for floats%o: specify placeholders for DOM elements%O: specify placeholders for JavaScript objects%c: specify CSS styles to format the console output
var op1 = 1;
var op2 = 2;
var result = op1 * op2;
var operation = "multiply";

console.log('%c %s: %d x %d = %d','font-size: 24px;background: red; color: white;' ,operation, op1 , op2 , result);
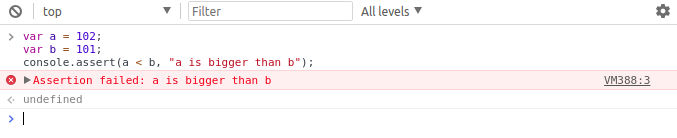
Asserting with console.assert()
console.assert() evaluates the first parameter, which is a boolean expression, and logs the second parameter if the expression fails (evaluates to false):
var a = 102;
var b = 101;
console.assert(a < b, "a is bigger than b");
Counting executions with console.count()
The console.count(label) outputs how many times it has been invoked at the same line and with the same label.
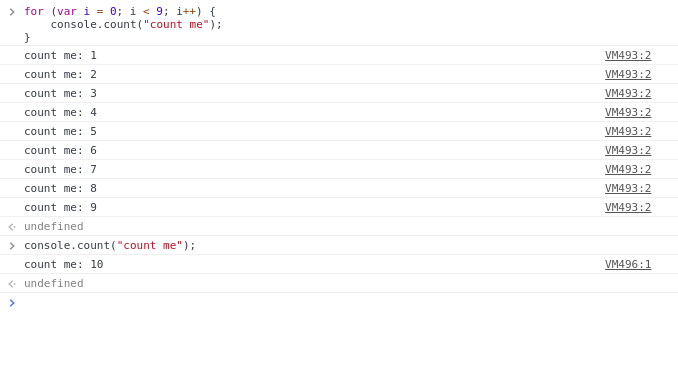
You can see from the screenshot that, when the same statement is passed to console.count(), the count is incremented by one.
It can be very helpful if you need to keep track of how many times a function has been called or inside loops.
Let’s see another example:
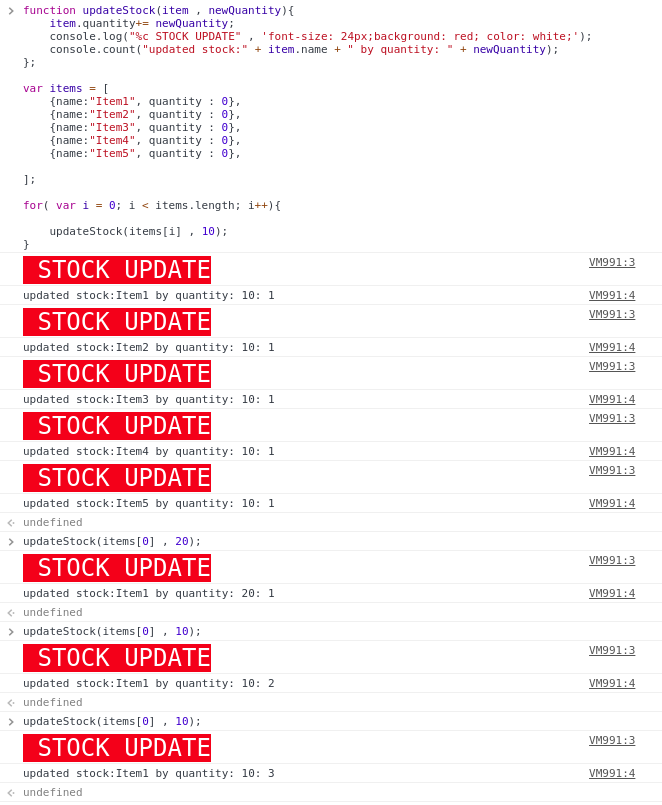
These simple tweaks can save you a lot of time when debugging your application and trying to spot the output of some function, especially if your console is full of logging statements.
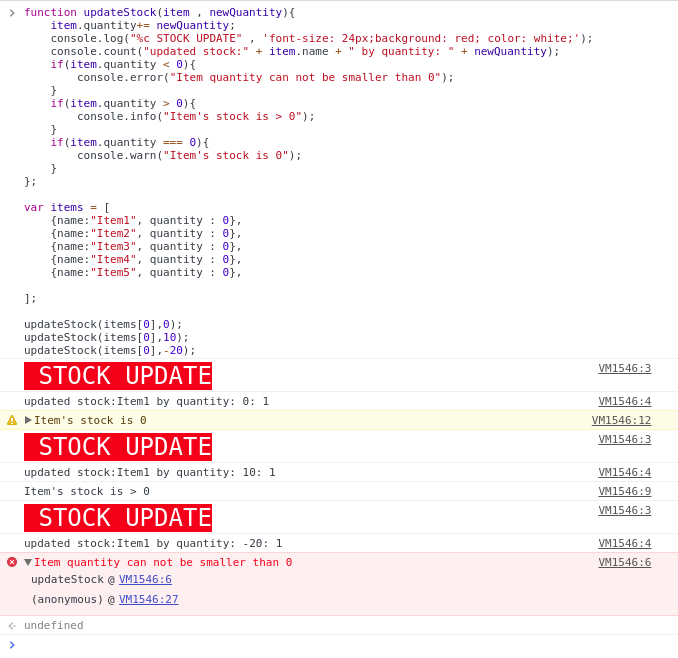
Flagging the Console’s output with console.error(), console.info() and console.warn()
The console.error(), console.warn() and console.info() methods are similar to console.log(). They can be used to log information to the browser’s console, with some differences:
console.error()flags the output as an error on the Console and prints the error stack.console.warn()flags the output as a warning.console.info()flags the output as info.
Adding flags to the console output is very helpful, as the Console provides a way to only show messages with a specified flag.
Filtering the Console log
Using the previous methods enables you to filter the Console output by severity level.
You can also filter the output by text.
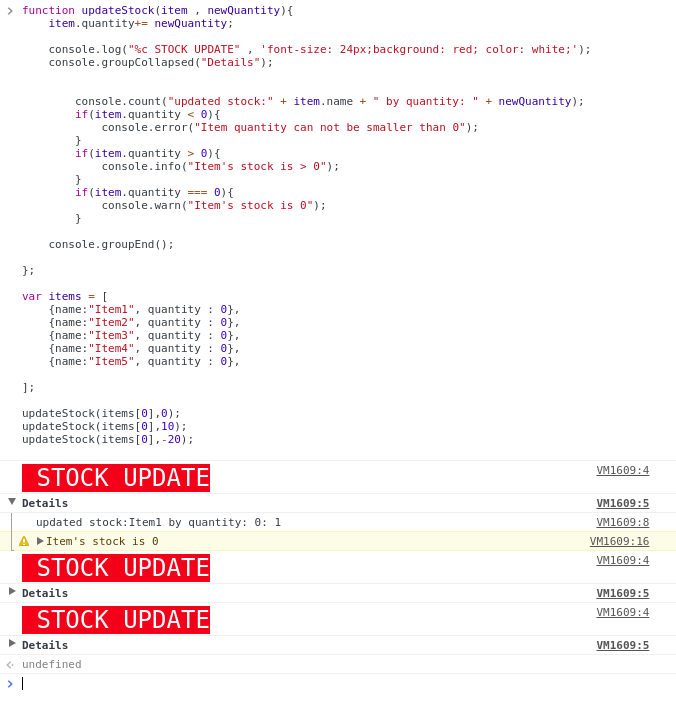
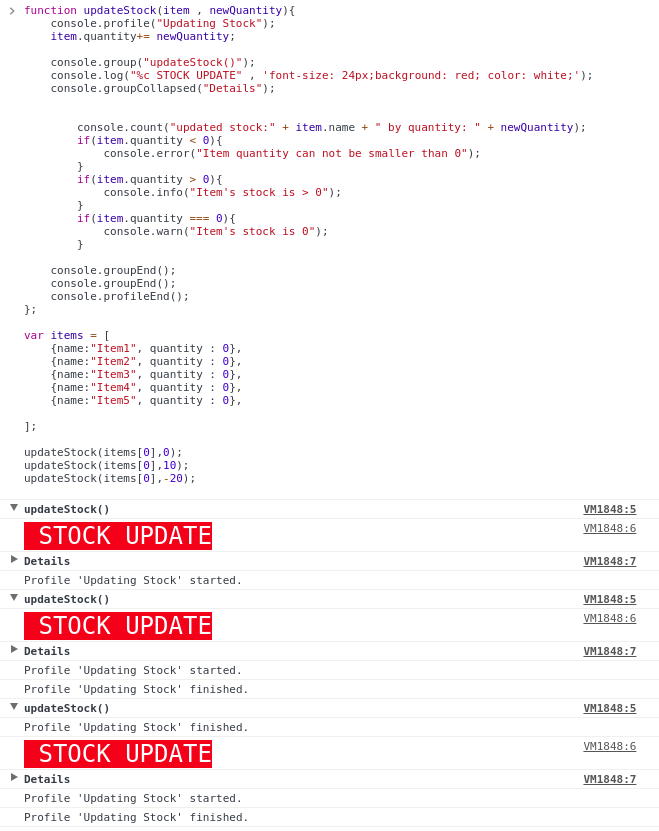
Grouping the Console’s output with console.group(), console.groupCollapsed() and console.groupEnd()
Using console.group(name) or console.groupCollapsed(name) with console.groupEnd() you can group many log messages into one group.
console.groupCollapsed() is the same as console.group() except that it creates a collapsed group.
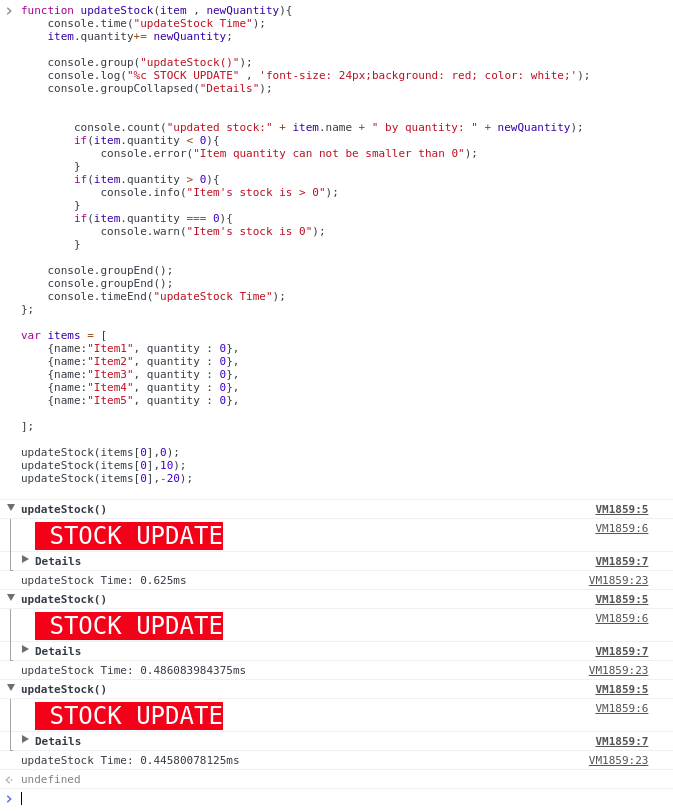
Let’s change our simple example to group messages into groups:
We can also nest groups:
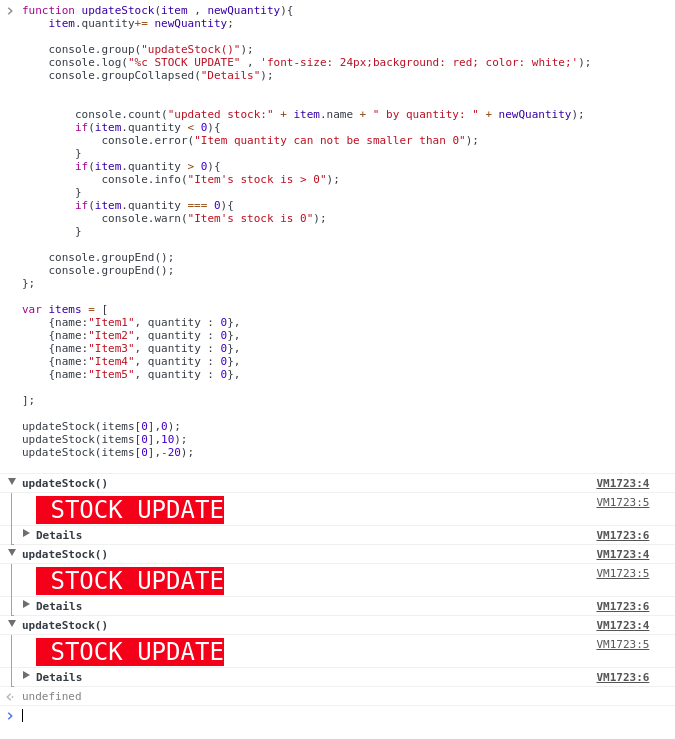
We created two groups: the outer group named updateStock(), then the inner collapsed group named Details. You can click on Details for more logging information.
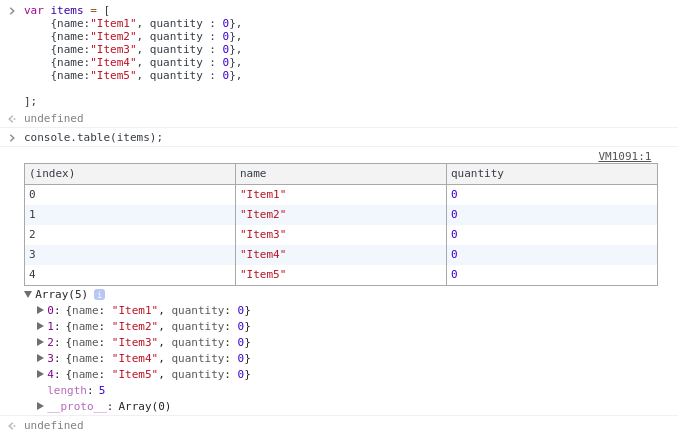
Logging array and object pretty data with console.table(), console.dir() and console.dirxml()
The console.table() method is useful for logging tabular data or arrays:
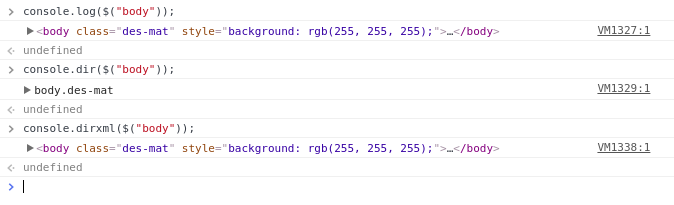
The console.dir() method is useful for logging an object as JSON data:
console.log($("body"));
console.dir($("body"));
console.dirxml($("body"));
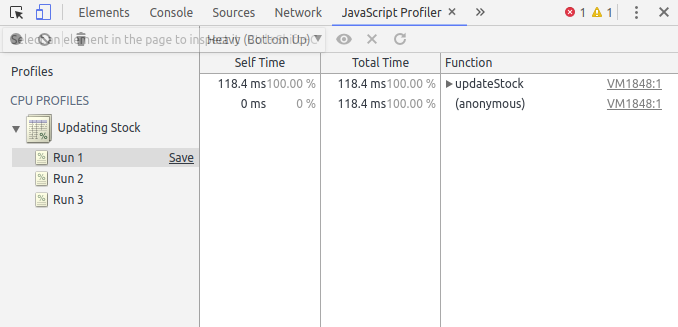
CPU Profiles
console.profile([label]) starts and console.profileEnd() ends a JavaScript CPU profile.
Let’s create a profile named Updating Stock for the updateStock() method:
function updateStock(item , newQuantity){
    console.profile("Updating Stock");
    //the method body
    console.profileEnd("updateStock Time");
}
You can use the JavaScript Profiler panel to find your created profile, which allows you to see how much time the function takes to execute in each run.
Measuring the execution time with console.time() and console.timeEnd()
You can use console.time(label) and console.timeEnd(label) to measure the time it takes for your code to execute. Let’s measure the execution time of the updateStock() method in our simple example:
function updateStock(item , newQuantity){
    console.time("updateStock Time");
    //the method body
    console.timeEnd("updateStock Time");
}
Getting the stack trace for JavaScript functions
By using console.trace() you can get the stack trace of the function, where it’s called, which allows you to better understand the code execution flow.
The complete call stack of the function is displayed on the console with the code filenames and line numbers, which you can click on to navigate to the corresponding line in the source.
It’s worth mentioning that console.trace() can be also used with the DevTools Snippets tool.
Monitoring events from the Console using monitorEvents()
You can monitor DOM events from the console with the monitorEvents method, which takes an object to be monitored as first parameter and an array of events to listen for as the second parameter. For example, let’s monitor the Google website for scroll, mousedown, mouseup and mouseover events:
monitorEvents(document.body, ["scroll"]);
monitorEvents($$('img')[2], ["mouseover","mousedown", "mouseup"]);//monitor the logo image
Querying the DOM from the Console
The DevTools Console has a method that allows you to query the current HTML document using CSS selectors. The method can be used by typing two dollar signs $$(selector), and it returns an array for all selectors.
These are some examples of what you can do with $$():
$$('p') // outputs an array of all <p> elements
$$('.cls') // outputs an array of all elements with the '.cls' class
$$('#id') // outputs the element with id '#id'
Even if the result is only one, the query method returns an array, so you need to use something like array[0] to access the result.
Please note that you can also use the standard JavaScript API to query the current HTML document from the Console, such as document.querySelector() or document.getElementsByClass() etc.
Referencing a selected element
If you’re working with the DevTools Elements panel and you’ve selected some DOM element, you can easily have a reference to it in the Console panel without having to query for it.
When you select the element, you can see that Chrome adds ==$0 which says that you can use $0 to reference that element from the console.
Disabling/cleaning Console output in production
Using the different Console APIs in development is extremely useful, but you maybe don’t want all that logging information to be present in production, so you can either use tools to clean the production code or disable the Console API with this simple code:
(function () {
    var methods = [];
    var noop = () => {};

    Object.keys(window.console).forEach(key => {

        methods.push(key);

    });
    console.log(methods);
    var length = methods.length;

    var m;
    while (length--) {
        m = methods[length];
        window.console[m] = noop;
    }
}());
You can also use the following tools to clean production code:
- Webpack-strip: a Webpack module created by Yahoo! developers that strips custom functions (such as debug or console functions) from your code.
- gulp-strip-debug: a module for GulpJS for stripping custom functions from your code.
- grunt-strip-debug: a module for GruntJS that strips custom functions.
The Console panel is specifically designed for debugging JavaScript code. Let’s now cover the tools designed to profile and identify performance issues or areas of possible optimization.
The DevTools Performance Tab
The Performance panel is designed to record both the run-time and load-time performance of web applications to find bottlenecks. It can be used to measure things such as where your code spends most of its time. The information can be then used to further optimize the problematic areas that impact performance to reduce UI blocking and optimize UI responsiveness.
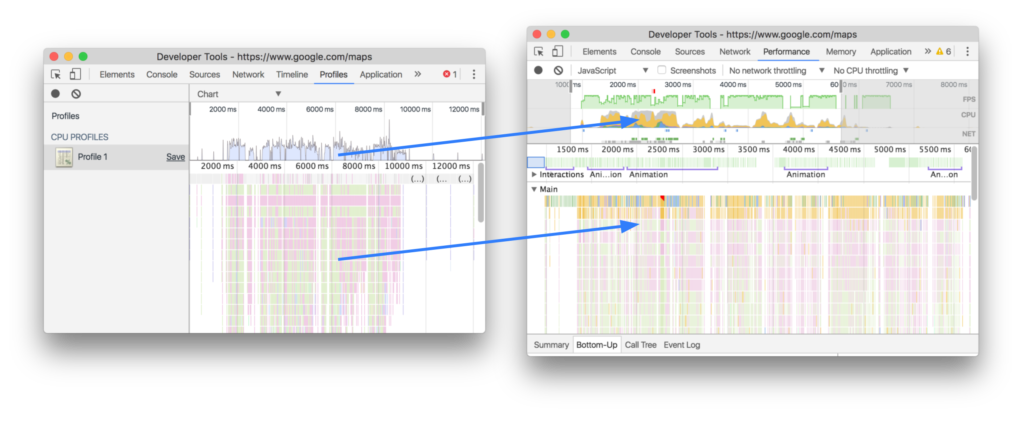
It’s worth mentioning that the Performance panel is new in Chrome. It combines the old Timeline and the JavaScript CPU Profiler, which still exists but is hidden under More tools — a step before it will be removed from future versions of Chrome.
The Performance tab can either profile the run-time performance or the load-time performance.
You can record a profile for runtime performance by clicking the record button (the black dot) or hit CTRL+E:
For load time performance, you need to use the second button or hit CTRL+Shift+E, which reloads the current page and starts a new recording.
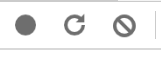
For a demo to profile, you can use the jank example provided by Google. You can read more about working with this demo here.
This demo is designed for testing purposes. You can either make the animations slower by adding more squares, or accelerate them by removing squares. You can also press the Optimize button to test the optimized code of this demo.
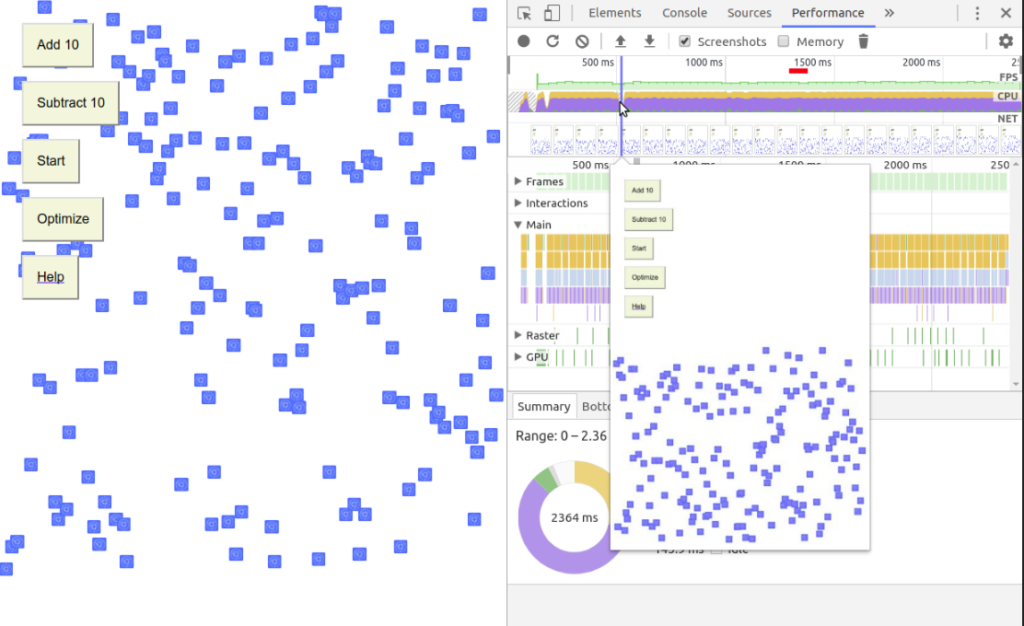
When profiling the performance of an application, make sure you use Chrome in Incognito Mode so you can prevent other open tabs — and especially the extensions installed on your Chrome installation — from interfering with your app’s profiling.
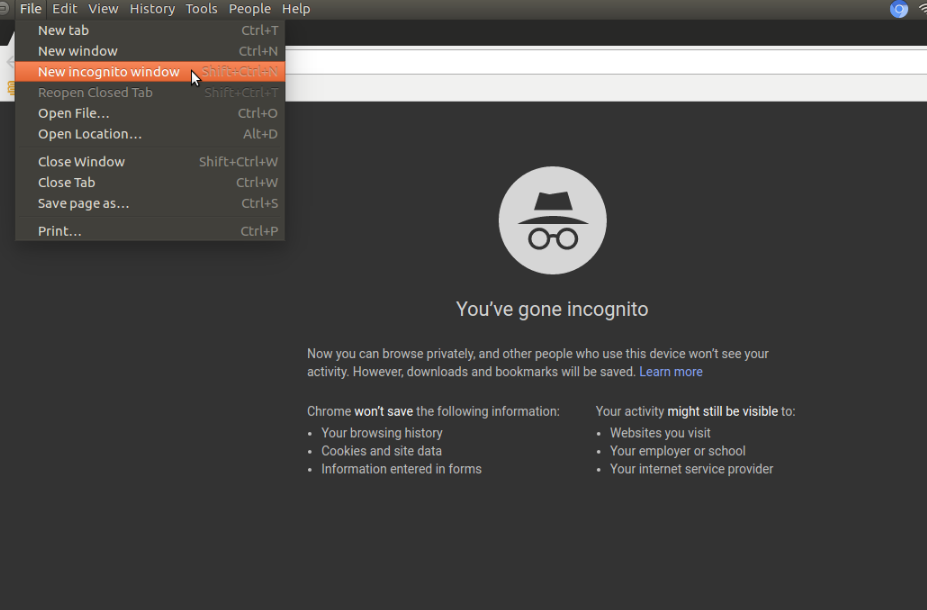
Network throttling
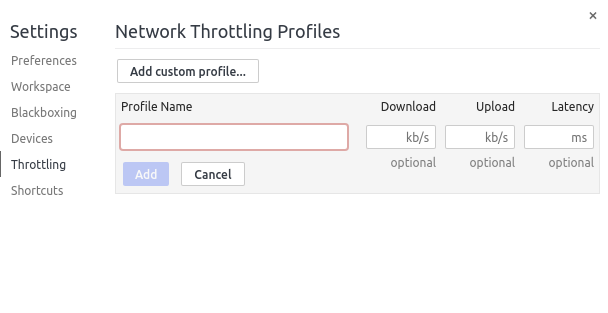
The Performance tab allows you to throttle the network when profiling your app to simulate different network conditions.
You can choose between different network conditions such as Online, Offline, Fast 3G and Slow 3G.
You can also add your custom condition to better target the conditions of your user base:
Simulate Mobile CPU
CPU throttling allows you to simulate the slow CPU power of mobile devices so you can accurately test how your web page performs in mobile devices.
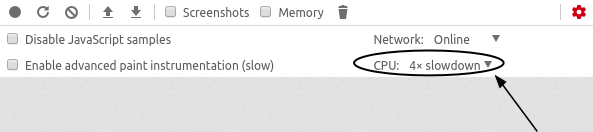
You can choose no throttling, 4x slowdown or 6x slowdown.
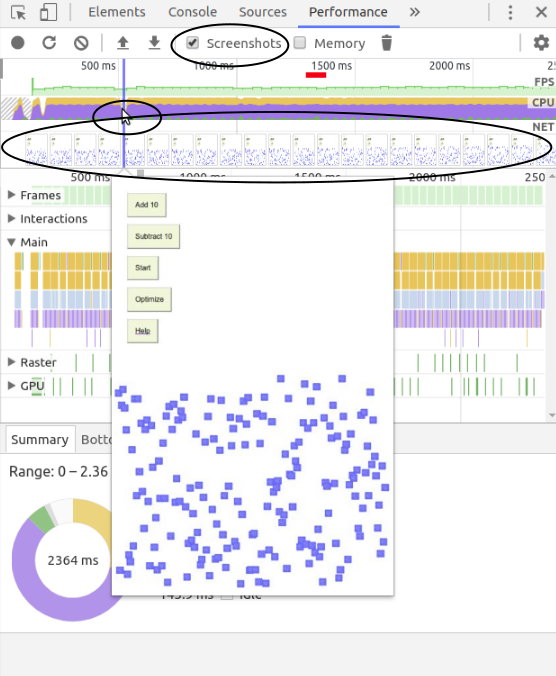
Taking screenshots while recording
You can take screenshots of every frame by checking the box Screenshots. Screenshots will help you visualize the state of your application’s user interface during profiling. They are especially helpful when you’re working with animations.
Analyzing the performance report
Before you can optimize the performance of your application you need to profile it, for two reasons: first, to measure how bad the performance is, and second, to determine areas where possible optimizations can take place. Once you’ve generated a performance report, you can read about the meanings of different charts and how to use the other sub-tools.
Zooming in or selecting time range
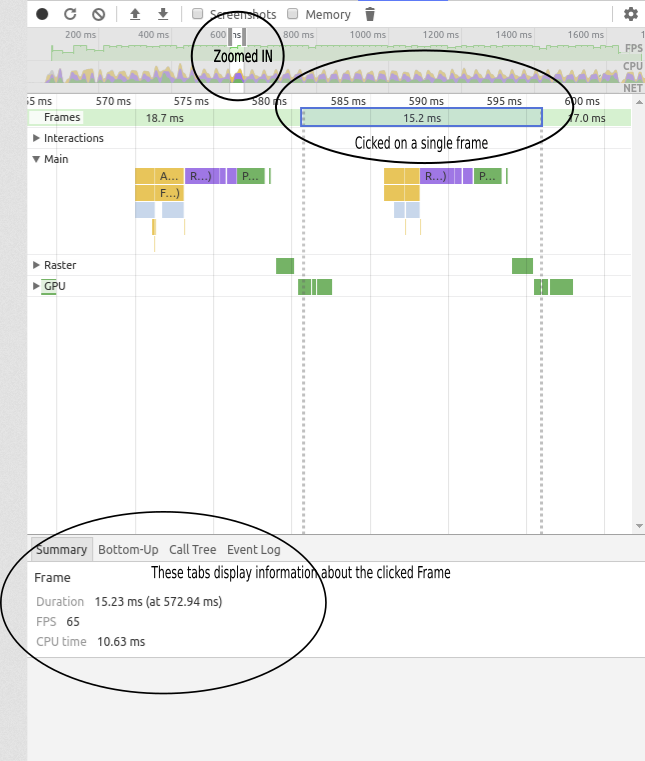
DevTools enables you to zoom in over different charts and areas of the Performance tab report. You can focus on a portion of time, which will help you clearly understand what’s happening at the level of a few milliseconds.
You can simply use your mouse to click over the area that includes the FPS, CPU, and Network charts. When the range handles appear you can then drag one of them or both to customize the selected portion.
When you select a portion, all different charts and sections will be updated to only display information about frames and operations happening at the selected time.
Frames Per Second (FPS)
Frame rate (expressed in frames per second or fps) is the frequency (rate) at which consecutive images called frames are displayed in an animated display. The term applies equally to film and video cameras, computer graphics, and motion capture systems. Frame rate may also be called the frame frequency, and be expressed in hertz.
From the definition, you can see that the frame rate is a concept related to filming and computer graphics, but it’s also used in the modern performance tools like Chrome DevTools to measure the page’s responsiveness to user interactions.
For building performant applications you need to target 60fps. Here’s a Google developers’s video that explains why 60fps rate is important:
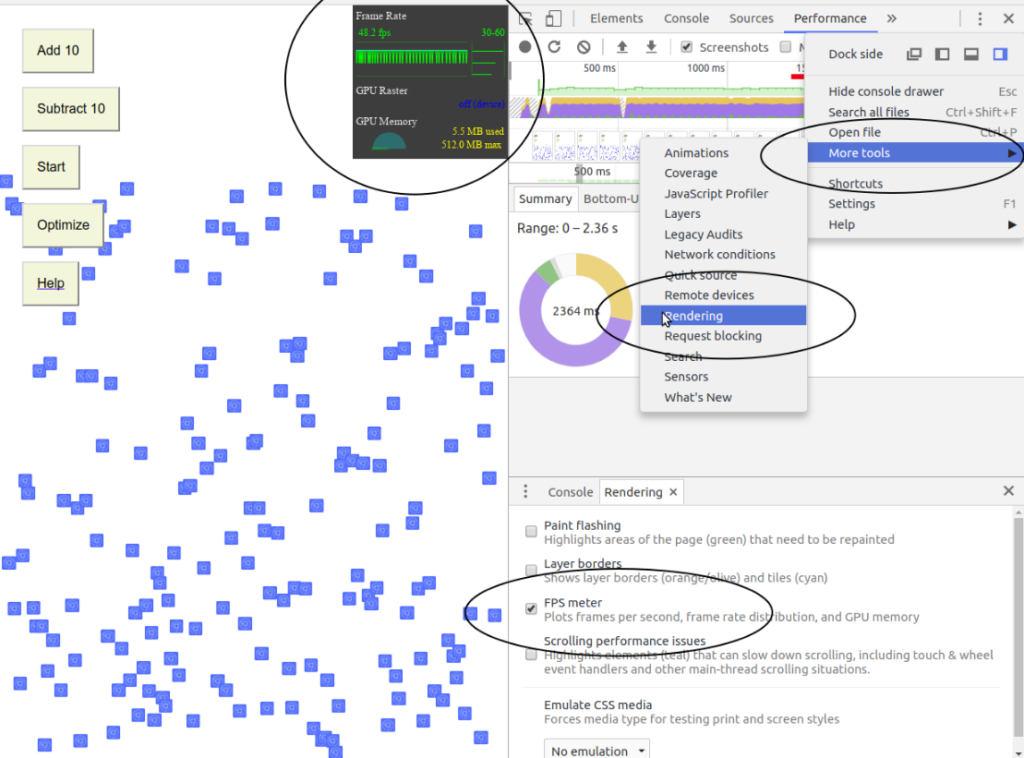
You can access a handy utility in DevTools (accessed from More tools -> Rendering tab) that displays a real-time visualization of your page FPS over time.
The FPS chart
The FPS chart displays the frame rate per second over the time of the profiling process.
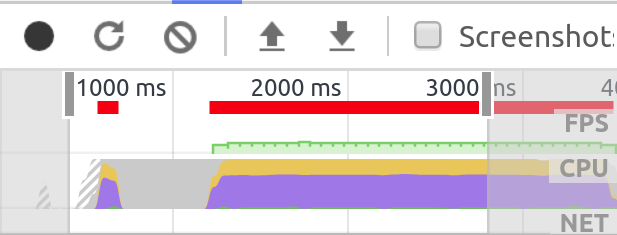
As pointed out by Google, the Red line in the FPS chart indicates that the frame-rate is so low to the point that it’s harming the user experience.
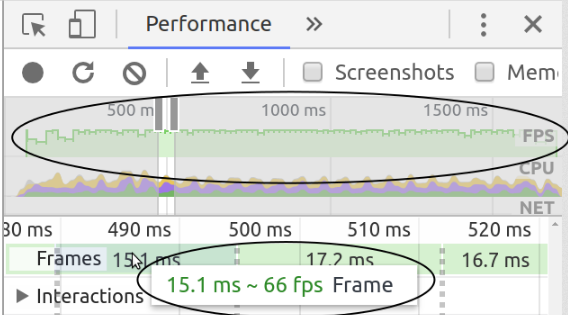
Here’s another screenshot of the optimized code with no red bars:
The FPS chart can help you detect where you may have problems before you can dive in using the other sub-tools.
Frames
Wikipedia defines frames like so:
A key frame in animation and filmmaking is a drawing that defines the starting and ending points of any smooth transition. The drawings are called “frames” because their position in time is measured in frames on a strip of film. A sequence of key frames defines which movement the viewer will see, whereas the position of the key frames on the film, video, or animation defines the timing of the movement. Because only two or three key frames over the span of a second do not create the illusion of movement, the remaining frames are filled with inbetweens.
The Frames section, located right below the charts area, contains green boxes representing frames. Once you move your mouse over a particular Frame, DevTools shows you two important details: the FPS rate, and the amount of time taken by all operations involved to render that frame.
If you click on the frame box, the Summary, Bottom-Up, Call Tree and Event Log tabs will show you only the details for that particular frame.
The CPU chart
The CPU chart shows the activity of the CPU during profiling. It’s located below the FPS chart.
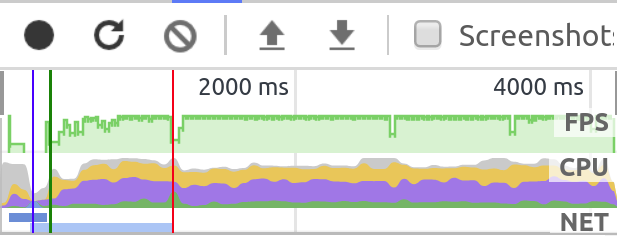
Colors correspond to different activities in the Summary tab. If you see that the CPU chart is full of colors, it means that the CPU was maxed out for long periods. This is a sign for you to do some performance optimization.
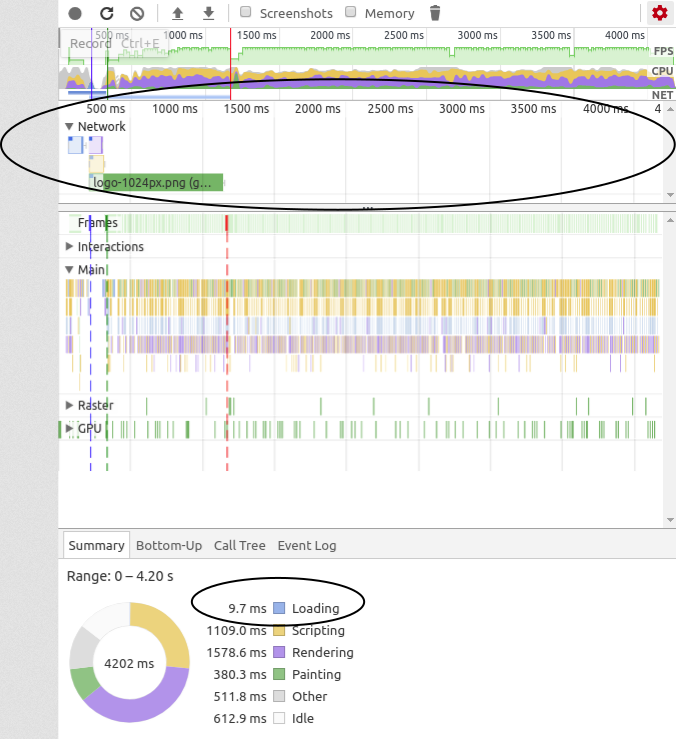
The Network chart and Network section
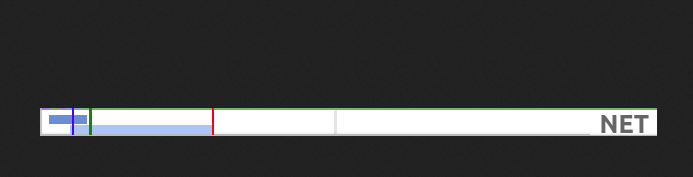
The net chart shows network requests during the profiling period. It’s specifically useful for load time profiling alongside the Network section which shows loading requests.
When you move your mouse over a request, it displays the loading time for that particular request.
When you click a particular request, all other sub-tools update to include operations that happen only during the request.
Different colors represent different resource types — JavaScipt, CSS, images etc. Resources that took longer to load have longer bars. The lighter part of each bar represents the Time to First Byte or TTFB. The darker part represents the Transfer time.
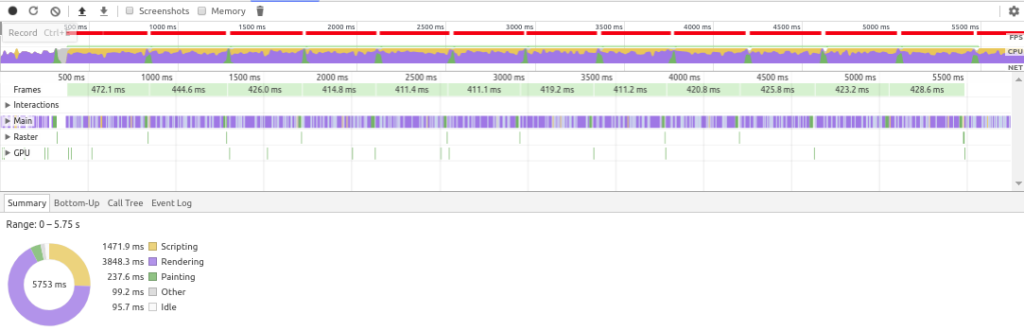
The Summary tab
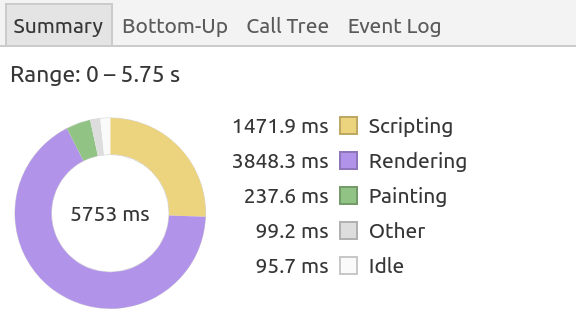
We have profiled the app for a period of 5.75s (or 5753ms). When there’s no selected time portion — on the overview area, where FPS and other charts exist — the range points to the whole period of profiling. It shows a colored breakdown of activities the browser is performing. We can draw a bunch of conclusions from this breakdown: out of 5753 ms, 3848.3ms (the most time) is spent in rendering, and for 95.7ms the thread was idle.
You can optimize the performance of this app by trying to reduce the time spent in rendering.
When an event or a function call is selected in the Main area, the Summary tab shows only information about that event/call.
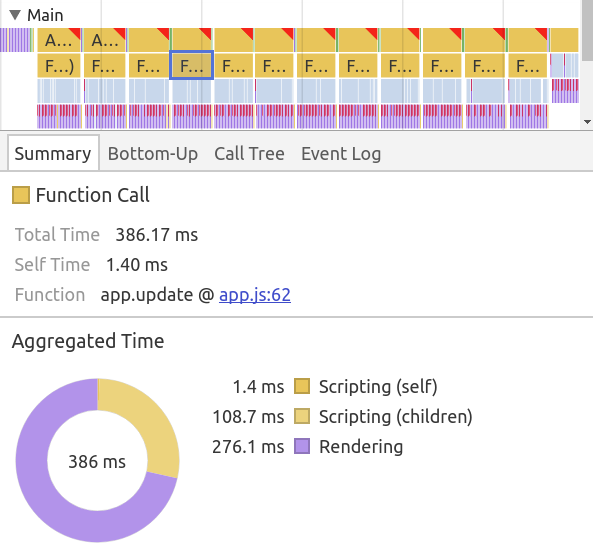
The summary tab provides you with detailed timing information — that is, where the browser spent its time. Before you can take steps to optimize your code, you need to get information about exactly where you need to take action. For this, you can to use the other tools (Call Tree tab, Bottom-Up tab and Event Log tabular views) under the Performance tab.
-
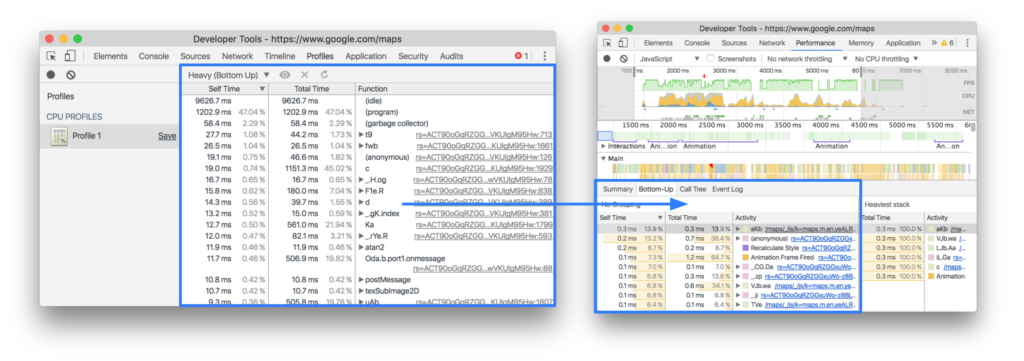
The Bottom-Up tab: This tab displays aggregated activities, from a bottom-up perspective, that took up the most time during a selected range of time or during all the profiling time if no range is selected.
-
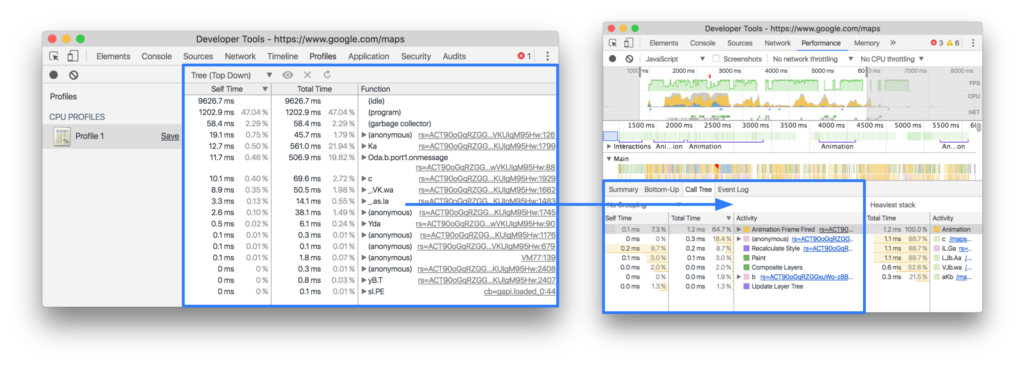
The Call Tree tab: displays activities with their call stacks during the (selected) profiling time.
-
The Event Log tab displays events, in the order in which they are executed, in profiling time or during a selected time.
The Main Section
Flame Graphs/Charts
Brendan Gregg, a kernel and performance engineer who created many visualization types for performance analysis, defines Flame graphs as:
Flame graphs are a visualization of profiled software, allowing the most frequent code-paths to be identified quickly and accurately. Flame graphs are a visualization for sampled stack traces, which allows hot code-paths to be identified quickly.
You can also read his detailed article about Flame graphs.
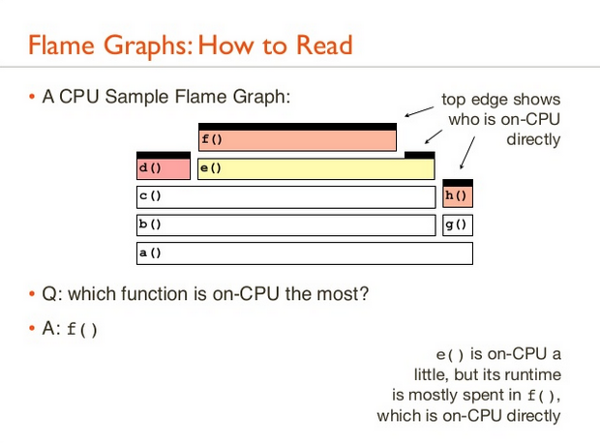
The Main section within the Performance tab shows you a flame chart of the activities on the main thread.
The Flame Chart displays the state of your code’s JavaScript stack (with detailed information about functions and events that were called) at the millisecond scale, during the time period of the performance profiling process.
The y-axis indicates the call stack depth, and the x-axis indicates the recording time. Each box (or bar when zoomed in) is a stack frame for an event or a function call. The box’s width represents how much time the operation has taken.
The ordering from left to right is not important (the stacks are sorted alphabetically). Wider bars indicate longer times, so you need to focus on those for optimizing the performance of you code. The Red triangle at the top-right of every box (representing a function call or a fired event) indicates that something is wrong with the operation. The colors in the different performance charts correspond to the colors in the Main section.
All of this is replacing the old JavaScript CPU Profiler.
The Bottom-Up tab replaces the old CPU profiler’s heavy (Bottom Up) view.
The Tree (Top Down) view in the old CPU Profiler can be replaced by the Call Tree tab.
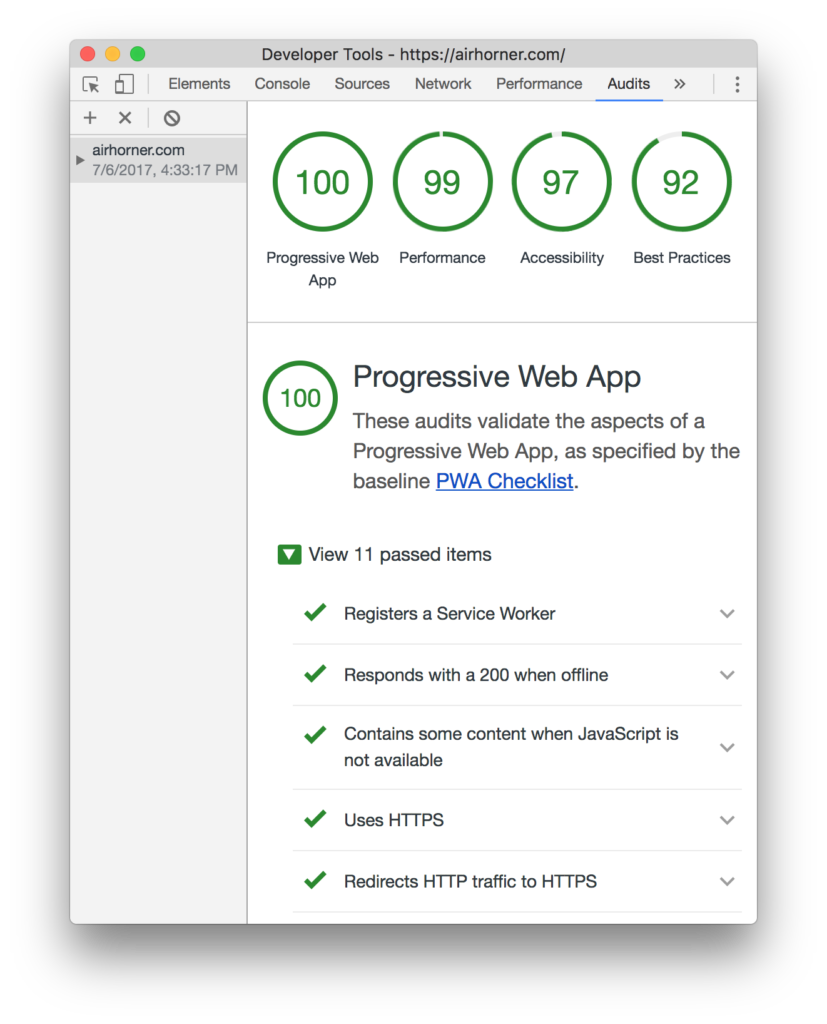
The Audits Tab
The Audits tool can be used to identify and guide you to solve common problems that affect your web application performance, accessibility and user experience. It has many audits and best practices and gives your application a score calculated based on how many audits you’ve passed and how many best practices you’ve followed and their weights (that is, not all audits have the same contribution in the final score). The final Audits report lists all audits in two categories — passed and failed — and shows tips/guidelines with links to external Google Web Developers blog posts on how to pass a specific audit.
Accessing audits and performing an audit
You can access Audits by opening DevTools, then activating its tab by clicking on it.
Next you can perform an audit by triggering the blue “Perform an audit…” button in the middle, then selecting the category of the audits to perform (or all of them), and finally clicking Run audit.
- Progressive Web App: run audits to test if the page meets the standard of progressive web apps
- Performance: run performance audits
- Best practices: run audits to test if the page follows the best practices for modern web development
- Accessibility: run audits to test if the page can be usable by people of disabilities and impairments.
Lighthouse sets up DevTools to emulate a mobile device, runs a bunch of tests against the page, and then displays the results in the Audits panel. You can then visualize the report or download it.
Please note that Audits is powered by Lighthouse, an open-source tool for improving the quality of web apps, which we’ve covered in more details in Progressive Web Apps: Crash Course.
Conclusion
Once you understand the cause of the performance issues at the code level, you can apply different JavaScript techniques to solve the bottleneck such as using requestAnimationFrame() or executing the operation in its own thread using HTML5 Web Workers.
In this article, we covered Chrome DevTools, specifically the Console panel and API and performance-related tools. You can find the different snippets used above in this repo.
Frequently Asked Questions (FAQs) on Chrome’s Dev Console Optimization and Auditing
What is the purpose of Chrome’s Dev Console?
Chrome’s Dev Console, also known as Developer Tools, is a set of web developer tools built directly into the Google Chrome browser. It allows developers to edit pages on-the-fly and diagnose problems quickly, which ultimately helps to build better websites, faster. It provides a variety of features like inspecting elements, debugging JavaScript, analyzing network activity, optimizing load performance, and much more.
How can I access the console command history in Chrome’s DevTools?
To access the console command history in Chrome’s DevTools, you need to open the DevTools first. You can do this by right-clicking on your webpage and selecting ‘Inspect’, or by using the shortcut ‘Ctrl+Shift+I’ on Windows or ‘Cmd+Option+I’ on Mac. Once the DevTools are open, navigate to the ‘Console’ tab. Here, you can use the up and down arrow keys to navigate through your command history.
How can I gather Chrome console logs?
Gathering Chrome console logs can be done through the ‘Console’ tab in Chrome’s DevTools. Once you’ve opened the DevTools, navigate to the ‘Console’ tab. Here, you’ll see a list of logs that have been output by the webpage. You can right-click anywhere in the console and select ‘Save as’ to save these logs to a file.
What are some of the key features of Chrome’s DevTools?
Chrome’s DevTools provides a wide range of features for developers. Some of the key features include the ability to inspect and edit HTML and CSS, debug JavaScript, analyze network activity, audit pages for accessibility, performance, and progressive web app metrics, simulate mobile devices, and much more.
How can I optimize load performance using Chrome’s DevTools?
Chrome’s DevTools provides a ‘Performance’ tab that allows you to analyze runtime performance and optimize load performance. Here, you can record and analyze all the activity in your application as it runs. It’s the best place to start investigating perceived performance issues in your application.
How can I debug JavaScript using Chrome’s DevTools?
Debugging JavaScript is made easy with Chrome’s DevTools. You can set breakpoints in your JavaScript code, step through your code, inspect variables, and see the call stack of a function. The ‘Sources’ panel in DevTools is where you debug JavaScript.
How can I simulate mobile devices with Chrome’s DevTools?
Chrome’s DevTools allows you to simulate mobile devices in a number of ways. You can simulate a mobile viewport and touch events, simulate the geolocation and device orientation, and even simulate network throttling. All these can be done in the ‘Device Mode’ in DevTools.
How can I inspect and edit HTML and CSS with Chrome’s DevTools?
The ‘Elements’ panel in Chrome’s DevTools allows you to inspect and edit HTML and CSS. You can see the page’s DOM, change element’s attributes, edit CSS properties, and see the changes take effect immediately.
How can I analyze network activity with Chrome’s DevTools?
The ‘Network’ panel in Chrome’s DevTools allows you to monitor network activity. You can see which resources are being loaded and how long they take, inspect HTTP headers and responses, and understand where and why bottlenecks occur.
How can I audit pages for accessibility, performance, and progressive web app metrics with Chrome’s DevTools?
The ‘Lighthouse’ panel in Chrome’s DevTools allows you to audit pages for accessibility, performance, and progressive web app metrics. It generates a report on how well the page did and provides tips on how to improve the page.