Easy Guide to Install and Use Firebug

Hi guys, I thought I’d write a quick post on how to use Firebug and FireQuery to see and debug your jQuery code (at the same time as HTML/CSS etc) and also inject live code into webpages to test jQuery effects. In this post I shall write about:
- How to install Firebug
- About FireQuery – a Firebug Extension for jQuery
- How to use Firebug with FireQuery to inject jQuery Code into a webpage.
What is Firebug?
“Firebug integrates with Firefox to put a wealth of web development tools at your fingertips while you browse. You can edit, debug, and monitor CSS, HTML, and JavaScript live in any web page.” Read More…
Key Features:
- Live edit of HTML, CSS, JavaScript, jQuery
- Explore DOM elements and attributes
- JavaScript Logging
- Monitor Network Activity
How to setup Firebug?
1. Download and Install Firefox web browser (current v3.6)
2. Download Firebug (currently v1.6 is compatiable with Firefox v3.6)
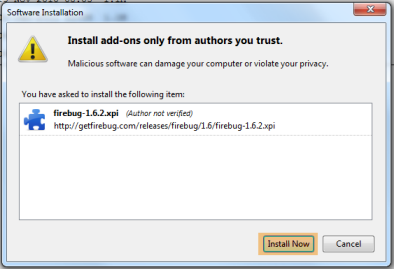
Firebug should now appear as one of your Firefox add-ons.

Note: If your currently using Firefox it will ask to restart the browser to finalise the install.
3. You should now see a little bug icon at the bottom right of your browser. This is the firebug icon which you can click to activate firebug.

Enable the script panel if it is disabled.

Select the jQuery script you wish to inspect.
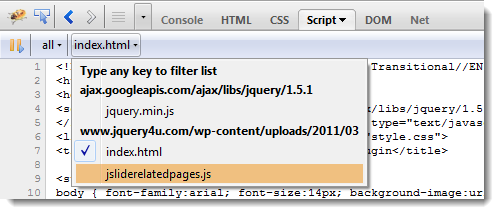
The jQuery code should now be visible and ready to inspect & debug.
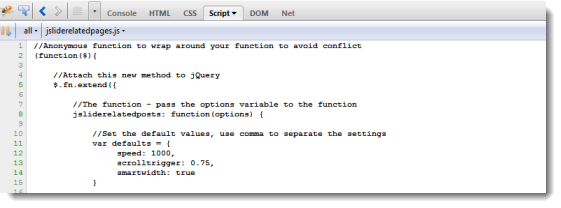
FireQuery – A Firebug Extension for jQuery

With FireQuery you can inject your jQuery into any web page live (sounds great doesn’t it!). Make sure when you install FireQuery that it works with your Firebug version and browser version (try it on the test page link below). It is still in early stages of “life” so be aware that it may not be perfect – but with 234,000 downloads who’s going to argue with that?!
How to use Firebug with FireQuery to inject jQuery Code into a webpage
- Load firefox
- Load the webpage you wish to add jQuery code to
- Click firebug icon to load
- Click jQuery (important to click the jQuery button incase the webpage doesn’t already have jQuery running)
- Use the command prompt to run some jQuery code on the webpages DOM elements.
Working example: Display a message when the google logo is clicked
1. Go to http://google.com
2. Load Firebug
3. Click jQuery (click the”jQuerify” button).
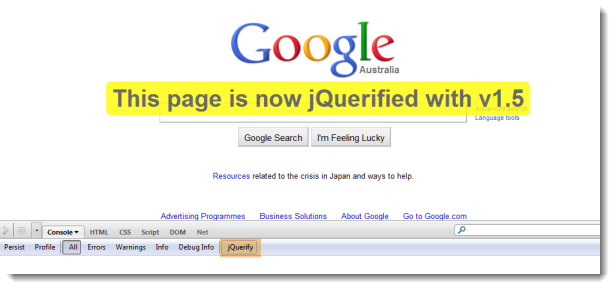
4. We can inspect the google logo element to retrieve its Id which is “hplogo” (no idea why its not just called logo…)
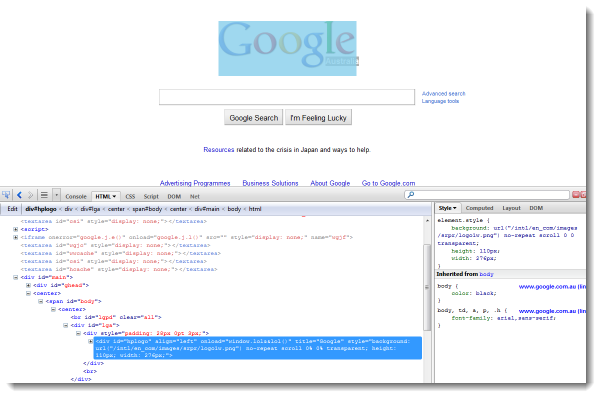
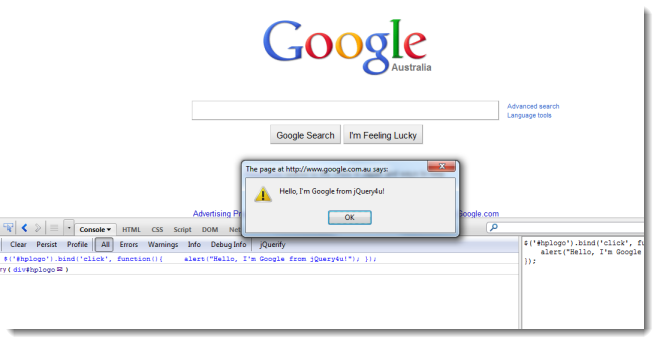
5. Type in the following code in the jQuery command window (on the right in screenshot but can appear as a single prompt line below the main code window (showing the html above):
$('#hplogo').bind('click', function(){
    alert("Hello, I'm Google from jQuery4u!");
});
Now clicking on the Google logo should display your message!
Frequently Asked Questions about jQuery Debugging with Firebug
How do I install Firebug for jQuery debugging?
Firebug is a browser extension that can be installed on Firefox. To install Firebug, navigate to the Firebug website and click on the ‘Add to Firefox’ button. Once the extension is installed, you can access it by clicking on the Firebug icon in your browser toolbar. Firebug is not available for other browsers like Chrome or Safari, but similar tools like Chrome Developer Tools can be used for jQuery debugging in these browsers.
How do I use Firebug to debug jQuery?
To debug jQuery with Firebug, first open the Firebug panel by clicking on the Firebug icon in your browser toolbar. Then, navigate to the ‘Script’ tab. Here, you can see all the scripts loaded by your webpage. You can select the script you want to debug, set breakpoints, and step through your code. Firebug also allows you to inspect variables, watch expressions, and evaluate code in the console.
What are breakpoints and how do I use them in Firebug?
Breakpoints are markers that you set in your code. When the execution of the script reaches a breakpoint, it pauses, allowing you to inspect the current state of your code. In Firebug, you can set a breakpoint by clicking on the line number in the script panel. Once a breakpoint is set, the line number will be highlighted in red.
How do I inspect variables in Firebug?
Firebug allows you to inspect variables in your code. When the execution of your script is paused at a breakpoint, you can see the values of variables in the ‘Watch’ panel. You can also add your own expressions to the watch panel to evaluate them at each breakpoint.
How do I evaluate code in the Firebug console?
The Firebug console allows you to evaluate code at any time. Simply type your code into the console input line and press enter. The result of your code will be displayed in the console. This is a powerful feature that allows you to test code snippets, manipulate your webpage in real-time, and debug more effectively.
Can I use Firebug to debug CSS and HTML?
Yes, Firebug is not just for JavaScript and jQuery debugging. It also provides powerful tools for inspecting and debugging HTML and CSS. The ‘HTML’ tab allows you to inspect and edit your webpage’s HTML in real-time, while the ‘CSS’ tab allows you to inspect and edit your webpage’s CSS.
How do I use the ‘Net’ panel in Firebug?
The ‘Net’ panel in Firebug provides information about all the network requests made by your webpage. This includes requests for scripts, stylesheets, images, and Ajax requests. You can see the status, size, and time of each request, which can be useful for performance debugging.
Can I use Firebug on mobile devices?
Firebug is a browser extension for Firefox, which is available on desktop platforms. For mobile debugging, you can use Firefox’s built-in developer tools, which provide similar functionality to Firebug.
Is Firebug still maintained?
As of 2017, Firebug is no longer maintained. However, its functionality has been integrated into Firefox’s built-in developer tools. These tools provide similar functionality to Firebug and are actively maintained by Mozilla.
Are there alternatives to Firebug for jQuery debugging?
Yes, there are several alternatives to Firebug for jQuery debugging. These include Chrome Developer Tools, Safari’s Web Inspector, and Microsoft Edge’s F12 Developer Tools. These tools provide similar functionality to Firebug, including script debugging, network inspection, and HTML/CSS inspection.
Sam Deering has 15+ years of programming and website development experience. He was a website consultant at Console, ABC News, Flight Centre, Sapient Nitro, and the QLD Government and runs a tech blog with over 1 million views per month. Currently, Sam is the Founder of Crypto News, Australia.


