How to Do a Content Audit of Your Website
Key Takeaways
- Start your content audit by gathering all SEO data using tools like Screaming Frog to compile a list of URLs and relevant SEO metrics, ensuring a thorough initial dataset.
- Consolidate all gathered data into a single spreadsheet using Google Spreadsheets or Microsoft Excel, utilizing functions like VLOOKUP to streamline the process and enhance data analysis.
- Analyze comprehensive SEO elements such as titles, meta descriptions, and headings to identify and rectify common SEO errors, and use conditional formatting to highlight areas needing attention.
- Utilize the data to evaluate content performance, focusing on metrics like social shares and page analytics to determine content length and quality, and identify the best times for publishing to maximize engagement.
- Leverage your audit findings to guide your SEO strategy, categorizing content into groups for updating, improving, consolidating, or removing, based on performance and relevance to current SEO goals.
Most people break out in a cold sweat when they see the word “audit.”
The good news is this post is not about traditional audits. It’s actually about conducting a content audit on your website. However, just as with your personal finances, content audits are necessary and when done correctly, are extremely beneficial for your website.
Depending on the size of your website, content reviews may take up to a few hours, but the benefit you’ll reap from it will far outweigh your investment. You can use them to find and correct SEO errors, discover which practices produce the best results, and improve your content production process.
In this tutorial, you will learn everything necessary to conduct your first content audit, without reinventing the wheel. Here are the steps we will take:
- You will learn how to gather primary data from sources such as Google Analytics;
- Then you’ll learn how to combine the data from different sources into one spreadsheet;
- Finally, you will receive tips on how to use the information you have collected in order to gain insight and find opportunities to improve your content.
All of the tools recommended in this guide are either completely free or have a trial version.
You’ll need to use spreadsheet software to collect and manipulate the information for your audit. Which provider you choose is up to you. The most popular are Microsoft Excel and Google Spreadsheets. I recommend the latter because it is free and allows you to easily pull in and manipulate data from external sources such as Google Analytics, which I show you how to do later.
However, people have complained that Google Spreadsheets tends to run slow as your spreadsheet grows. So if your site is pretty large, you may want to use Excel.
Step 1: Gather SEO data
Generate a list of all URLs using Screaming Frog
The easiest way to gather data from your website is by downloading and running Screaming Frog on your computer. This software is specifically created for SEO experts. While its free version is very useful (and will do for this content audit), most of the advanced features are only available to paid users.
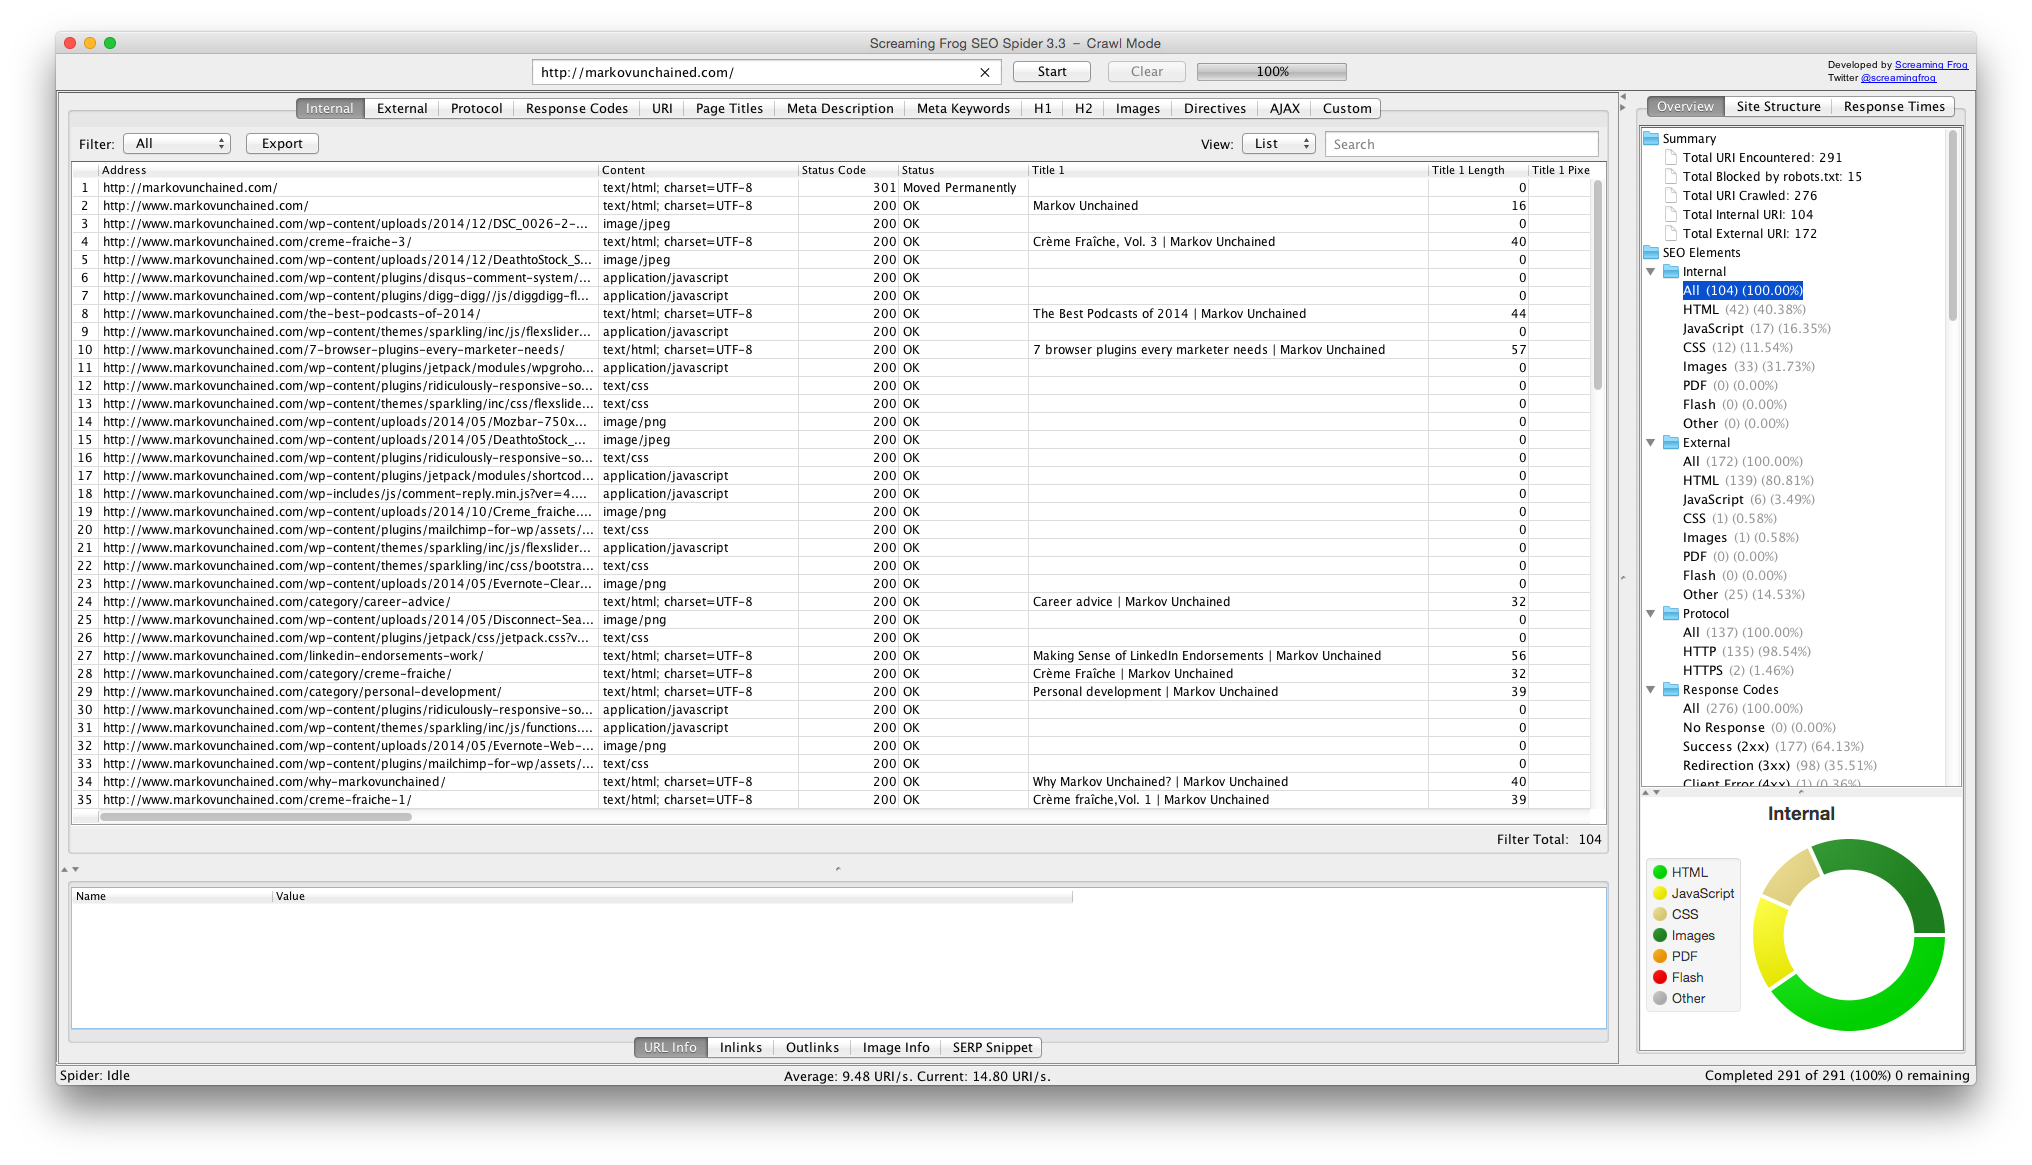
Run the report for your site and export the results into a .csv file. Then upload (or paste) the file into a Google Spreadsheet.
Screaming Frog will give you a lot to work with and it is up to you to choose which information is most relevant to your analysis. Here are the data points I find useful and why.
- URL (duh)
- Title (keywords)
- Title length (characters)
- Meta description (keywords)
- Meta descriptions length (characters)
- Word count
- H1 and H2 headings (keywords)
I will cover these points in more detail, and elaborate on why they are important later in this tutorial.
Pulling in data from Google Analytics
Once you have collected all of your URLs in a spreadsheet, it’s time to grab even more data, and add it to your spreadsheet. As I mentioned in the beginning, I use Google Spreadsheets because it allows you to pull in data from Google Analytics. Here’s how to do it.
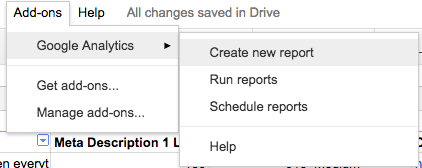
First, go to the Add-ons menu in your spreadsheet and make sure you have Google Analytics installed (if you don’t, use Add-ons > Get add-ons… to enable it).
Select Add-ons > Google Analytics > Create New Report:
A new window will appear with several options:
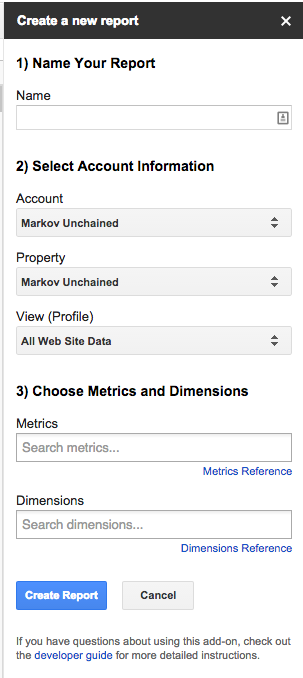
- Name your report (for example “MySite.com Unique Pageviews”)
- Choose the site for which you’re collecting stats
- Choose the metrics and dimensions you’ll be using – in our example, the metric will be Unique Pageviews and the dimension Pages
Click on Create Report and a new sheet will appear with the details of the configuration you just created:
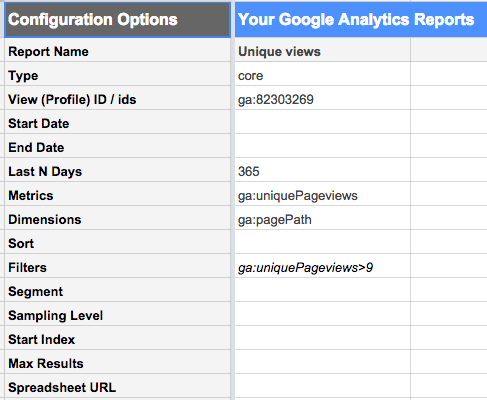
You can use this worksheet to change some of the details of your report.
For example, in the example above I have set the report to collect data from Analytics for one year back (Last N Days field) and have included only pages which have at least 10 unique visits (by adding ga:uniquePageviews>9 to the Filters field).
When you are happy with your configuration, select Add-ons > Google Analytics > Run reports.
Depending on the size of your site and the configuration of the report, it might take a few minutes, but in the end you should get a new sheet with the data you requested.
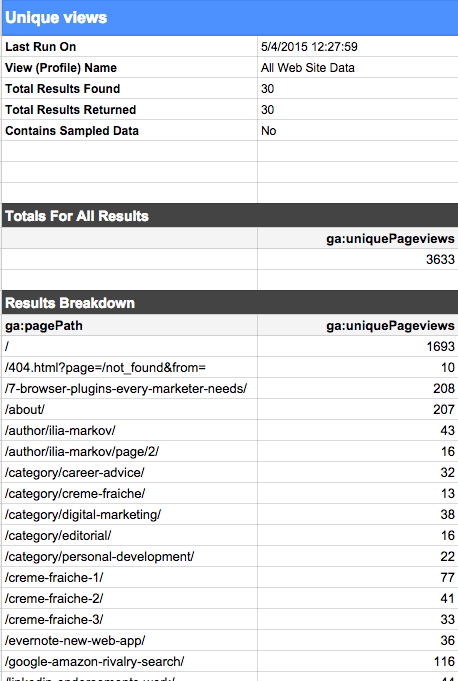
This is just a small example of what you can achieve by pulling data from Analytics. The simplest way to improve your analysis is by adding more metrics, here are some that you should consider:
- (Unique) visits: already covered this in the example above
- Entrances: very useful when analyzing the performance of your landing pages
- Bounce rate: learn which pages have high/low bounce rates and why
- Time on page: learn which part of your content is engaging and keeps visitors reading until the end
Collect data about social shares
Armed with the list of URL’s you get from Screaming Frog, head over to SharedCount and use the Bulk Upload function. Note: You’ll need to be logged in to use it – registering is free.
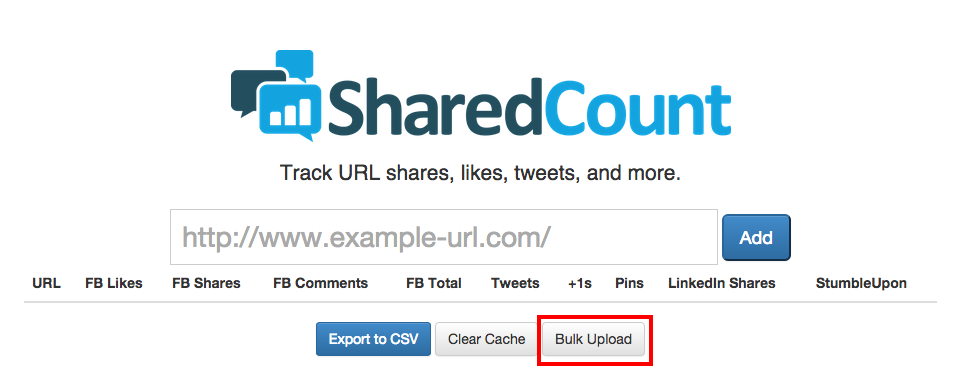
Run the report and export it to .csv to quickly add it to your spreadsheet.
SharedCount gives you stats from Facebook, Twitter, Google+, LinkedIn, Pinterest and StumbleUpon, but it’s up to you which of these to keep for your audit. For my site I find Twitter, Facebook, G+ and LinkedIn to be the most relevant.
Step 2: Putting all SEO data in one place
By now you should have multitudes of data scattered across different parts of your spreadsheet. It’s time to combine them so that you can analyze and draw insights quicker.
Here’s how we’ll do it.
Please note: We’ll be using the VLOOKUP function a lot in this section, so if you aren’t sure how it works, it’s a good idea to watch a primer video.
Choose one sheet that will serve as the Mastersheet for all your data. Of course, this could be a new sheet, but the one where you uploaded the data from Screaming Frog is also a good candidate since you need to start with this data anyway.
It is very likely that some of the URLs Screaming Frog collects will not be needed for your audit.
For example, since I use WordPress, there is a bulk of URLs for author, category and tag archives, which I don’t need.
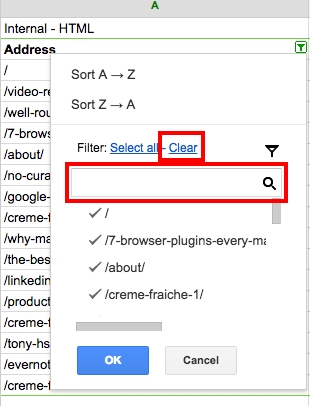
Use the filter function in Google Spreadsheets to hide these entries (they’ll still be in the spreadsheet, just not in plain sight). Here’s how to do it.
Select cell range and click the Filter button:

Click on the little drop-down button you see in the heading row of the column where you want to apply the filter.

A new dialog will appear. Type the text that you want to filter out in the text area and click Clear. Then click OK. Here’s how it should look.
Next, add a column for each metric of your Google Analytics data. In example 1, we only collected data on Unique Pageviews, so I’m going to add only one column.
Use VLOOKUP to get the data from the relevant worksheet. One problem I ran into doing this, was that Screaming Frog gives you the full URL, while Google Analytics trims out your base domain.
This can make running a VLOOKUP a lot harder. I found an easy hack to eliminate this issue on SpreadsheetPro though. Here’s how it works.
Use the RIGHT( ) function (it works both in Excel and Google Spreadsheets) to take only a number of characters from the end of the text string in a given cell.
Since you want to cut out a certain number of characters from the beginning you need to use this (this assumes the URL you want to trim is located in cell B1, so change accordingly):
=RIGHT(B1,LEN(B1)-[number of characters to remove])
LEN( ) is another formula, which gives you the length (in characters) of a particular string.
For example, the domain I’ve been using in this example – markovunchained.com, is exactly 30 characters long when you add “http://www.” So I would need to write the following:
=RIGHT(B1,LEN(B1)-30)
This is what it looks like when I do it for all URLs in my sheet.
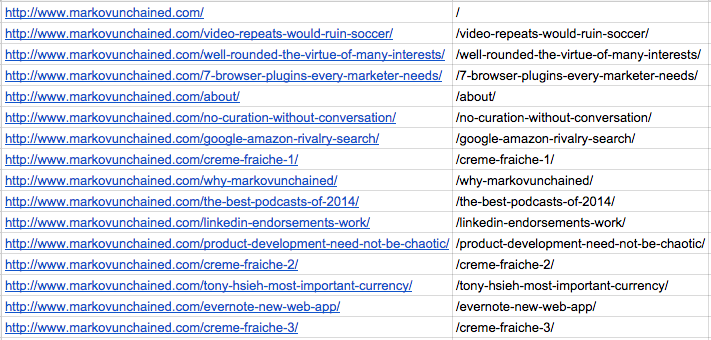
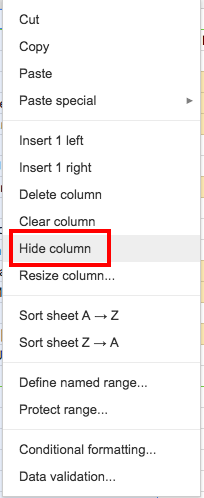
Now, it’s much easier to do that VLOOKUP and add your Analytics stats to the main sheet. Remember that you can Hide columns (by right-clicking on them) that you do not need for your analysis, but only use for your formulas.
Now, repeat the same process for your SharedCount data. Woo! Done with the preparation phase, and on to the analyzing section.
Step 3: Audit and analyze your content
In this step you will be performing the core analysis, learning what works, what doesn’t, what needs to be repeated, improved and/or scrapped altogether. Here is what you can do with the data you’ve collected.
Check SEO elements
The Screaming Frog report you ran earlier provides valuable information about the basics that have an effect on your search engine performance. Review the information you have to find and fix common mistakes. These are the elements you should study.
Title, Heading and Meta Description
These are immensely important to your SEO as they guide search engines, telling them what your content is about. Thus, it is important that they include your focus keyword for the given page.
Additionally, each element has nuances, which you should also aim to get right.
Title is what appears in search results. This is the place where you should target the most important and relevant keyword to your page.
Meta Description is what appears in search results as a short paragraph. Perhaps more important than stuffing it with keywords, you have to make sure it is written for humans to read. Not only you will make your visitors happy, but it also has the potential to improve your ranking in search results (because: you write a good description -> more people click on your site when they see it -> higher clickthrough rate = good signal to search engines about your content).
Your Headings is where you should think about targeting so-called long-tail keywords. Trying to rank for basic keywords that have huge search volumes (and consequently traffic) can be very challenging. On the other hand, there are hundreds, even thousands, of less competitive phrases, which can still bring in good traffic and will also help with gaining advantage on those search terms which are hard to rank for.
Title and Meta Description Length
You should always remember to keep an eye on the length of your title and description because search engines will often choose a portion of each particular field to show and truncate the rest.
How much users see also depends on the screen that they are using. Make your meta tags too long and this is what you might get.

Many opinions exist on the optimal size of these two fields. The golden middle for the title tag appears to be 50-55 characters with 70 as the absolute maximum (if you go above this, it will be truncated for sure). For the meta description, most experts agree that 150-160 characters is the optimal length.
Use conditional formatting to highlight those pages where the title and description characters are more than the optimal length. I’ve developed a color-coding system to do this. Here are the labels I use.
- Green – 55 characters or less
- Yellow – 56-70 characters
- Red – 70+ characters

Content, keywords and internal links
The auditing process offers you the opportunity to look at your content from above and make sure it is interesting, engaging and relevant.
Have you mentioned target keywords enough or too much? Have you targeted long-tail keywords in your content less than three to four times per page?
Finally, make sure you have enough internal links within each page. Linking to at least two to three pages within the same site is a great tactic.
Always aim to link to deep resources, such as blog posts and content offers. Redirecting to one of your core pages (homepage, about, etc.) should only be done when absolutely necessary.
Analyze your best content
With the information from Google Analytics and SharedCount you can find out where you really hit the nail on the head.
Combining this data with additional layers of information, such as word count and search traffic, can give you incredible insight. Here are a few examples.
Ideal content length for most social shares
Using this technique you can determine how long your articles should be in order to maximize the number of social shares.
First, decide how you want to categorize length. I recommend the following labels:
- Less than 500 words: Short
- 500-1000 words: Medium
- More than 1000 words: Long
Create a new column and use a double IF formula. On my spreadsheet, it looks like this:
=IF(G3<500,”Short”,IF(G3<1000,”Medium”,”Long”))
In the end you should get something like this:
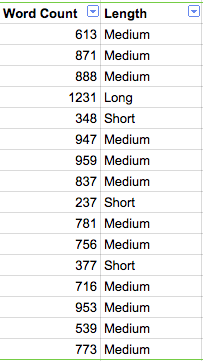
Create another column to summarize all social shares.
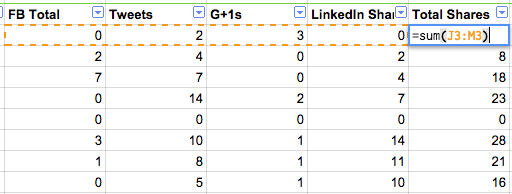
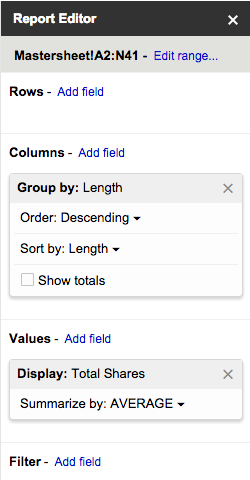
Now, it’s time to create a Pivot table to combine both sets of data. In Google Spreadsheets select your entire data range and go to Data > Pivot table, a new datasheet and dialog window will appear.
Using my example, I select Group by: Length and Display: Total shares with the option Summarize by: AVERAGE:
Finally, in order to visualize your findings better, create a graph using data from the pivot table, here is what mine looks like.
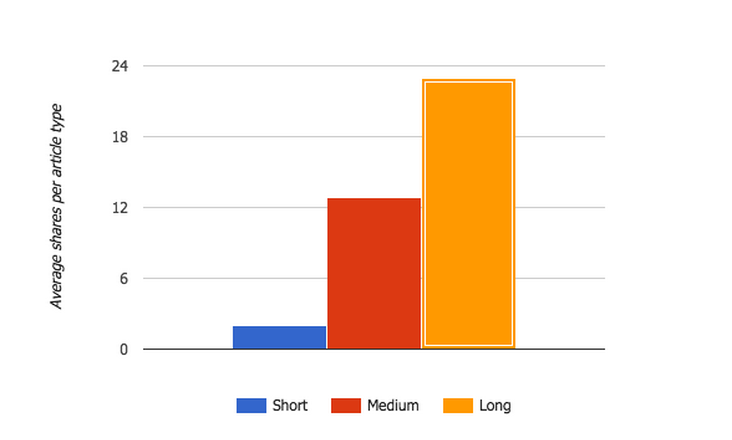
Unsurprisingly, longer articles tend to get more shares on average than shorter ones. You can use the same technique to see which are read by more people (by using Unique pageviews instead of Total shares), but I’ll let you try that yourself.
Best times to publish on your site
Using the same technique you can also discover when the best time to publish your content is in order to get the most visits and/or shares. To do this, you’ll need to pull information about dates of publishing and find out which day of week each corresponds to manually.
Note: I’m sure there’s an automated way to do this. I just haven’t found it yet. If you know how to do it, please let me know in the comments.
Analyze landing page performance
Google no longer publishes the exact search terms your visitors used to get to your site, but that doesn’t mean there is no way to deduct some of this information.
First, you must register your website on Google Webmaster Tools.
Under Search Traffic > Search Queries you can learn some of the keywords you’re ranking for and how your page ranks for each.
But even more useful conclusions can be drawn from your content audit.
Ideally, you’re already using landing pages to target specific keywords.
Pull in data from Google Analytics about the number of people who enter your site from these pages (the relevant metric is called Entrances). Analyze which ones perform well and see how well they rank for the targeted keywords. Don’t forget to also use Google Webmaster Tools.
Have a look at these pages and figure out what you did well on them in terms of structure, content, etc. Collect even more data from Analytics and see how they perform in terms of bounce, average time spent on site, etc.
Step 4: Use the audit to guide your SEO strategy
The best way to make use of a content audit is to adopt a strategic approach and use your findings to create a strategy. I use four general buckets for my content:
- Leave as-is
- Improve
- Consolidate
- Remove
If you are happy with the performance of a certain piece of content, it’s up-to-date, relevant and of high-quality, leave it as it is.
If your content hasn’t been updated in a while, new information and research has emerged, or the article isn’t doing very well with the intended keywords, mark it for improvement. Since your time and resources are limited, make sure to prioritize what you’ll work on first.
Some pieces of content may be better together. If you have articles dealing with similar topics, not doing so well in search rankings, you might want to consider consolidating them into one, more in-depth resource.
For some sites with a lot of content, the best tactic may be to remove some of the content from the sitemap altogether. This way you will allow search engine bots to focus only on those pieces of content that you think can be most beneficial to pagerank.
Conclusion
Content audits are extremely useful because they allow you to shift your focus and get a high-level view of your site’s performance.
If your site has been around for a while, you’ll probably be surprised to find more than one SEO mistake or missing information on older articles.
Going through the process once or twice each year will also let you prioritize how you spend your time improving your site and will, without a doubt, offer you a wealth of fresh ideas on how to improve it.
Frequently Asked Questions (FAQs) about Content Audit
What is the importance of a content audit in digital marketing?
A content audit is a crucial part of digital marketing. It involves a comprehensive analysis of all the content on a website to determine its strengths, weaknesses, and opportunities for improvement. This process helps to identify outdated or irrelevant content, gaps in content coverage, and areas where the content can be optimized for SEO. It also provides insights into user engagement and content performance, which can guide future content strategies.
How often should I conduct a content audit?
The frequency of content audits can vary depending on the size of your website and the nature of your business. However, it’s generally recommended to conduct a content audit at least once a year. Regular audits can help keep your content fresh, relevant, and aligned with your business goals.
What are the key steps in a content audit?
A content audit typically involves several key steps. First, you need to inventory all your content. This includes identifying and cataloging all the content on your website. Next, you need to assess the quality and performance of your content. This involves analyzing metrics like traffic, engagement, and conversions. Finally, you need to develop a plan for improving your content based on your findings.
How can I use a content audit to improve my SEO?
A content audit can provide valuable insights for improving your SEO. It can help identify areas where your content can be optimized for keywords, meta descriptions, and title tags. It can also uncover opportunities for internal linking and backlinking. Additionally, removing or updating outdated or low-quality content can improve your site’s overall SEO.
What tools can I use to conduct a content audit?
There are several tools available that can assist with a content audit. These include Google Analytics for tracking content performance, SEMrush for keyword analysis, and Screaming Frog for crawling and indexing your website. Content management systems like WordPress also often have built-in tools for content auditing.
How can a content audit improve user experience?
A content audit can significantly enhance the user experience on your website. By identifying and removing outdated or irrelevant content, you can ensure that users are only presented with the most accurate and relevant information. Additionally, by optimizing your content for SEO, you can improve your site’s visibility and accessibility.
Can a content audit help with content strategy?
Absolutely. A content audit can provide valuable insights that can guide your content strategy. By understanding what content is performing well and what isn’t, you can make informed decisions about what type of content to produce in the future.
What should I do with low-performing content?
Low-performing content can be handled in several ways. You can choose to update it, optimize it for SEO, or remove it entirely. The best course of action depends on the specific issues with the content and its potential value to your website.
How can a content audit help me understand my audience better?
A content audit can provide insights into what content your audience finds most engaging and valuable. By analyzing metrics like page views, time on page, and social shares, you can gain a better understanding of your audience’s interests and preferences.
What is the role of a content audit in content marketing?
A content audit is a critical component of content marketing. It helps ensure that your content is relevant, up-to-date, and aligned with your marketing goals. It also provides insights that can guide your content creation and distribution strategies.
Ilia Markov is a Michigan MBA (Go Blue!) and a freelance digital marketing consultant. He specializes in digital marketing strategy, inbound marketing, and conversion rate optimization. When not working on a project, Ilia loves to blog on MarkovUnchained.com.


