Quick Tip – Using and Installing Cordova

Cordova is a phenomenal tool that allows you to build native mobile apps using the web technologies you know and love. It gives access to some hardware features unaccessible in vanilla HTML5, and most crucially, the marketing potential of app stores. Cordova allows you to write your application code once in HTML5 and JavaScript, and deploy to multiple targets using the same code. In this quick tip, I will cover basic usage, and installing Cordova.
Install
First install Node.js from their official packages, Homebrew (Mac), Chocolatey or Scoop (Windows). Cordova uses the package manager of Node.js, npm, for installation.
On OSX and Linux open your terminal and run:
sudo npm install -g cordova
On Windows open Command Prompt run:
C:\>npm install -g cordova
This installs the Cordova package globally and accessible in any project.
Create a Project
Create a new project with cordova create <name> e.g.
cordova create my-mobile-app
cd my-mobile-app
Add a Platform
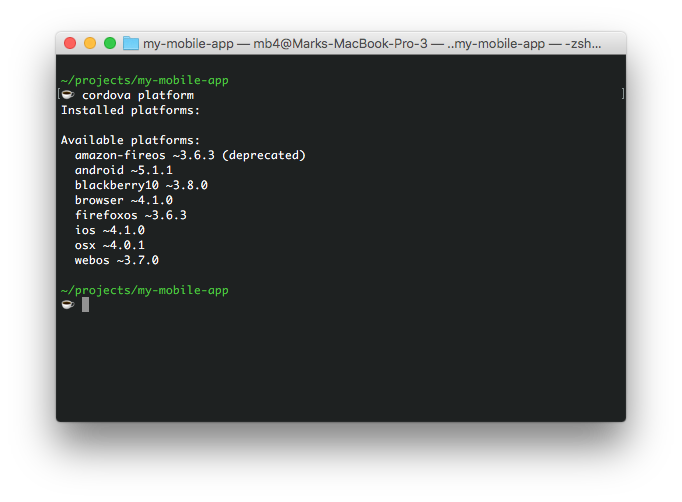
Type cordova platform to see a list of available platforms. You’ll see different options depending on the operating system, here’s the results on a Mac.
Add a platform with cordova platform add <platform>, e.g.
cordova platform add ios
cordova platform add android
To build and run you’ll need SDKs for each platform that you want to target installed. We have a handy quick tip for installing Android and for iOS you will need XCode.
To check you have everything needed for the platforms added, run:
cordova requirements
Build
Build your app with cordova build <platform>, e.g.
cordova build ios
cordova build android
You can also run cordova build to build all platforms added to the project.
Run
Run the app with cordova run <platform>, e.g.
cordova run ios
cordova run android
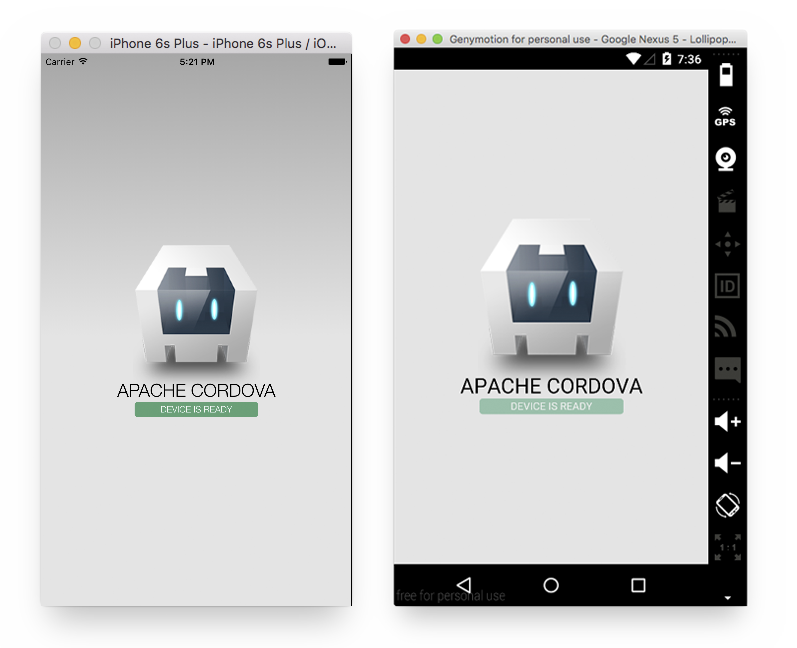
Note: On a Mac cordova run ios will open the iOS Simulator. A good option for emulating android devices is with GenyMotion that lets you install and run popular android devices as a Virtual Machine (VM). Once the VM is running, cordova run android will install and run the app.
Plugins
Plugins are additions to Cordova that allow you to access hardware features from JavaScript.
To Install a plugin run cordova plugin add <plugin>. For example, to install the camera plugin.
cordova plugin add cordova-plugin-camera
Adding Your Application
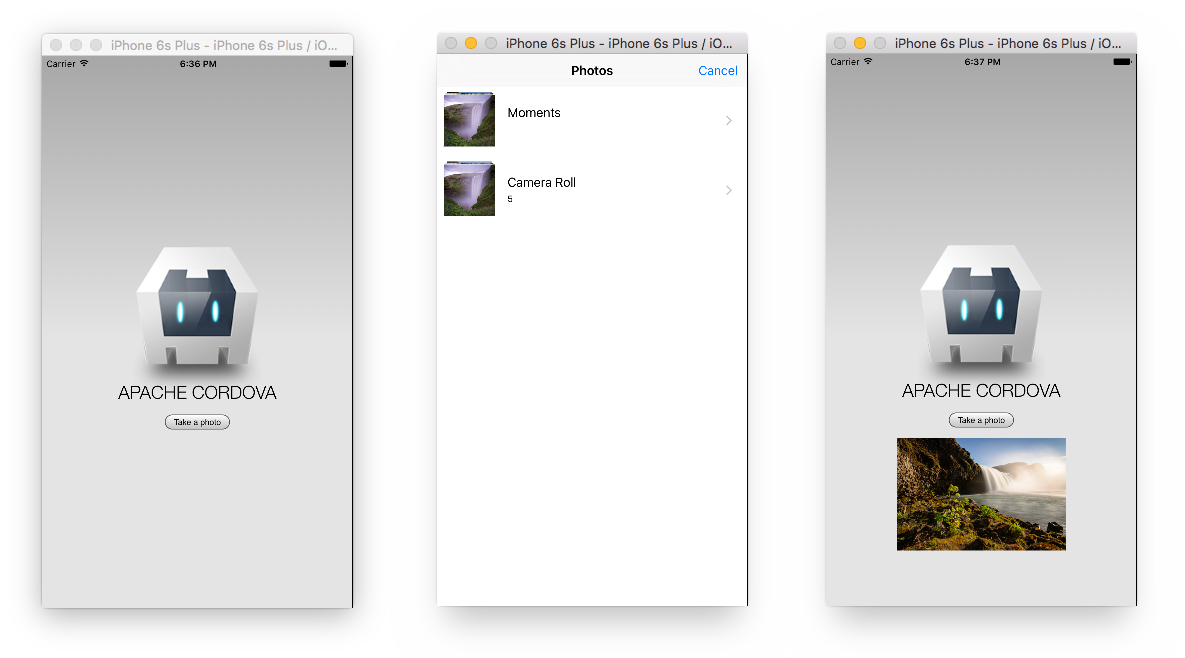
The custom code for your app sits in the www directory. You can edit those files, build and run to see the changes reflected in an emulator. As an example, add a button which will take a photo from the library and show it in the view.
Replace the #deviceready div in index.html with:
<div id="deviceready">
  <p>
    <button id="get-picture">Take a photo</button>
  </p>
  <p>
    <img id="my-photo" width="300" />
  </p>
</div>
Add the following to the end of js/index.js:
document.getElementById('get-picture').addEventListener('click', getPicture, false);

function getPicture() {
  navigator.camera.getPicture(onSuccess, onFail, {
    quality: 50,
    sourceType: Camera.PictureSourceType.PHOTOLIBRARY,
    destinationType: Camera.DestinationType.FILE_URI
  });
}

function onSuccess(imageURI) {
  var image = document.getElementById('my-photo');
  image.src = imageURI;
}

function onFail(message) {
  alert('Failed because: ' + message);
}
Build then Run and you should be able to test out your first ‘native’ feature.
You’re on your way to building great apps :)
Next Steps
Read the Cordova Overview for an understanding of how Cordova works and search the Plugins to see what’s available on different platforms.
SitePoint has a lot of articles relating to Cordova if you want to dive straight into more tutorials.
Frequently Asked Questions (FAQs) about Installing and Getting Started with Cordova
What are the prerequisites for installing Cordova?
Before installing Cordova, you need to have Node.js installed on your computer. Node.js is a JavaScript runtime that is required for Cordova. You can download it from the official Node.js website. After installing Node.js, you can install Cordova using the Node Package Manager (npm) which comes with Node.js.
How do I install Cordova using npm?
To install Cordova using npm, open your terminal or command prompt and type the following command: npm install -g cordova. The -g flag installs Cordova globally on your computer, allowing you to use it in any directory.
How do I create a new Cordova project?
To create a new Cordova project, use the cordova create command followed by the directory name, package name, and project name. For example: cordova create hello com.example.hello HelloWorld. This will create a new Cordova project in the ‘hello’ directory with ‘com.example.hello’ as the package name and ‘HelloWorld’ as the project name.
How do I add platforms to my Cordova project?
To add a platform to your Cordova project, navigate to your project directory and use the cordova platform add command followed by the platform name. For example: cordova platform add android. This will add the Android platform to your project.
How do I build my Cordova project?
To build your Cordova project, use the cordova build command followed by the platform name. For example: cordova build android. This will build your project for the Android platform.
How do I run my Cordova project on an emulator or device?
To run your Cordova project on an emulator or device, use the cordova run command followed by the platform name. For example: cordova run android. This will run your project on an Android emulator or device.
How do I remove a platform from my Cordova project?
To remove a platform from your Cordova project, use the cordova platform remove command followed by the platform name. For example: cordova platform remove android. This will remove the Android platform from your project.
How do I update Cordova to the latest version?
To update Cordova to the latest version, use the npm update -g cordova command. This will update Cordova to the latest version globally on your computer.
How do I list all the platforms and plugins in my Cordova project?
To list all the platforms and plugins in your Cordova project, use the cordova platform ls and cordova plugin ls commands respectively. These commands will list all the platforms and plugins in your project.
How do I add a plugin to my Cordova project?
To add a plugin to your Cordova project, use the cordova plugin add command followed by the plugin name. For example: cordova plugin add cordova-plugin-camera. This will add the camera plugin to your project.
Hello. I'm a front end web developer from Melbourne, Australia. I enjoy working on the web, appreciate good design and working along side talented people I can learn from. I have a particular interest in visual programming so have fun working with SVG and Canvas.


Published in
·App Development·Design·Design & UX·Mobile·Mobile UX·Mobile Web Development·Patterns & Practices·UX·October 23, 2014