How to Analyse HTTP Requests using Net Panel, HTTP Fox & Fiddler2
Key Takeaways
- Understanding and analyzing HTTP requests is crucial for web developers as it aids in debugging, optimizing performance, and ensuring the security of web applications. Tools like Net Panel, HTTPFox, and Fiddler2 can help monitor and analyze these requests and responses.
- Net Panel, part of the Firebug install, is a tool used to monitor HTTP traffic initiated by a web page. HTTPFox is a Firefox add-on that monitors and analyzes all incoming and outgoing HTTP traffic between the browser and the web servers. Fiddler2 is another tool that works with any browser and is particularly useful for multi-browser testing.
- Each of these tools has unique strengths. Net Panel offers a Waterfall Style Chart showing load order and times, HTTPFox offers speed and ease of use with a full-screen detach option for maximum detail, and Fiddler2 is compatible with multiple browsers and offers extensive options/settings. Wireshark is another powerful network analysis tool suggested for use if the other options don’t produce results.
It is essential to any web developer to understand HTTP requests and be able to analyse which files are loaded when a web page is loaded. For example, say a web page is loading really slow and you want to know why! Yes, we’ve all been there! Thankfully there are tools which can help us inspect our HTTP requests and monitor what HTTP requests are being sent off during page execution.
Included in this post:
- NET Panel – overview and how to use it.
- HTTP Fox – overview and how to use it.
- Fiddler2 – overview and how to use it.
I’ll give you a brief overview of each tools features, what’s best about them and how you can use them to help with your web diagnostics.
#1 – Firebug NET Panel

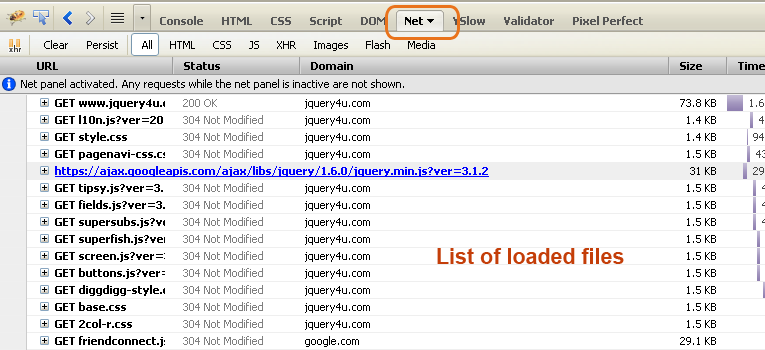
NET Panel is part of the Firebug install and sits under the “NET” tab. The main purpose of the Net Panel is to monitor HTTP traffic initiated by a web page and simply present all collected and computed information to the user. Its content is composed of a list of entries where each entry represents one request/response round trip made by the page.
What’s good about it
- Live viewing of JS files, CSS files, Flash, HTML & images as they are being loaded.
- Waterfall Graph Timeline as files are loaded it displays them
How to use it
As an example I am going to inspect the jQuery file loaded onto my web page. Firstly, load Firebug and open the NET Panel. Then reload your web page. The files should begin to appear in a list as they load.

The NET Panel has an awesome Waterfall Style Chart which shows you load order and load times.

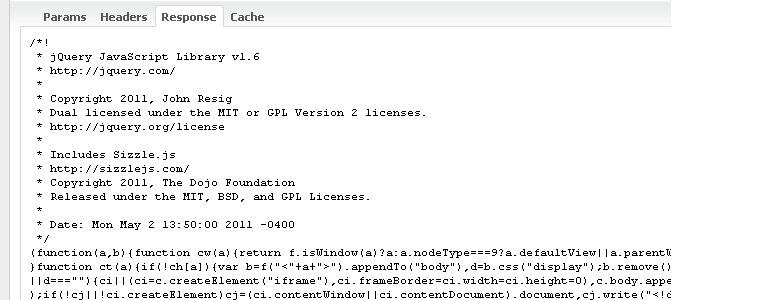
Request Parameters (really useful to see what parameters and values you are sending off in your request).

Request Header Information

Request Response (in the example it is the JavaScript file code, but it could be JSON, HTML, Data or anything returned from the request).

Request Cache Information

Get Firebug (+NET Panel)
#2 – HTTP Fox

HTTP Fox is a Firefox add-on which can be used as an alternative to Firebug’s NET Panel. I prefer HTTP over NET panel for it’s speed & ease of use. HttpFox monitors and analyzes all incoming and outgoing HTTP traffic between the browser and the web servers.
What’s good about it
- Full screen detach option for maximum detail
- Search filter on live results as they come in
How to use it
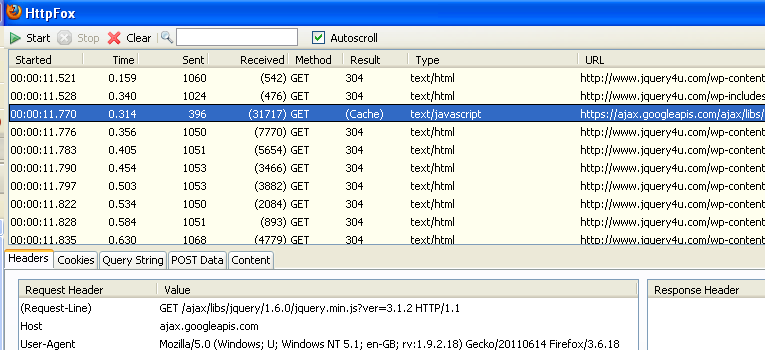
It’s essentially the same process as the NET Panel above but I really do prefer HTTP Fox for it’s speed and ease of use! It’s my favourite for sure and the way I like to use it is to detach it from the main window and have it alongside in a second screen on auto scroll. You can detach it using the button in the bottom right hand of the browser.

When the page is loading the files are listed.

I definitely recommend using filters to find files. In the example below I have found all the PNG images loaded.

Request Cookies

Request Post Data

Sometimes if a file doesn’t load properly it will be highlighted red – great for finding missing files/bad requests!
#3 – Fiddler 2

I have included Fiddler 2 because every web developer should be doing multi browser testing and Fiddler 2 works with any browser, especially IE. Note that Firebug NET Panel and HTTP Fox Mozilla add-ons only work with FireFox, so fiddle.
What’s good about it
- Fiddler2 works with Internet Explorer and other browsers
- Fiddler2 is free
What’s not good about it
- Fiddler2 has extensive options/settings (you probably will only use like 5% of them)
How to use it
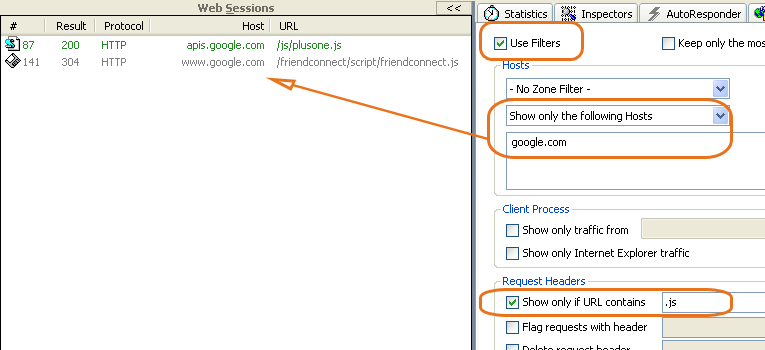
Drag the Process Filter button onto the window you want to track, such as IE.

Select any filters you wish to add:
- Tick use filters (on the filter tab)
- Select “Show only the following hosts”
- Enter the domain you wish to show activity for

Reload the page to load the page requests. You can double click a request in the web sessions window to see its details or Click Inspectors to get the javascript loaded, cookies set, caching and header info.
You have to refresh for the filters to work. Sometimes if it doesn’t work properly, close and reload fiddler and use the launch ie button.
#4 – Wireshark

Wireshark is a powerful network analysis tool and I would only suggest using it if the other options above don’t produce any results for you.
This post was written to help expand the knowledge of web development. It pays to know (and understand) what’s happening behind the scenes when your web page is loading. If you have any comments, or suggestions, they are welcome as always!
Frequently Asked Questions (FAQs) about HTTP Requests and Tools
What is an HTTP request and why is it important?
An HTTP request is a message that a client sends to a server to request access to data or functionality. It’s a fundamental part of the communication process in the World Wide Web. Understanding HTTP requests is crucial for web developers as it allows them to create more efficient and secure web applications. It helps in debugging, optimizing performance, and ensuring the security of web applications.
What is the role of tools like Net Panel, HTTPFox, and Fiddler2 in HTTP requests?
Tools like Net Panel, HTTPFox, and Fiddler2 are used to monitor and analyze HTTP requests and responses. They provide detailed insights into the data being sent and received, the time taken for each request, and the status codes returned by the server. These tools are invaluable for debugging, performance optimization, and security testing.
How do I use HTTPFox for monitoring HTTP requests?
HTTPFox is a Firefox add-on that allows you to monitor and analyze HTTP traffic directly from your browser. After installing the add-on, you can start it from the Tools menu. It will open a new tab where you can see all the HTTP requests made by your browser, along with detailed information about each request.
What is the difference between GET and POST requests?
GET and POST are two different types of HTTP requests. A GET request is used to retrieve data from a server, while a POST request is used to send data to a server. The main difference between them is that GET requests can be cached and bookmarked, while POST requests cannot.
How can I use Fiddler2 to debug HTTP requests?
Fiddler2 is a powerful tool that allows you to capture and analyze HTTP traffic. You can use it to inspect all HTTP requests and responses, set breakpoints, and even modify requests and responses on the fly. This makes it a great tool for debugging and testing web applications.
What are status codes in HTTP requests?
Status codes are part of the HTTP response sent by the server. They indicate the result of the request, whether it was successful, failed, or requires further action. Understanding these codes is important for debugging and handling errors in web applications.
How can I optimize the performance of my web application using these tools?
These tools provide detailed insights into the performance of your web application. You can use them to identify slow requests, optimize resource loading, and reduce the overall load time of your application. They also allow you to test different optimization strategies and measure their impact on performance.
Can these tools help in ensuring the security of my web application?
Yes, these tools can help identify potential security vulnerabilities in your web application. By analyzing the HTTP traffic, you can spot suspicious requests, test for common vulnerabilities, and ensure that sensitive data is properly encrypted.
Are there any alternatives to these tools?
Yes, there are many other tools available for monitoring and analyzing HTTP traffic. Some popular alternatives include Wireshark, Charles, and Postman. Each tool has its own strengths and weaknesses, so the best choice depends on your specific needs and preferences.
Can I use these tools if I’m not a web developer?
While these tools are primarily designed for web developers, they can also be useful for anyone who wants to understand how the web works. They can help you learn about HTTP requests, understand how websites load data, and even troubleshoot problems with your internet connection. However, they do require some technical knowledge to use effectively.
Sam Deering has 15+ years of programming and website development experience. He was a website consultant at Console, ABC News, Flight Centre, Sapient Nitro, and the QLD Government and runs a tech blog with over 1 million views per month. Currently, Sam is the Founder of Crypto News, Australia.


