

I’ve never particularly liked databases.
Don’t get me wrong–I love using them. You know, filling them with data, watching my users fill them with data, deleting my users’ data* … but as long as it’s all from the safety of a server-side programming language–I’ve never been a big fan of interacting with them directly. All that SQL just gives me a headache.
Sure, we’ve come a long way from the SQL command line. We have web-based tools, like phpmyadmin and phpPgAdmin. And if you don’t fancy doing your heavy lifting over http, there are desktop tools like MySQL Query Browser and TOAD. And frameworks like Rails have migrations now, so we’ve got all the tools we need, right?
Well, if your brain works anything like mine does, then you’ll agree that sometimes it’s nice to have a “big picture” view of things–a diagram of your data goes a long way to helping understand how it fits together. If your application only consists of three or four tables, then you may already have one of these sketched out on a bit of paper. But none of the tools I mentioned above can provide us a picture of what our database actually looks like–which tables have foreign key constraints that point where. Once your database schema grows beyond a handful of tables, this can become a significant issue. And if you’ve ever had to get your head around someone else’s schema in a short period of time, you’ll know what I’m talking about–sure, you could try and visualize this in your head, or sketch it out with pen and paper after poking around using a bunch of queries. But now there’s no need to.
DBVisualizer is a slick database client that creates a schema diagram of your database. It’s written in Java, so runs on just about any platform, and it’s dead easy to set up and use. In this post I’ll show you how to install DBVisualizer and use it to produce beautiful schema diagrams of your MySQL database.
To demonstrate how to create your schema diagram, I’ll make a few assumptions:
- You’re able to connect to a MySQL database–either locally or on your production server.
- You have a Java Runtime Virtual Machine installed on your local machine. No problem if you haven’t–you can either download and install one manually or choose a version of the DBVisualizer installer that includes it.
- You already have a schema in your database of which you wish to create a diagram.
- You’re using the InnoDB engine for your tables. You can still create a schema diagram if you’re using MyISAM, but it won’t reflect any foreign key constraints, as these are ignored by MyISAM. If you don’t know, you’re probably using MyISAM.
Follow these instructions:
-
Download
There are a few versions of DBVisualizer. DBVisualizer Free performs all of the visualization coolness, but contains limited features (such as only being able to perform one SQL query at a time–possibly enough to make you want to upgrade to a personal license if you get addicted to the other stuff). The version at the time of writing is 5.1.1.
-
Install
Installing DBVisualizer is as simple as it gets. Whether you’re running Windows, Mac, Linux or a general Unix platform, you have the choice of a wizard-style installer or just unpacking a compressed archive to the folder of your choice. That’s it!
-
Configure
DBVisualizer doesn’t come with a MySQL driver out of the box, but adding one is easy. Download the MySQL JDBC driver, and unzip the archive to a folder of your choice (there’ll be a
jarfile in there somewhere, which is what we’re after).Then launch DBVisualizer and select Driver Manager from the Tools menu.

On the left, select MySQL, and in the User Specified tab of the Driver File Paths form, click the Browse icon and choose the
jarfile that we extracted earlier.
-
Connect
To connect to your database, choose Database > Create Database Connection. You can either follow the built-in connection wizard to establish your connection, or enter it manually. There’s not really much to it; all you need is:
- the server name (usually just
localhost) and port number that your database runs on (usually 3306 for MySQL) - your database username and password
To enter this information manually, set Database Type to MySQL, select MySQL from the Driver (JDBC) dropdown, and enter your Database URL and username/password. The URL will take the format:
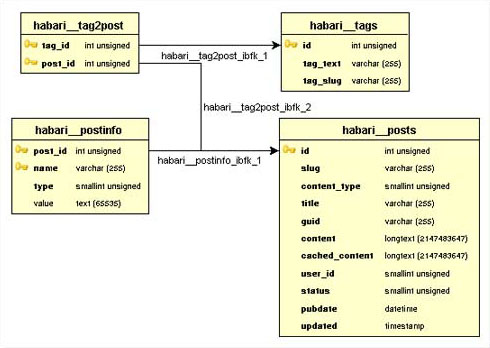
jdbc:mysql://<host>:<port3306>/<schema>I thought I’d take a poke around the schema used by the Habari open source project. After installing it locally, I therefore used the following. The schema can be omitted if you don’t want to specify one by default.
jdbc:mysql://localhost:3306/habariClick Connect, and your connection should be established!
- the server name (usually just
-
Visualize
Now that you’re connected, double-click on the schema you wish to explore, select Tables and then click on the References tab to view your schema diagram (complete with pretty animations). You have some control over what gets included in the diagram, including being able to view the schema using a variety of layouts, zoom in and out, and include or exclude things like column details and foreign key names.

That’s all there is to it! Whether you’re trying to flesh out a schema for an application of your own design, or trying to understand an existing application in order to write a plugin or fix a bug, an application like DBVisualizer can certainly make your database design, development and maintenance a heck of a lot easier.
*I was of course, just joking about deleting my users’ data. Well, mostly.
Frequently Asked Questions (FAQs) about Database Schema Diagrams with DBVisualizer
How can I generate an ER diagram from a database using DBVisualizer?
Generating an ER diagram from a database using DBVisualizer is a straightforward process. First, you need to connect to your database using DBVisualizer. Once connected, navigate to the “Database” tab and select the database you want to generate the ER diagram for. Right-click on the database and select “References Graph”. A new tab will open displaying the ER diagram of your database. You can customize the diagram by adding or removing tables, changing the layout, and adjusting the zoom level.
What is the difference between ER diagrams, ER models, and relational schemas?
ER diagrams, ER models, and relational schemas are all tools used in database design, but they serve different purposes. An ER diagram is a visual representation of the entities in a database and their relationships. An ER model, on the other hand, is a conceptual blueprint of a database, outlining its structure and constraints. A relational schema is a detailed description of how data is organized in a relational database, including tables, fields, and the relationships between them.
How can I show all tables/views in an ER diagram with DBVisualizer?
To show all tables/views in an ER diagram with DBVisualizer, you need to select the “References Graph” option from the “Database” tab. This will generate an ER diagram for the entire database. If you want to include views in the diagram, you need to check the “Include Views” option in the “References Graph” settings.
What is a database schema?
A database schema is a blueprint of a database that outlines the way data is organized and how the relations among them are associated. It represents the logical view of the entire database. It includes tables, the fields in each table, and the relationships between fields and tables.
Can I export my ER diagram from DBVisualizer?
Yes, DBVisualizer allows you to export your ER diagram. You can do this by clicking on the “File” menu and selecting “Export”. You can choose to export the diagram as an image file or as a PDF.
How can I add or remove tables from my ER diagram in DBVisualizer?
To add or remove tables from your ER diagram in DBVisualizer, you need to navigate to the “References Graph” tab. Here, you can select or deselect tables from the “Tables” list to add or remove them from the diagram.
Can I customize the layout of my ER diagram in DBVisualizer?
Yes, DBVisualizer allows you to customize the layout of your ER diagram. You can do this by adjusting the “Layout” settings in the “References Graph” tab. You can choose between different layout styles, adjust the zoom level, and rearrange the tables manually.
Can I use DBVisualizer with different types of databases?
Yes, DBVisualizer is a universal database tool that supports a wide range of databases, including MySQL, Oracle, PostgreSQL, SQL Server, and many others.
How can I connect to a database using DBVisualizer?
To connect to a database using DBVisualizer, you need to create a new database connection. You can do this by clicking on the “Connections” menu and selecting “Create a New Connection”. You will then need to enter your database details, including the database type, host, port, database name, username, and password.
Can I use DBVisualizer for database administration tasks?
Yes, besides generating ER diagrams, DBVisualizer also provides a wide range of database administration features. These include browsing and editing data, running SQL scripts, managing database objects, and much more.