Debugging with Xdebug and Sublime Text 3

Debugging – we all do it a lot. Writing code perfectly the first time around is hard and only a few (if any) succeed at it. More than a year ago, Shameer wrote an article on SitePoint about how you can debug your application using Xdebug and Netbeans. In this article, we are going to have a look at how we can debug using Xdebug in combination with Sublime Text.
Key Takeaways
- To debug with Xdebug and Sublime Text 3, the PHP Xdebug extension needs to be installed and Sublime Text 3 should be configured with the Xdebug package installed through package control.
- Xdebug must be configured in the php.ini file or in an xdebug.ini file with specific settings, and then the webserver should be restarted.
- For Sublime Text 3, the project must be set up, and the URL of the web application should be added to the project file settings. This allows debugging on multiple projects without having to change the Xdebug config each time.
- The Xdebug session can be started, and breakpoints can be set where the application will halt. From there, variables can be inspected, and the application can be run until the next breakpoint or until the end using various commands such as “Run”, “Step into”, “Step over”, and “Step out”.
Getting started
First of all, we need to have the PHP Xdebug extension installed. If you are uncertain on how to get this done, please have a look at the link provided in the introduction. Make sure that Xdebug is working by checking if it’s listed in your phpinfo().
Of course we also need Sublime Text. I will be using the latest version: Sublime Text 3. It should also work with Sublime Text 2.
Setting up Xdebug
We need to configure xdebug by adding the following to your php.ini file, or even better, to an xdebug.ini file as described here under How-to On Linux.
xdebug.remote_enable=1
xdebug.remote_handler=dbgp
xdebug.remote_host=127.0.0.1
xdebug.remote_port=9000
xdebug.remote_log="/var/log/xdebug/xdebug.log"
In general you will be using 127.0.0.1 as your host. However, If you are using vagrant for example, you will be using something like 10.0.2.2, depending on where Xdebug can find your system.
The remote log is not necessary, but in case of problems, it’s the place where you can find information about errors that occurred.
Don’t forget to restart your webserver!
Setting up Sublime Text 3
One of the strengths of Sublime is the fact that you can extend it easily with packages. In this case, we are going to install the Xdebug package. If you haven’t done so already, make sure you can install packages by installing package control.
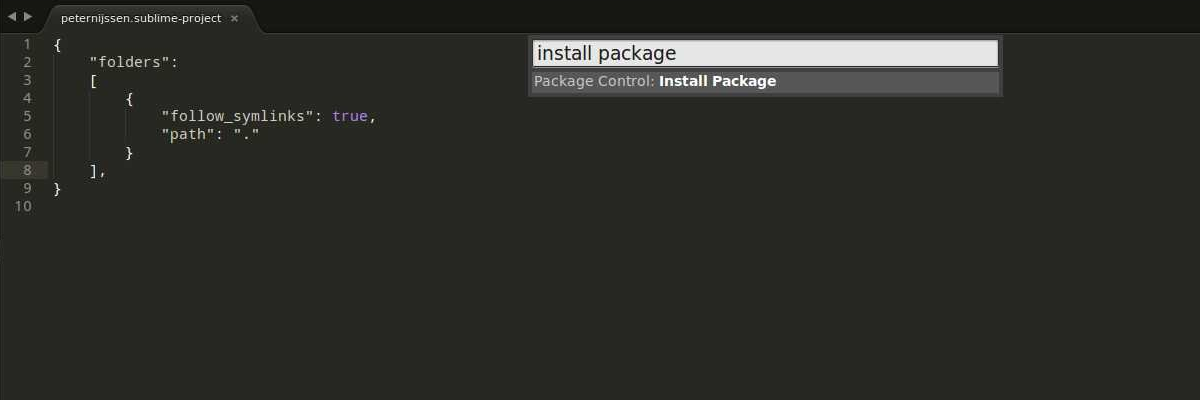
Once you have the package control installed, you should start Sublime Text 3. Open up the command palette from the tools menu and search for “install package”.
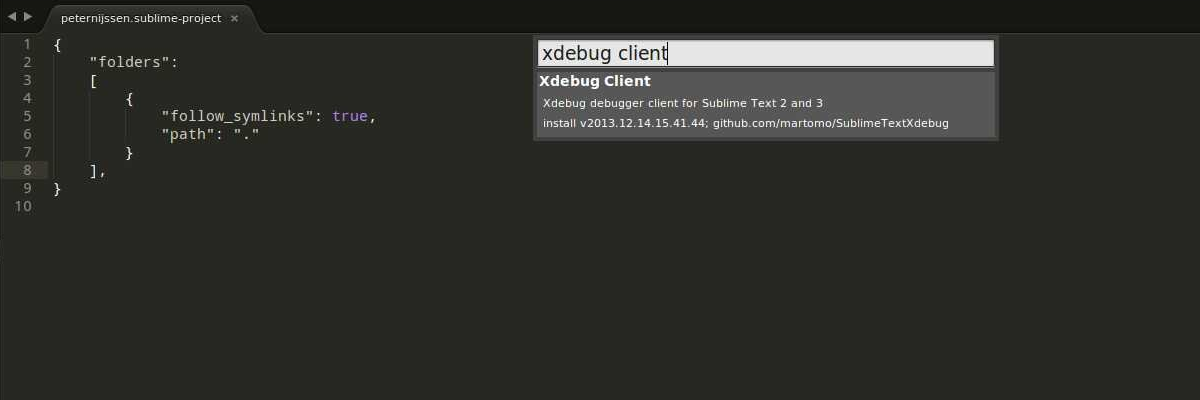
Now you can search for any package you like. In our case, we are going to search for the package “Xdebug client”.
The last bit we have to do is set up the project within Sublime. The easiest way to do this is to open up the root directory of your application, go to projects and click on “save projects as”. I suggest you save the file within the root of your application, so you can save it in your version control system if you are using any and you can configure it easily at all times.
Open up the just created project file. The content will look like this:
{
    "folders":
    [
        {
           "follow_symlinks": true,
           "path": "."
        }
    ]
}
We are going to add a few more lines:
{
    "folders":
    [
        {
            "follow_symlinks": true,
            "path": "."
        }
    ],
    "settings": {
        "xdebug": {
             "url": "http://my.local.website/",
        }
    }
}
As you can see, I only added a URL to my actual web application. I could set more settings for Xdebug, however, this is enough to start with. I could have also set this URL in the Xdebug settings itself, but in that case, I couldn’t work on multiple projects without having to change the Xdebug config each time.
Start the Xdebug session
We can now start the Xdebug session to see if everything is set up properly. In the menu, click on tools -> Xdebug and click on start debugging (launch browser). You will notice that your website is opened up and that ?XDEBUG_SESSION_START=sublime.xdebug is added to the end of the URL. This will start the xdebug session. In Sublime, some extra panels appear where debug information will be shown, after you have set one or more breakpoints.
Breakpoints
Let’s set out first breakpoint. A breakpoint is basically a flag where your application will halt when it reaches it. At the moment it halts, you can inspect all the variables’ values so you know actually what is going on.
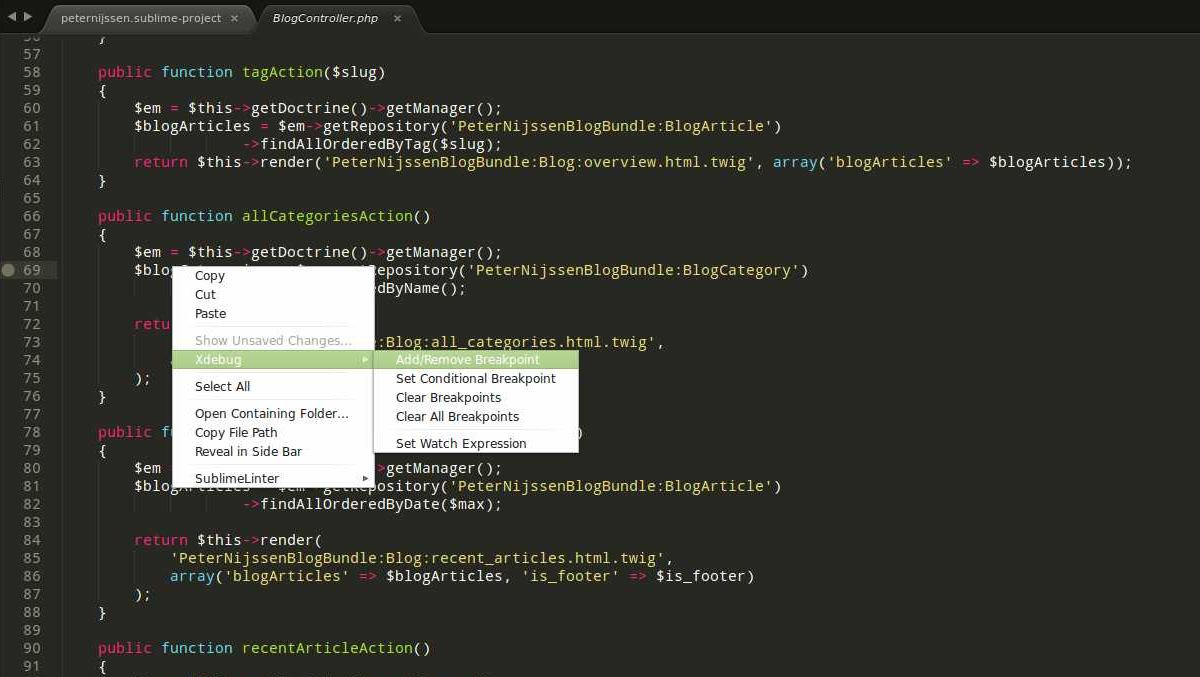
We can add a breakpoint by clicking with our right mouse on a line, going to Xdebug and then clicking on add/remove breakpoint. A marker will be added to the line gutter to indicate that a breakpoint has been set.
We open up our browser again and continue with the session we just started. You will notice that as soon as you go to the page where the breakpoint is, the page will stop loading. If you now open up Sublime, you will see a lot of information shown in the Xdebug panels.
The Xdebug stack and Xdebug context are very interesting. In the stack, you can see the whole stacktrace your call went through.
In the context, you will see all global variables, but also the variables you defined yourself. You can click on these variables to see exactly these variables are holding. For instance, in the screenshot below, I clicked on the $_SERVER variable.
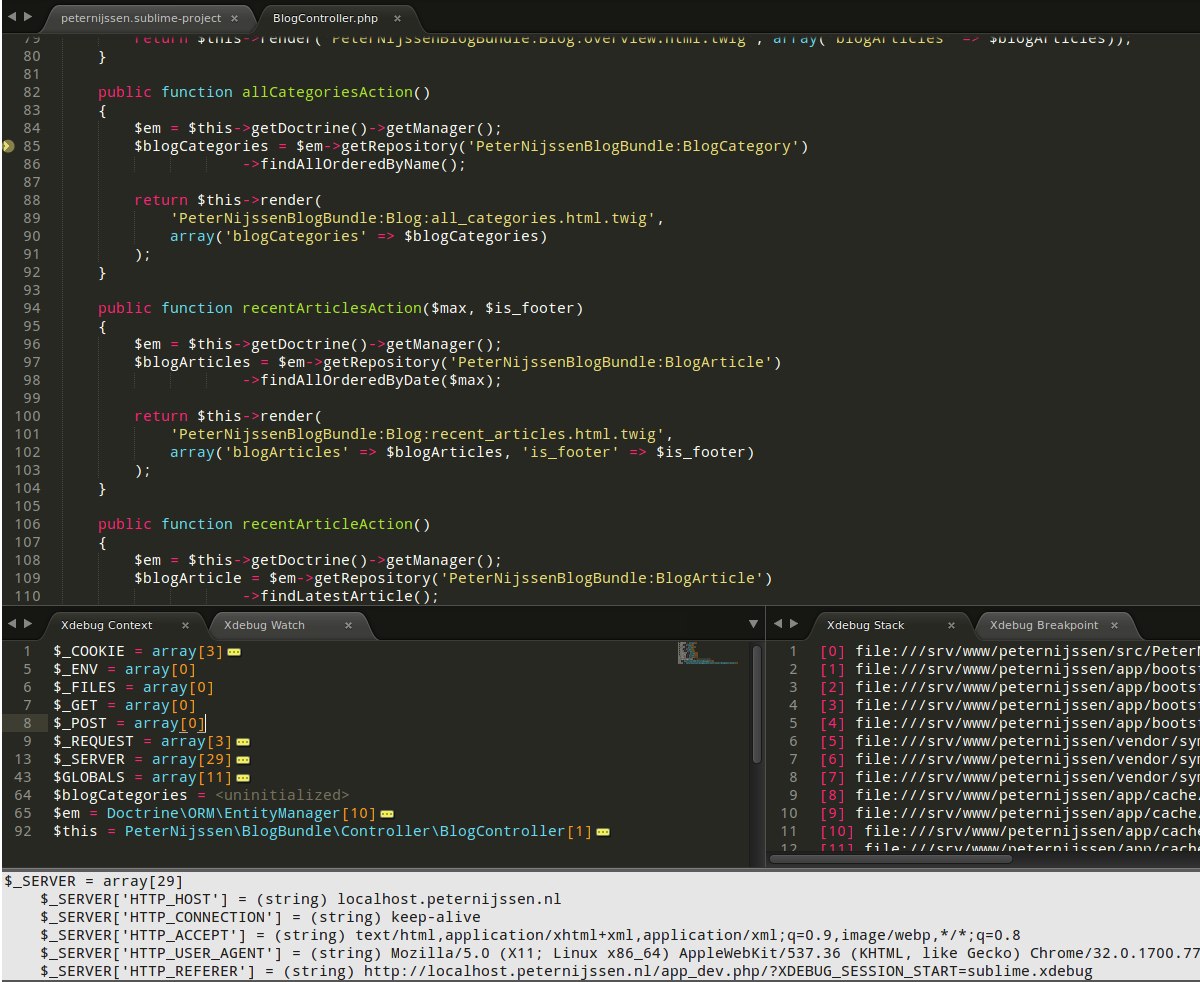
Notice that a yellow arrow is pointing at the line the application is currently halted on.
So our application halted and now we can look through the variables defined. However, we are done and we want to move on. What now? When you right mouse click once again and hover over the Xdebug menu, you will have several options:
- Run Which will run the application until the next breakpoint or until the ending.
- Run to line which will run until the line you clicked.
- Step into will step into the current function and stops right after.
- Step over Will step over the current function and stops right after.
- Step out Will step out of the current function and stop right after.
- Stop Will stop debugging.
- Detach Will also stop debugging.
Run and stop are quite easy to understand. The step methods could be a little confusing. Let’s dive into these with a simple example.
Class Foo()
{

    public function bar(Array $arr)
    {
        $arr = self::fooBar($arr); // Breakpoint
        return $arr;
    }

    public function fooBar(Array $arr)
    {
        return array_values($arr);
    }
}
Imagine you added a breakpoint to the first line of the method bar. So on the line with the breakpoint comment (// breakpoint).
With step into, the debugger will step into the fooBar method and will stop there at the first line. So in this case, the debugger will halt on the return array_values($arr); line.
Step over will call the method, but will not stop. It will stop at the next line available after calling the method. So in this case, it will stop at return $arr;
Lastly, with step out it will run through the whole bar method and return to the caller. In this case, it will go out of the object, back to the original caller.
If you just decide to run, the application will run further until the moment it is done executing or another breakpoint occurs.
Conclusion
In this article we saw how we could integrate Xdebug with Sublime and made sure we understood how to debug. Almost every IDE suitable for PHP can integrate with Xdebug. If you are interested in debugging like this in Netbeans, have a look at the article mentioned in the introduction. Are you using breakpoints? Or are you using PHP functions like var_dump to get your debug data? Let us know in the comments below!
Frequently Asked Questions (FAQs) about Debugging with Xdebug and Sublime Text 3
How Do I Install Xdebug for Sublime Text 3?
To install Xdebug for Sublime Text 3, you first need to install the Xdebug PHP extension. This can be done by downloading the appropriate DLL file from the Xdebug website and adding it to your PHP extensions directory. After that, you need to modify your php.ini file to include the Xdebug extension. Once the Xdebug PHP extension is installed, you can install the Xdebug package for Sublime Text 3 using Package Control.
How Do I Configure Xdebug for Sublime Text 3?
Configuring Xdebug for Sublime Text 3 involves modifying your php.ini file and your Sublime Text 3 settings. In your php.ini file, you need to set the xdebug.remote_enable and xdebug.remote_autostart settings to 1. In your Sublime Text 3 settings, you need to specify the path to your PHP executable and the port number that Xdebug should use for communication.
Why Isn’t Xdebug Working in Sublime Text 3?
If Xdebug isn’t working in Sublime Text 3, there could be several reasons. One common issue is that the Xdebug PHP extension isn’t installed or configured correctly. Another issue could be that the Xdebug package for Sublime Text 3 isn’t installed or configured correctly. It’s also possible that there’s a problem with your PHP or Sublime Text 3 settings.
How Do I Use Xdebug to Debug PHP Code in Sublime Text 3?
To use Xdebug to debug PHP code in Sublime Text 3, you first need to set a breakpoint in your code. This can be done by clicking in the gutter next to the line of code where you want the breakpoint. Once the breakpoint is set, you can start the debugging session by selecting “Start Debugging” from the Xdebug menu.
Can I Use Xdebug with Sublime Text 3 on a Mac?
Yes, you can use Xdebug with Sublime Text 3 on a Mac. The process for installing and configuring Xdebug on a Mac is similar to the process for Windows, but there are some differences. For example, the location of the php.ini file and the PHP extensions directory may be different.
How Do I View Variable Values with Xdebug in Sublime Text 3?
To view variable values with Xdebug in Sublime Text 3, you need to use the “Watch” feature. This allows you to specify variables that you want to monitor during the debugging session. When a watched variable changes, its new value is displayed in the Xdebug panel.
Can I Step Through Code with Xdebug in Sublime Text 3?
Yes, you can step through code with Xdebug in Sublime Text 3. This is done using the “Step Over”, “Step Into”, and “Step Out” commands. These commands allow you to control the execution of your code line by line, making it easier to identify and fix bugs.
How Do I Stop a Debugging Session in Sublime Text 3?
To stop a debugging session in Sublime Text 3, you can use the “Stop Debugging” command from the Xdebug menu. This will end the debugging session and return control to Sublime Text 3.
Can I Debug Remote PHP Applications with Xdebug and Sublime Text 3?
Yes, you can debug remote PHP applications with Xdebug and Sublime Text 3. This requires additional configuration, including setting the xdebug.remote_host and xdebug.remote_port settings in your php.ini file.
How Do I Update Xdebug in Sublime Text 3?
To update Xdebug in Sublime Text 3, you need to update the Xdebug PHP extension and the Xdebug package for Sublime Text 3. The Xdebug PHP extension can be updated by downloading the latest DLL file from the Xdebug website and replacing the existing DLL file in your PHP extensions directory. The Xdebug package for Sublime Text 3 can be updated using Package Control.
Peter is a software architect from the Netherlands. He freelanced for more then 6 years as a web developer, and meanwhile, he graduated as software engineer with honors. He decided to join CMNTY Corporation which specializes in creating community software and is now responsible for the ongoing development of multiple web applications as well as mobile applications. Peter believes a real developer is able to combine multiple techniques together to make sure the user receives the ultimate experience and enjoys using the application. In his free time, he loves to play board games with anyone who is interested. He especially has a passion for cooperative board games.