Create Free Customized Maps For Your Sites With Polymaps
Polymaps is a free service offering web designers and developers a JavaScript library for making dynamic, interactive maps in web browsers. Polymaps can be used in conjunction with cartography from Bing, OpenStreetMap, CloudMade and more. The site was created by Stamen Design and geodata firm SimpleGeo.
Polymaps uses Scalable Vector Graphics (SVG) to display information on top of existing maps. Because the data can be loaded at a range of scales, the information can be shown at many levels, from Country level down to individual streets. Designers and developers can style and design the data using Cascading Style Sheets.
Users can set which direction is north on a map, zoom in to see the quality of a street surface and group data into clusters. Static map images can be overlaid with data sets and colorful presentations using vector data.
To publish information on map images, Polymaps uses the spherical mercator tile format. The what? To quote from the Open Street Map wiki, “QuadTiles are a geo-data storage/indexing strategy. The idea is to store a geo-database such that data for a specific location can be retrieved quickly, by dividing the data up by location, partitioning the world into tiles.”
Here’s a few examples from the site showing some ideas of how you might use the tools for your own needs:


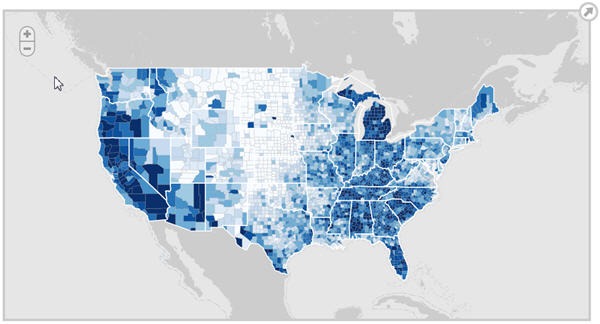
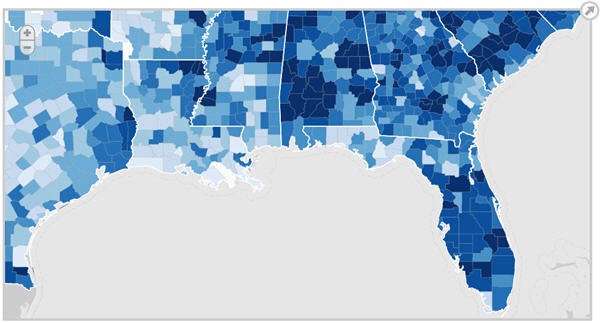
These maps of the United States show unemployment rates in over 3000 counties using a choropleth map. Users can zoom in for higher resolution and to see county names and numbers. The map background is a monochrome image layer from CloudMade.

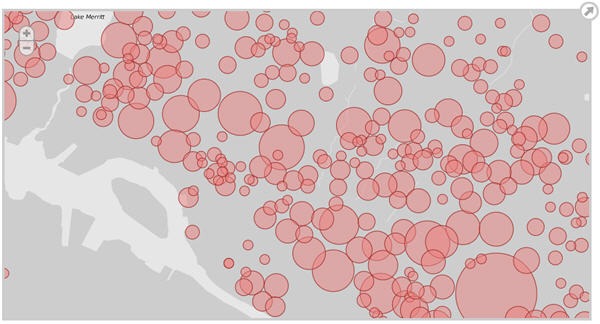
A cluster map is used to visualize discrete events across time and space. This map uses k-means clustering to coalesce dots and visualize the density of crime in Oakland.

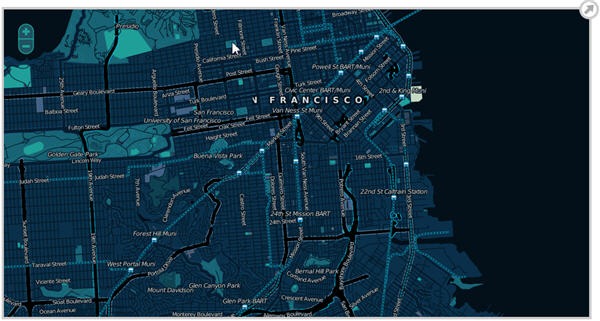
Customized San Francisco map constructed using a single image layer of CloudMade tiles.
The Polymaps site includes the library download, documentation and sample source code showing how to implement the maps on your site.
Frequently Asked Questions about Creating Customized Maps with Polymaps
How can I get started with Polymaps?
To get started with Polymaps, you need to download the Polymaps library from the official website or GitHub. Once downloaded, you can include it in your HTML file. You will also need to include the D3.js library, which Polymaps uses for geographic projection and SVG generation. After setting up, you can start creating your map by defining the size, center, and zoom level. You can then add layers to your map, such as a base layer for the geographical features and an overlay layer for the data you want to visualize.
What kind of data can I visualize with Polymaps?
Polymaps is a versatile tool that can visualize a wide range of data. It supports both image and vector-based data, allowing you to create maps with different levels of detail. You can use it to display geographical data, such as the boundaries of countries or states, as well as statistical data, such as population density or climate data. You can also use it to create interactive maps that allow users to zoom in and out and pan around.
Can I customize the appearance of my map with Polymaps?
Yes, Polymaps provides a high level of customization. You can change the colors, shapes, and sizes of the elements on your map to represent different data values. You can also add interactivity, such as tooltips and click events, to make your map more engaging. Furthermore, you can use CSS to style your map and control its appearance.
How can I add interactivity to my map with Polymaps?
Polymaps allows you to add interactivity to your map through event handlers. You can add events such as mouseover, mouseout, and click to the elements on your map. For example, you can display a tooltip with more information when the user hovers over a certain area, or you can change the appearance of an area when the user clicks on it.
Can I use Polymaps with other JavaScript libraries?
Yes, Polymaps is designed to work well with other JavaScript libraries. It uses D3.js for geographic projection and SVG generation, but you can also use it with other libraries such as jQuery for DOM manipulation or Leaflet for additional mapping features.
How can I add a base layer to my map with Polymaps?
To add a base layer to your map, you can use the add method of the map object. You can specify the source of the base layer, such as a tile server or a GeoJSON file, and you can also specify the style of the base layer, such as the colors and shapes of the geographical features.
How can I add an overlay layer to my map with Polymaps?
To add an overlay layer to your map, you can use the add method of the map object, just like with the base layer. However, for the overlay layer, you can also specify the data you want to visualize and the way you want to visualize it. For example, you can use different colors or sizes to represent different data values.
Can I use Polymaps for commercial projects?
Yes, Polymaps is released under the BSD license, which allows you to use it for both personal and commercial projects. However, you should always check the terms of the license before using it to make sure it fits your needs.
How can I contribute to the development of Polymaps?
Polymaps is an open-source project, so you can contribute to its development by reporting bugs, suggesting new features, or even submitting your own code. You can do this through the project’s GitHub page.
Where can I find more resources to learn about Polymaps?
You can find more resources on the official Polymaps website, including a detailed API reference and examples of maps created with Polymaps. You can also find tutorials and articles on other websites and blogs. Additionally, you can ask questions and get help from the community on forums and discussion boards.
Jennifer Farley is a designer, illustrator and design instructor based in Ireland. She writes about design and illustration on her blog at Laughing Lion Design.
Published in
·Canvas & SVG·Design·Design & UX·HTML & CSS·HTML5·Illustration·Technology·January 21, 2015


