


Key Takeaways
- Microsoft Visual Studio App Center’s Continuous Monitoring and Learning features provide a centralized platform for analytics and crash reporting, supporting multiple platforms including iOS, Android, Windows, macOS, Xamarin, and React Native.
- App Center Analytics provides crucial data about user language settings, the country of use, and device and OS usage, informing decisions about app version adoption, localization needs, and device capabilities assumptions during development.
- Custom Events in App Center Analytics allow tracking of specific events unique to an app, providing insights into user-triggered events and their contexts.
- App Center allows the export of all Analytics data into Microsoft Azure for more detailed insights and the creation of custom analytics dashboards.
- App Center Crash Reporting notifies developers of app crashes, gathers crash data, and integrates with bug trackers like GitHub and Visual Studio Team Services, automatically creating issues for every crash instance.
This article was created in partnership with Microsoft. Thank you for supporting the partners who make SitePoint possible.
App development is an iterative process, the work you do on version 2 of an app is largely based on the things you learned from building and releasing version 1. In order for your development efforts to be focused in the right direction, they must be data-driven: your app’s usage data, rather than your personal hunches, should inform your selection of the features and bugs you decide to dedicate your limited amount of time and efforts to.
Microsoft Visual Studio App Center’s Continuous Monitoring and Learning features are the best tools to help you learn how your app users use your app, seamlessly centralizing all your Analytics and Crash Reporting needs in a single place, supporting any platform and framework you may need, including iOS, Android, Windows, macOS, Xamarin, and React Native.
In this tutorial, we’ll see the different powerful tools it offers you to understand your users’ behavior on the iOS version of your app. Let’s dive in!
Note: Your app must target iOS 8.0 or above. You also need Xcode 8+ and CocoaPods. If you’re following this tutorial to integrate the App Center SDK into an existing app cannot use any other crash reporting library.
Create your app in the App Center Portal
(Skip this step if you already created your app in App Center.)
App Center needs to know about your app in order to receive and process its usage data, so we’ll create a record for your app in App Center (much like we do in iTunes Connect).
- Visit appcenter.ms.
- Sign up for a new account or sign in with GitHub, Microsoft, Facebook, or Google.
- Once you’re in, click on Add New App, select iOS as the OS, and Objective-C/Swift as the platform.
- Now that the app is created in App Center, click on it, then click on its Settings section.
- Note your app’s App Secret on the top right section of the screen, you’ll need it in a little bit.
Adding the App Center SDK
(If you haven’t yet integrated CocoaPods into your Xcode project, close Xcode and run pod init in your project directory)
App Center has a modular architecture, which means you can integrate just the feature you’re interested in.
- Open your project’s Podfile and add this dependency:
pod 'AppCenter'That line will integrate both App Center Analytics and Crash Reporting into your app, as this tutorial will cover both. If you wish to specify just one of those services, you could add
pod 'AppCenter/Analytics'orpod 'AppCenter/Crashes'as required. - Run
pod install:$ pod install Analyzing dependencies Downloading dependencies Installing AppCenter (1.0.1) Generating Pods project Integrating client project [!] Please close any current Xcode sessions and use `MyAppName.xcworkspace` for this project from now on. Sending stats Pod installation complete! There is 1 dependency from the Podfile and 1 total pod installed.Run
pod repo updateif CocoaPods complains that it can’t find a specification for AppCenter. - Open your app’s AppDelegate.swift file (if you just integrated CocoaPods, make sure you open the .xcworkspace file instead of the .xcodeproj, and add these lines at the top:
import AppCenter import AppCenterAnalytics import AppCenterCrashes - Look for the
didFinishLaunchingWithOptionsmethod and add this line:MSAppCenter.start("{App Secret}", withServices: [MSAnalytics.self, MSCrashes.self])Replace
{App Secret}with your app’s App Secret, which you noted down earlier on.
And that’s all you need to do to integrate App Center into your app.
App Center Analytics
We’ll now fast-forward into the future. Your users have been using your app for a little while now, App Center gathered and processed usage data. Let’s take a look at what App Center reports:
Overview Page
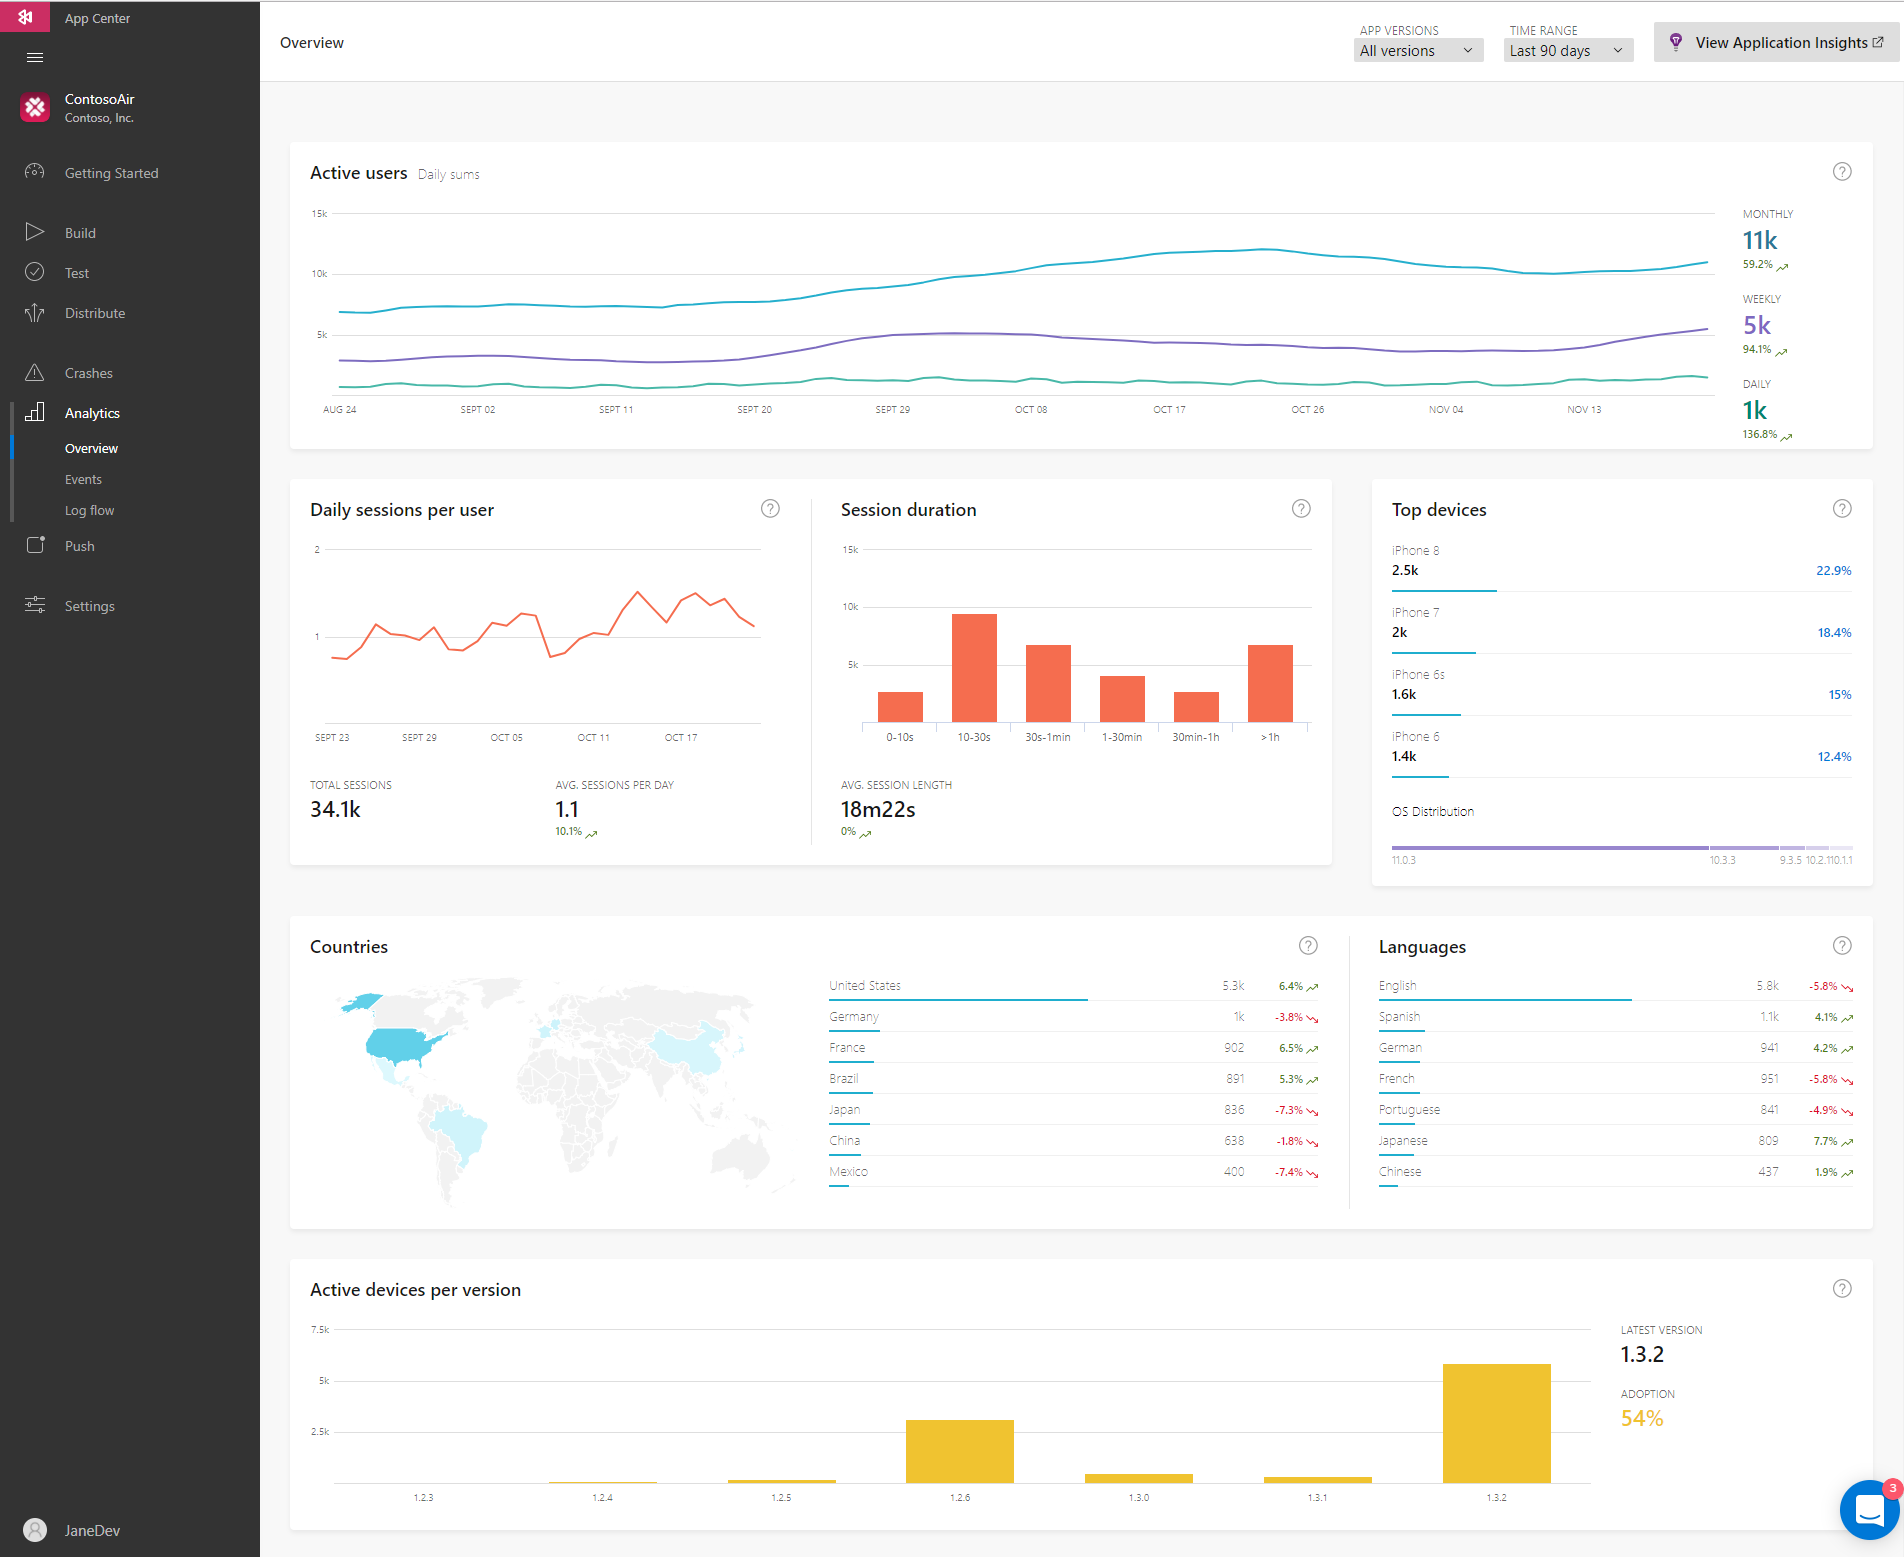
This dashboard allows you to see the most important data about your app users at a glance.
The Active users section shows you how many unique app installations launched the app in the last day, week (7 calendar days), or month (30 calendar days). Note that you have a graphical representation of the statistic, as well as numerical summaries. So in our example above, the chart seems to show that the number of daily users remained constant throughout the months of September and November, but there was in fact a 136.8% increase in that number. You can verify that by hovering your mouse over the line and reading the numbers at each point in time from the pop-up.
Daily sessions per user and Session duration give you information about how many sessions your users carry out in your app, and their duration. App Center defines a “session” as “the time from the app coming to foreground to the last event before going to the background”.
The other three sections of the overview page give you crucial data about the language your users have set their device to, the country they use the app from, and which devices and OSes they are using. This data helps you answer important questions about whether your users are adopting your latest app version, if there is a need for a new localization of your app, and what device capabilities are safe for you to generally assume during development.
Custom Events
One powerful feature of Analytics is tracking specific events unique to your app. These are usually (but not necessarily) events triggered by the user. For example, you may want to know when the user taps a specific button. You may also want to know more about the context of when that event happened.
In order to track a particular event, use the trackEvent:withProperties method in this way:
MSAnalytics.trackEvent("Viewed Product", withProperties: ["ID": "23432", "Name": "Bacon Burger"])
Make sure to add import AppCenterAnalytics to the top of any source code files calling that method!
Stringly-typed caveats
The App Center SDK distinguishes events based on the String you ascribe to them. In the example above, the event was "Viewed Product", but note that this is a different event than "Product Viewed". If you’ll track the same event from more than one place in your code, it’s a good idea to define these event strings as constants.
One of the ways to do this is via a simple AnalyticsConstants class:
class AnalyticsConstants {
    static let ViewedProduct = "Viewed Product"
    static let SuccessfulOrder = "Order Successful"
    // ... etc
}
Which you’d use thus:
MSAnalytics.trackEvent(AnalyticsConstants.ViewedProduct, withProperties: ["ID": "23432", "Name": "Bacon Burger"])
You could also go further and define a trackProductView method in AnalyticsConstants for wrapping the entire MSAnalytics.trackEvent method call.
Viewing Events in App Center
Shortly after that method is called at runtime, you’ll see the event displayed in App Center:
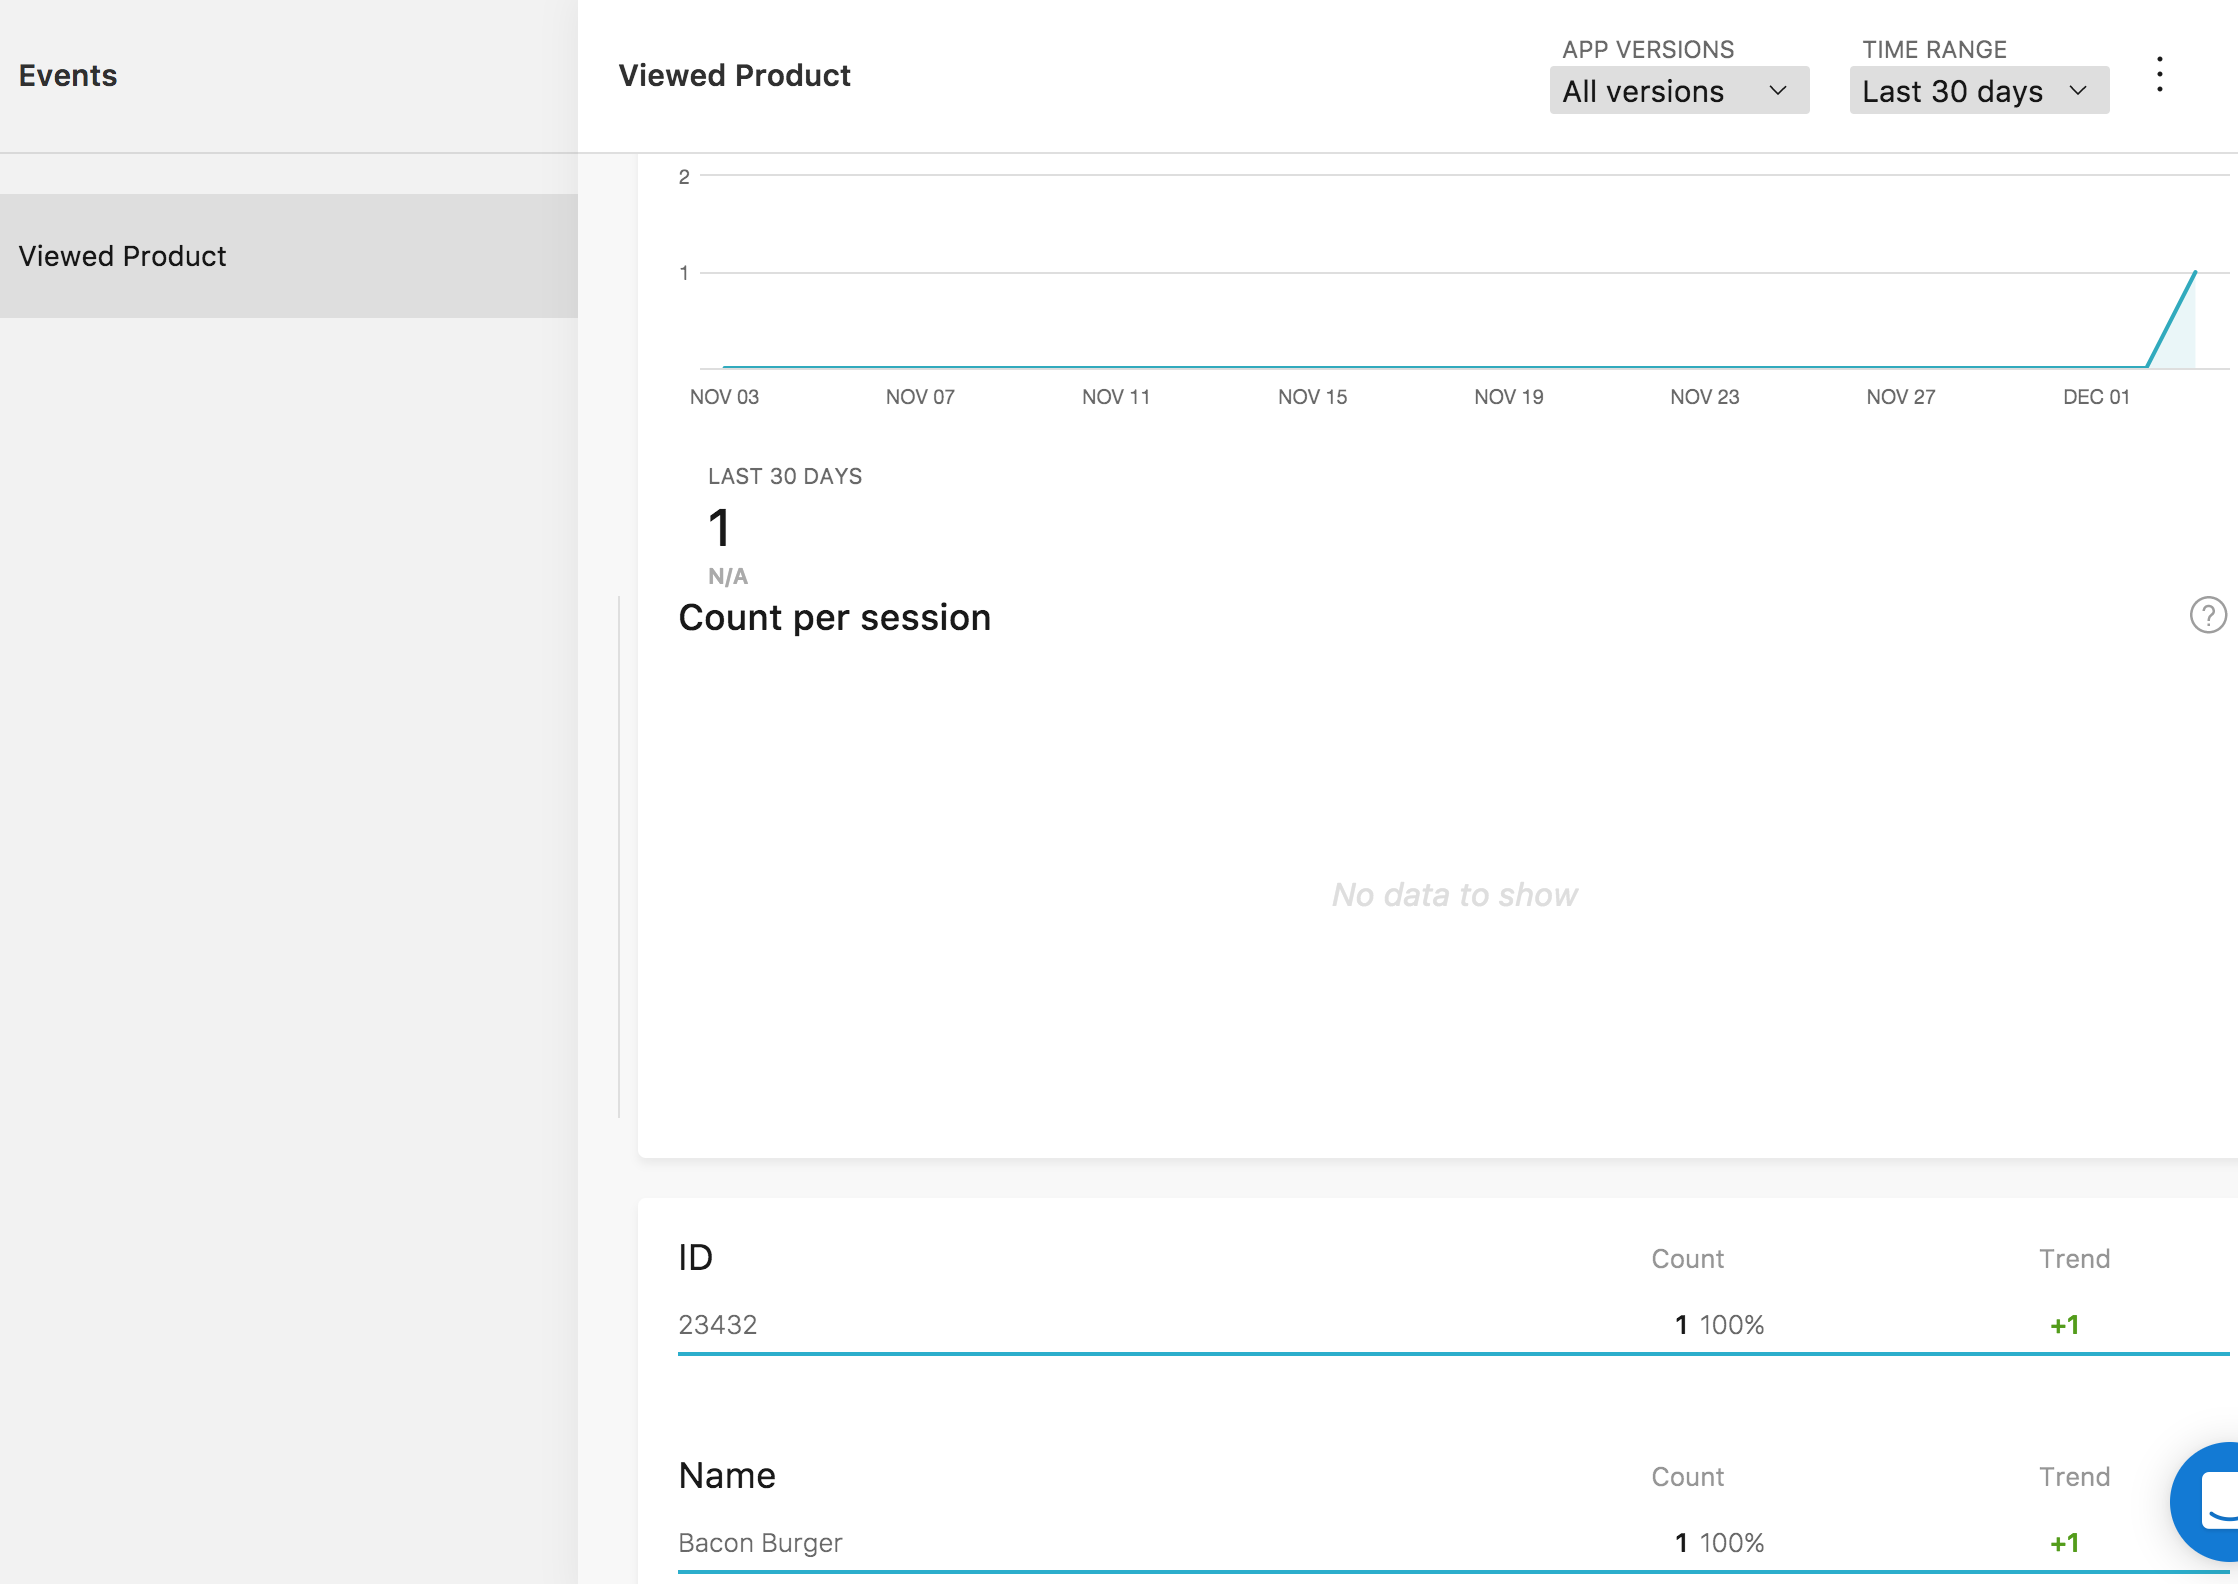
App Center keeps track of how many times a specific event was triggered, and differentiates between the same event if it had different contextual values.
The Trend refers to how much the count has changed compared to the previous time range. In this case the time range is “Last 30 days” (indicated in the top right corner of the screen), and since we triggered the event just now for the first time and never before in the last 30 days, the trend is +1.
We can also see a bigger picture of all the events in our app:
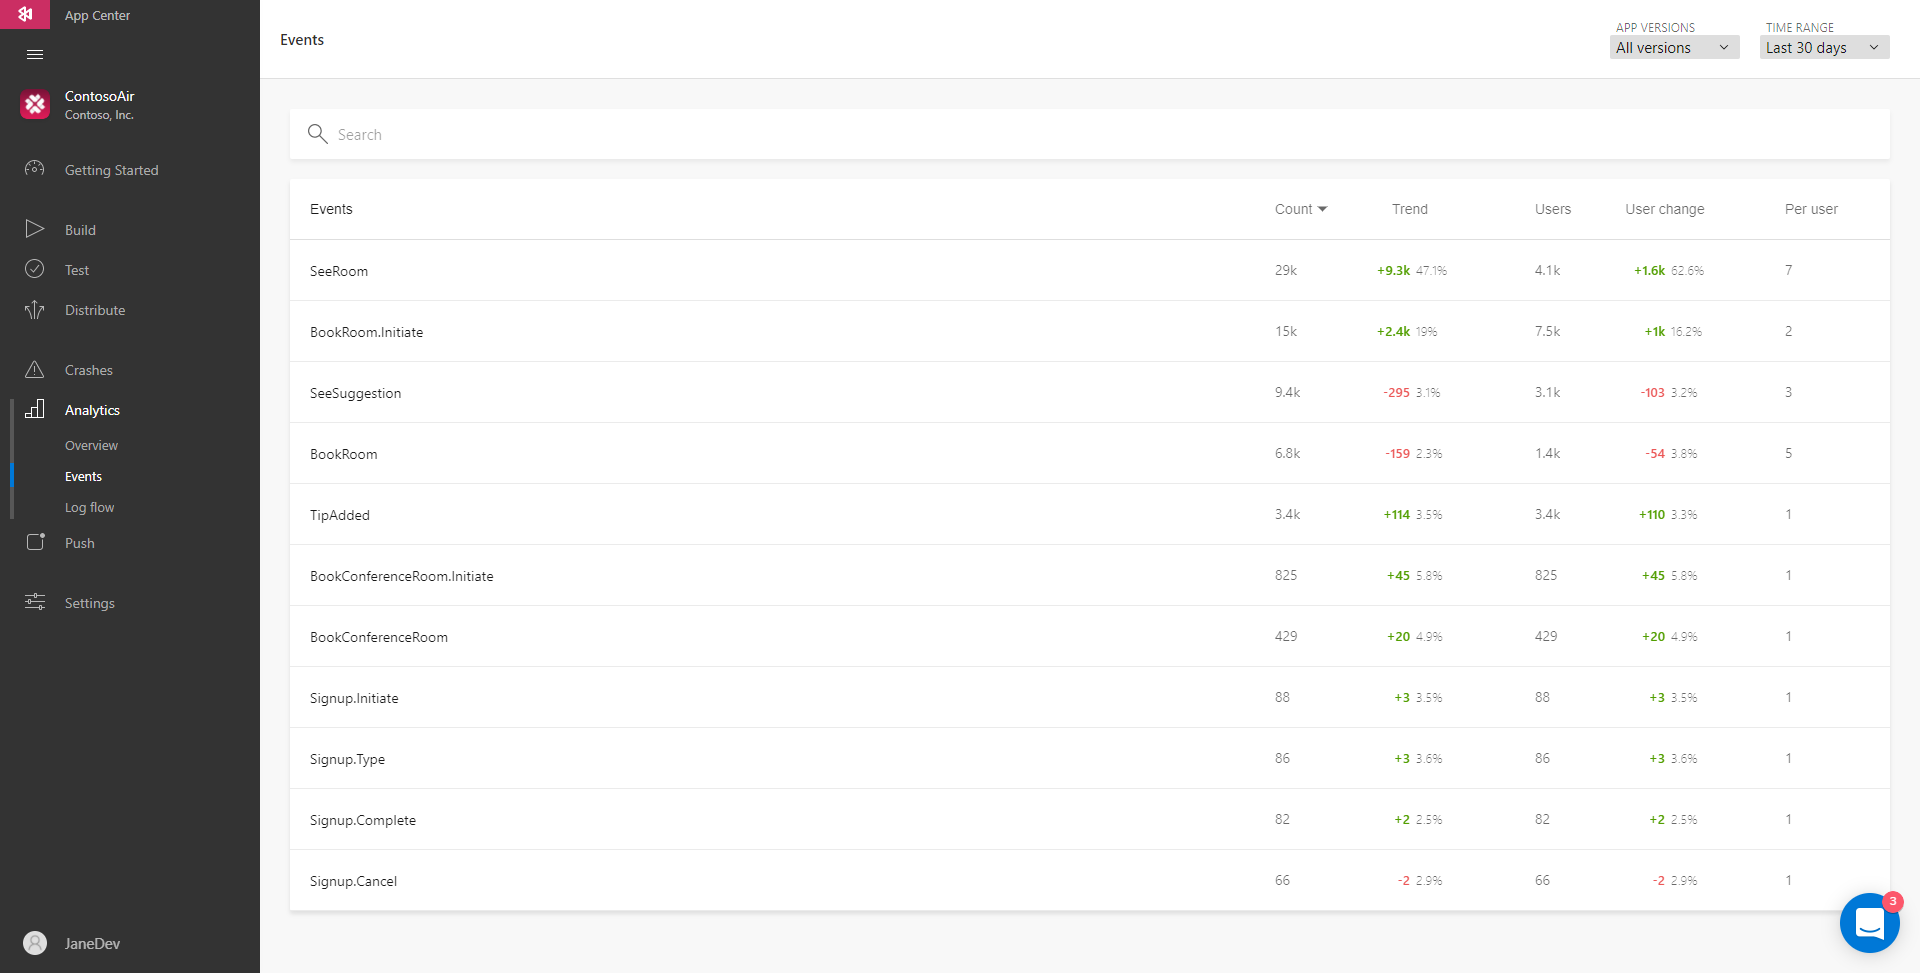
This overview will tell you how many times an event has been triggered as well as the number of users who triggered it. Similar to Trend, User change refers to how much the number of users triggering the event has changed compared to the last time range. Per user refers to how many times, on average, users trigger that event.
Exporting to Azure
App Center lets you take this further. If you want even more fine-grained insights from your data, or build your own custom analytics dashboards, App Center allows you to export all your Analytics data into Microsoft Azure.
Microsoft Azure is an enterprise-grade cloud computing platform that comes with Application Insights, an even more powerful application performance management and monitoring solution. Among its features are detailed dashboards and performance monitoring solutions using machine learning.
To see what’s possible, in App Center, click on Settings then on Export.
App Center Crash Reporting
There are times when, sadly, things in your app don’t go as expected, and… it crashes. The whole point of Crash Reporting is to make sure you’re aware of when your app crashes, gather data about the crash, and ultimately fix its root cause so that it doesn’t happen again. App Center’s Crash Reporting features lets you do just that. Let’s take a look at it.
For Crash Reporting functionality to work, ensure that your app isn’t using any other Crash Reporting library.
Setup
- In Xcode, select your iOS Device as a build target, then do Project –> Archive. The Organizer should open upon successful completion.
- In the Organizer’s, right-click on the archive and select Show in Finder.
- Right click in the .xcarchive of your app and select Show Package Contents.
- You’ll find the dSYM in the dSYM directory:
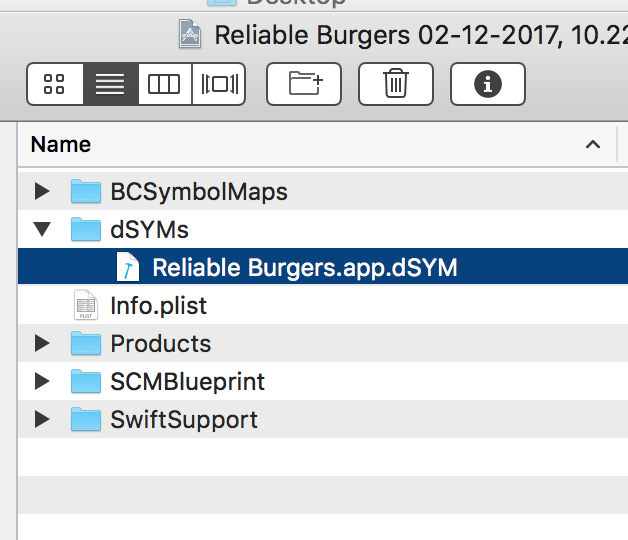
- Right-click on it, select Compress…
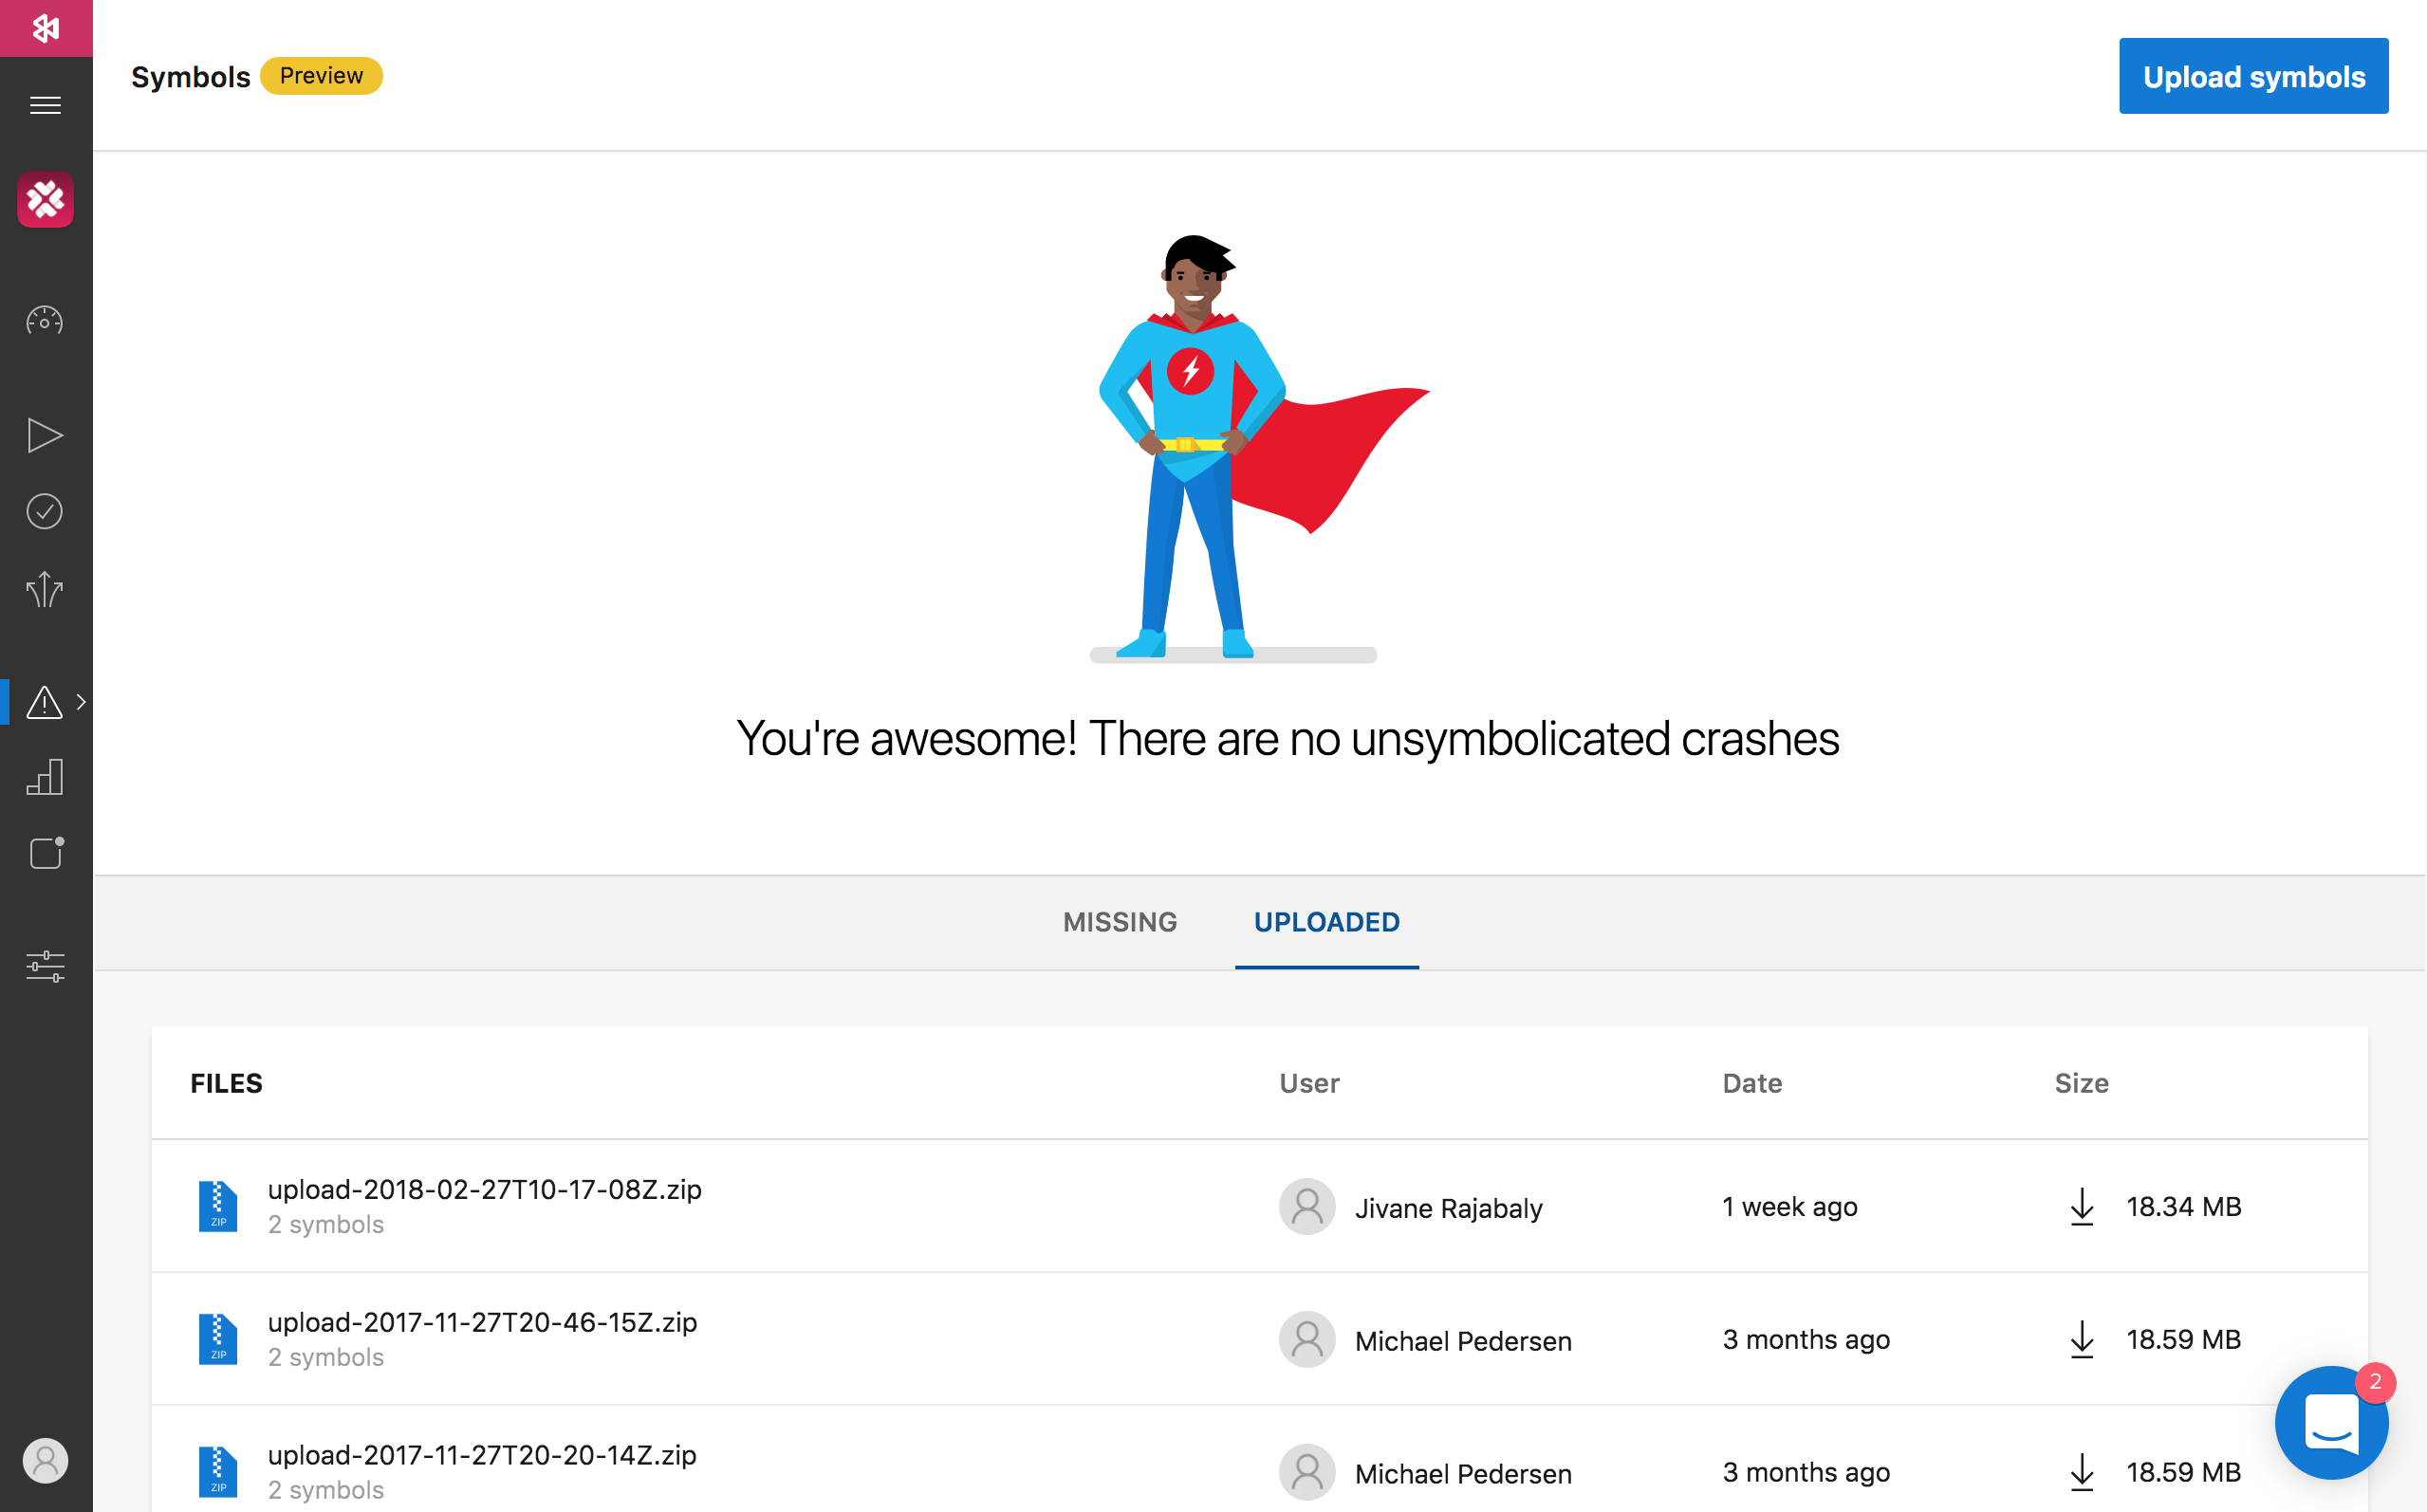
- In App Center’s left-hand column, select Crashes, then Symbols, then click on Upload Symbols in the top-right corner.
- Upload the zip file you just created.
- Whenever your app crashes, a report will appear in App Center:
Note that crashes may sometimes be reported the next time the app is opened.
Overview of Crash Data
App Center will give you an overview of all crashes in your app. You’ll see how many daily users experience a crash, and how many overall crashes your installs have.
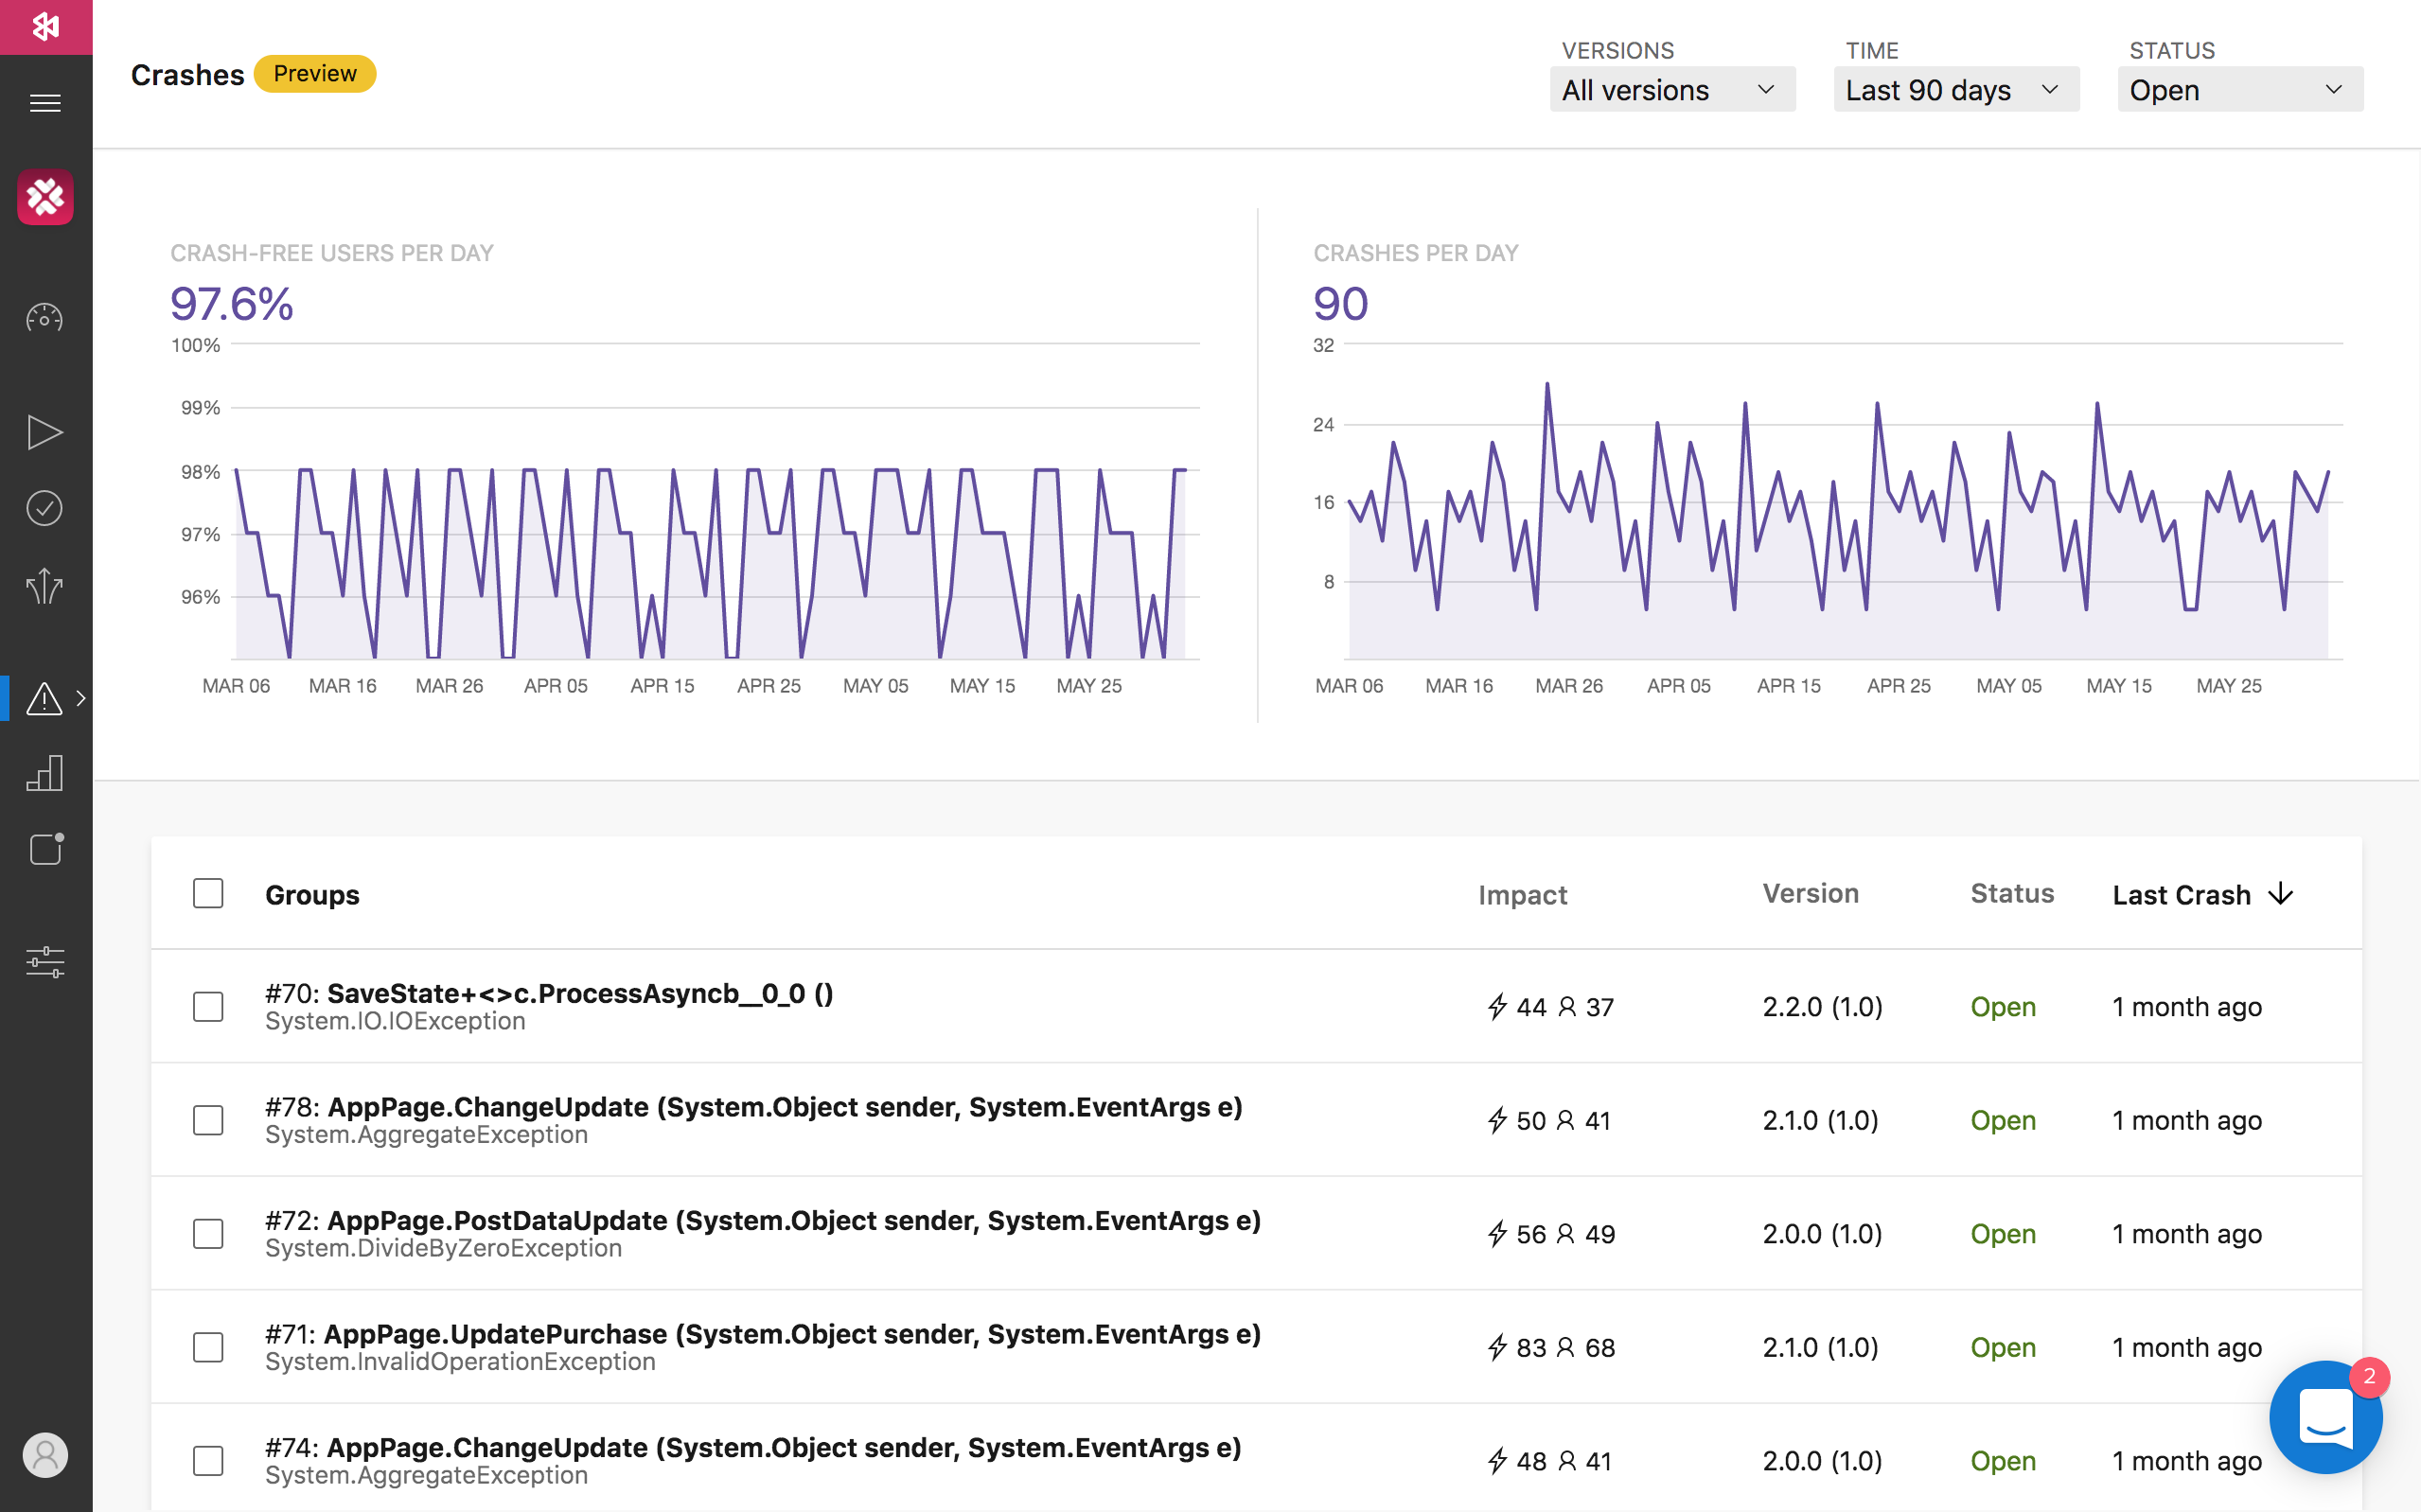
Whenever two or more crash reports share a root cause, App Center will group them thus:
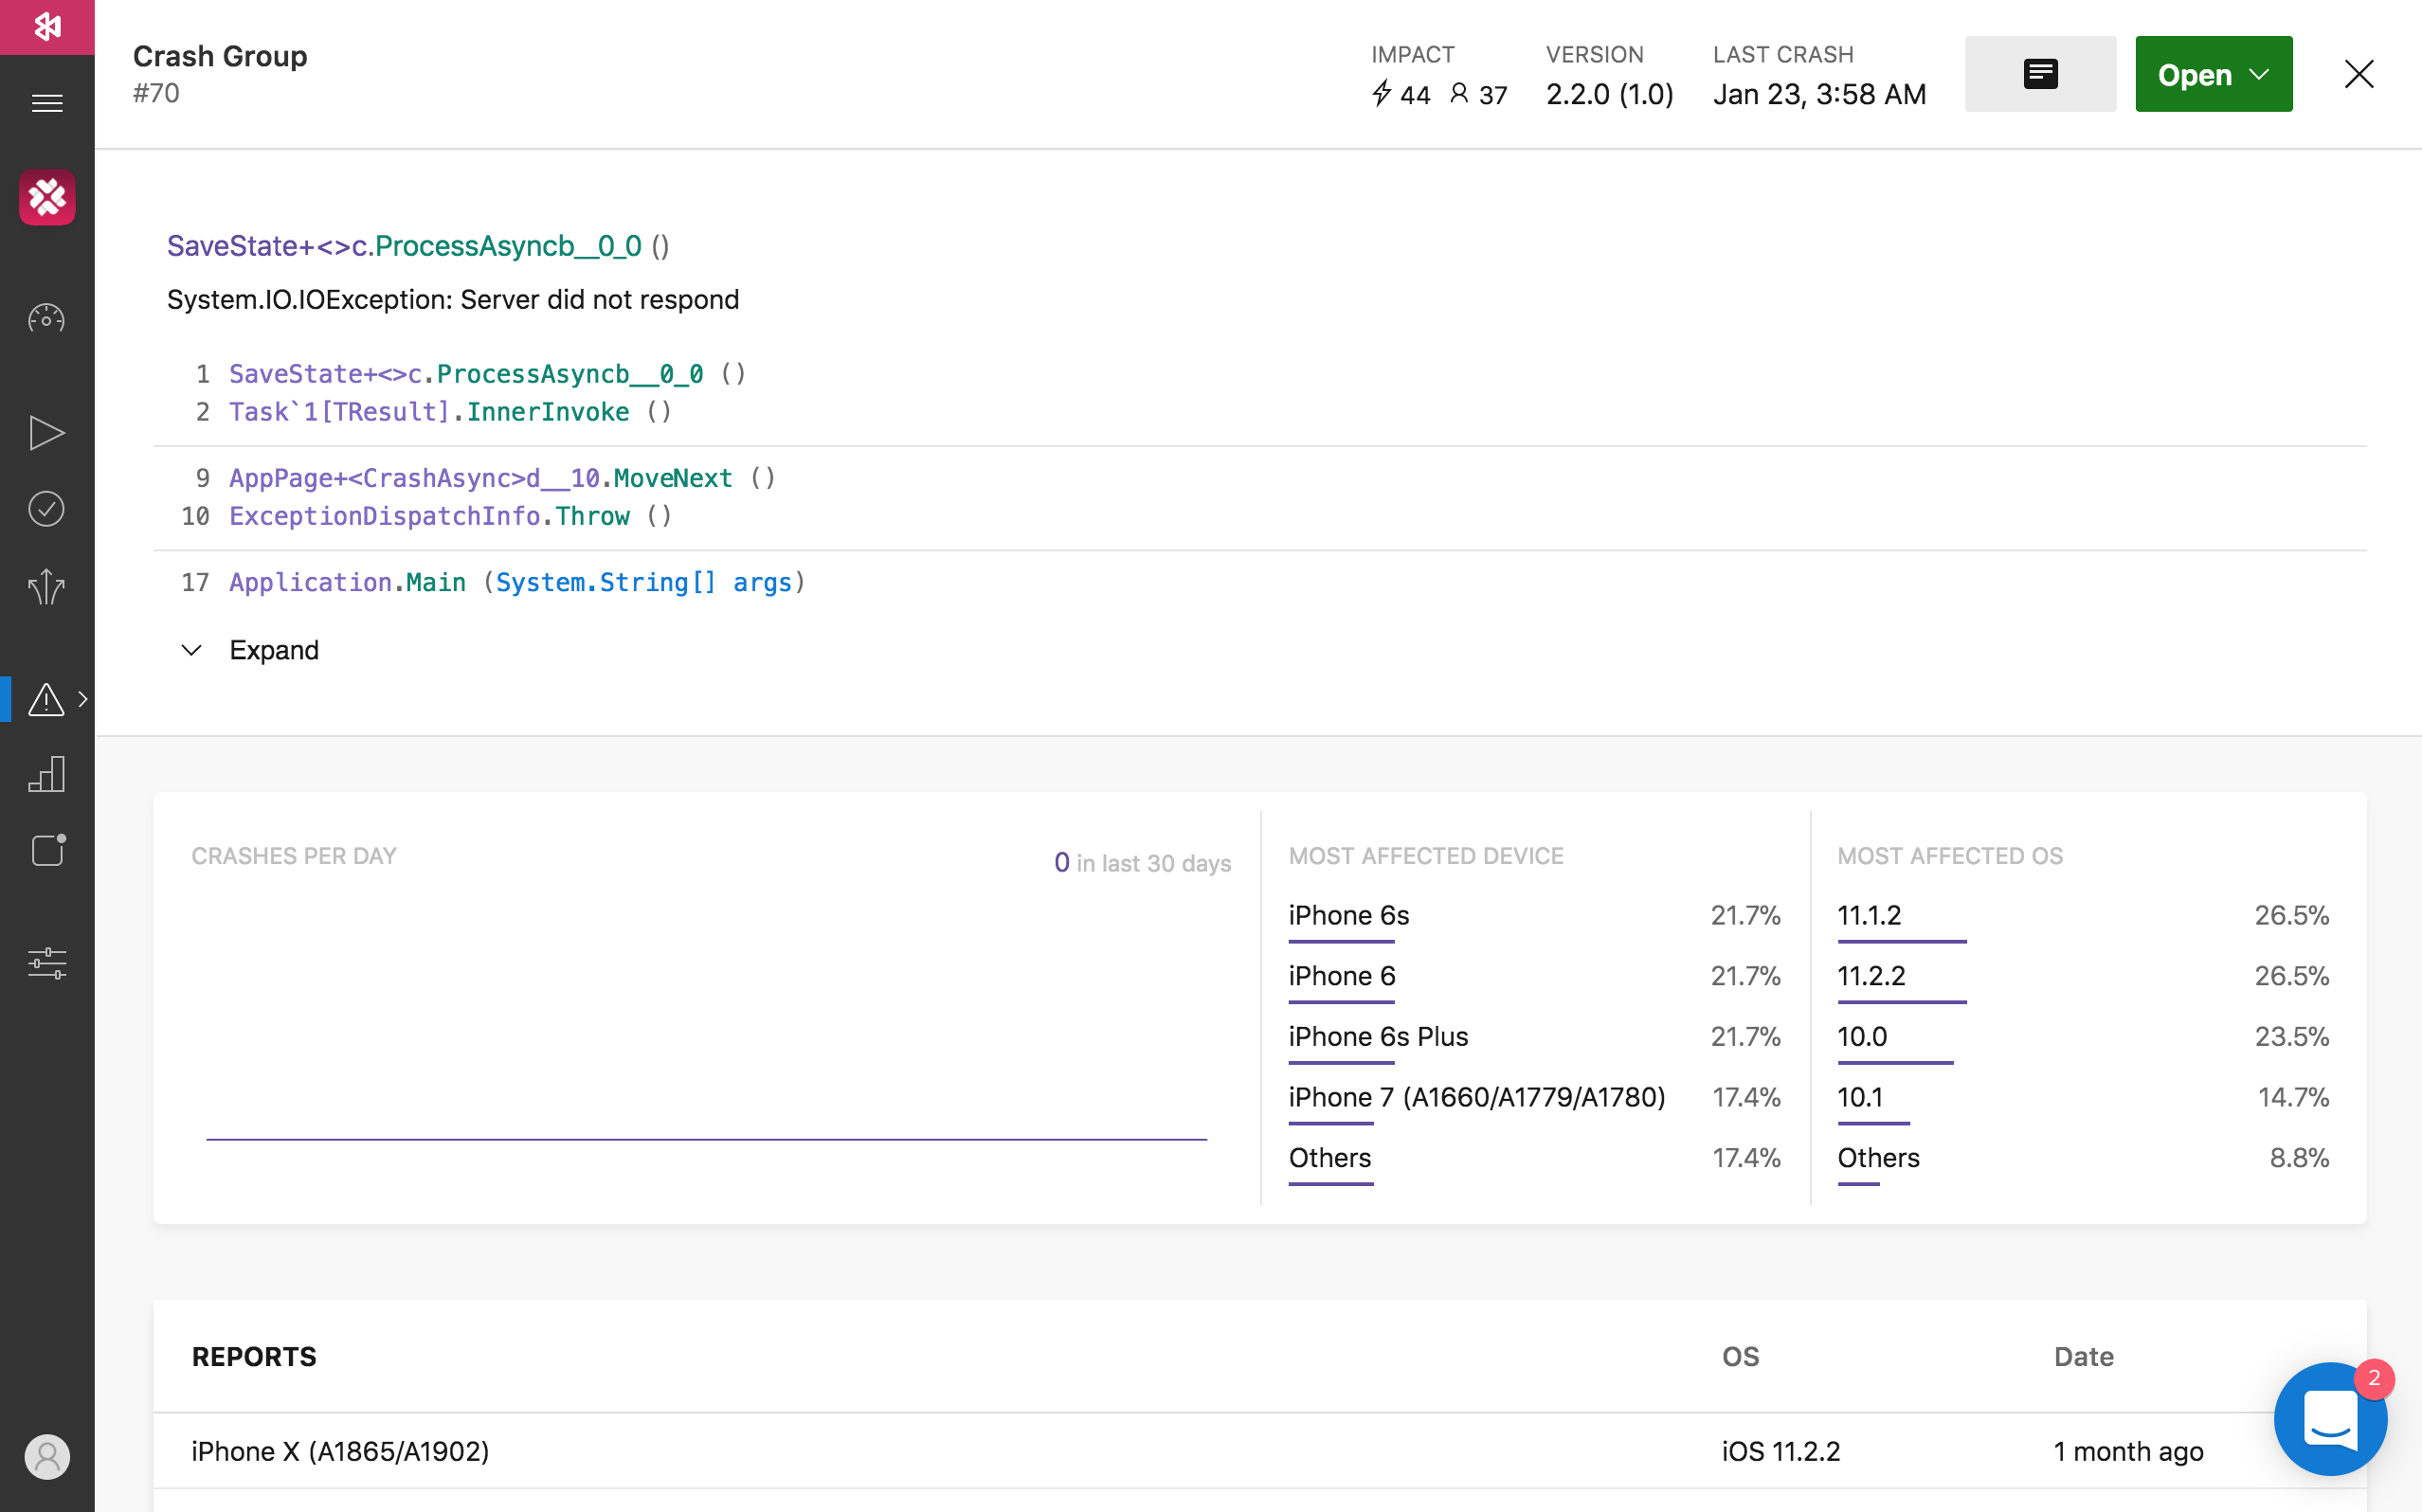
You’ll see details of the stack trace, as well as which devices and OSes are most affected.
Integrating App Center Crashes with your bug tracker
One of my favorite features of App Center is the tight integration it offers with the bug tracker your team is using. App Center work with Visual Studio Team Services as well as GitHub, and we’re now going to focus on how to integrate App Center with the latter.
- In the left-hand column of App Center, click Settings, then select Services
- Select GitHub and authorize App Center to access your GitHub repositories.
- Select the GitHub repository that corresponds to your app. You can filter the list by using the textfield in the top right of the screen.
- App Center will automatically create a GitHub issue for every crash instance your app registers. In other words, the same crash won’t be reported more than once.
That’s a wrap!
You can’t control what you can’t measure, and your app is no exception. As we’ve seen, App Center gives you reliable tools to measure your app’s performance when it’s in testers’ and end-users’ hands. It’s easy to integrate, and it gives you a detailed breakdown of your app usage and users out-of-the-box. Defining your own custom events allow you to measure actions that matter to you, and the crash reporting features help you to understand and fix crashes as soon as they come up as a GitHub issue!
I hope you enjoy using one of the best tools out there to understand your users and the health of your app.
Frequently Asked Questions (FAQs) about Continuous Learning in iOS App Using App Center
What is the App Center and how does it benefit iOS app development?
App Center is a continuous integration, delivery, and learning solution for iOS and other platforms. It provides developers with a centralized platform where they can build, test, distribute, and monitor their apps. The App Center offers several benefits for iOS app development. It automates the process of building your app and running tests on it, saving you time and ensuring that your app is always in a deployable state. It also provides detailed analytics and diagnostics to help you understand user behavior and improve your app based on real-world usage data.
How does continuous learning work in the App Center?
Continuous learning in the App Center is facilitated through its analytics and diagnostics features. The analytics feature provides insights into user behavior, such as how often your app is used, which features are most popular, and where users are located. The diagnostics feature collects data on crashes and errors, helping you identify and fix issues quickly. By continuously monitoring this data, you can learn about your users’ needs and preferences, and make informed decisions to improve your app.
How can I integrate the App Center into my iOS app development process?
Integrating the App Center into your iOS app development process is straightforward. First, you need to create an account on the App Center website. Then, you can add your app to the App Center dashboard and follow the instructions to install the App Center SDK in your app. Once the SDK is installed, you can start using the App Center’s features, such as build automation, testing, distribution, analytics, and diagnostics.
What are the main differences between the App Center and other similar platforms?
The App Center stands out from other similar platforms due to its comprehensive feature set and focus on continuous learning. While other platforms may offer build automation and testing features, the App Center also provides detailed analytics and diagnostics, enabling you to continuously learn from your users and improve your app. Additionally, the App Center supports a wide range of platforms, including iOS, Android, Windows, and macOS, making it a versatile solution for multi-platform app development.
How can I use the App Center to distribute my iOS app?
The App Center simplifies the process of distributing your iOS app. You can create distribution groups, which are lists of users who will receive new versions of your app. You can then upload your app to the App Center and select the distribution groups to send it to. The App Center will send an email to each user in the group with instructions on how to install the app. This makes it easy to distribute your app to testers, stakeholders, or even your entire user base.
Can I use the App Center to test my iOS app on different devices and configurations?
Yes, the App Center offers a device testing feature that allows you to test your iOS app on a wide range of devices and configurations. You can choose from a variety of iOS versions and device models, ensuring that your app works correctly on all supported configurations. The App Center also provides detailed test reports, helping you identify and fix any issues that arise during testing.
How does the App Center help me monitor the performance of my iOS app?
The App Center provides a diagnostics feature that collects data on crashes and errors in your iOS app. This data is presented in a clear and actionable format, helping you identify the root cause of any issues and fix them quickly. The App Center also provides analytics on user behavior, such as session duration and active users, helping you understand how your app is performing in the real world.
Can I use the App Center with other development tools and services?
Yes, the App Center is designed to work seamlessly with other development tools and services. It supports integration with popular source control systems like GitHub and Bitbucket, and it can also connect with other services through its API. This makes it easy to incorporate the App Center into your existing development workflow.
Is the App Center suitable for large-scale iOS app development projects?
Absolutely. The App Center is designed to handle large-scale app development projects with ease. Its features, such as build automation, testing, distribution, analytics, and diagnostics, are all scalable and can support apps with large user bases and complex requirements. Additionally, the App Center’s focus on continuous learning makes it an invaluable tool for large projects, where understanding user behavior and improving the app based on real-world data is crucial.
How secure is the data collected by the App Center?
The App Center takes data security very seriously. It uses industry-standard security measures to protect the data it collects, and it complies with data protection regulations such as GDPR. You can also control what data is collected by the App Center and who has access to it, ensuring that your users’ privacy is respected.