

Key Takeaways
- The Grunt.js task runner can be used to automate performance testing during the web development process, ensuring that performance targets or ‘budgets’ are met without adding onerous manual testing to QA processes.
- The Grunt Perfbudget plugin utilizes the WebPageTest.org API to measure a site against metrics such as page weight, image sizes, script weight, and rendering time. Developers can set explicit budgets for these metrics, which the plugin will then measure the site against.
- Grunt.js is crucial for performance testing as it automates tasks that ensure the code runs efficiently and without errors, saving time and reducing the risk of human error. This leads to more reliable and higher quality software.
In this age of 2 MB web pages, performance budgets are becoming necessary parts of our web development process. Working with your project’s stakeholders, it’s become everyone’s responsibilty – designers and developers both – to set targets for the performance of your website.
You might set budgets for a number of different metrics: for example, a target page weight of 500 kilobytes, which no single page in your project can exceed. Elements that would be added to the page to exceed 500kb would need to be evaluated against other elements on the page to determine their inclusion in the design. As Tim Kadlec describes, your decision must take one of 3 paths:
- Optimize an existing feature or asset on the page
- Remove an existing feature or asset from the page
- Don’t add the new feature or asset
You can also set budgets for the total images downloaded in kilobytes, the number of product images per request, or the average download time for your site according to WebPageTest.org.
Once you’ve set your budget though, it’s a whole extra task just to measure your site’s performance throughout the development phase. How can you achieve this without adding onerous manual testing to your QA process? Enter Grunt.js!
Grunt.js + WebPageTest.org = Automated Performance Testing Bliss
While there are a number of Grunt plugins that help you measure your website performance, I’m focusing on the most accurate one I’ve found: Grunt Perfbudget. This wonderful Grunt task uses the WebPageTest.org API to measure your site against a ton of useful metrics like page weight, image sizes, script weight, and rendering time. You can also set explicit budgets for these metrics that the plugin will then measure your site against!
Acquire an API Key
Before you can get your Grunt task set up, you need to email WebPageTest.org for an API key to include in your Gruntfile. (Good news: there’s an alternative to this process in the works!)
Install the Grunt Perfbudget plugin
If this is your first time using Grunt, check out my tutorial on getting up and running with Grunt.
If you already have Grunt installed on your computer, you just need to install the Perfbudget plugin before we set up our performance tests. Navigate to your project folder via the command line and run:
npm install grunt-perfbudget --save-dev
Or if you’d like a sample project to work with, fork my Github repository, grunt-perfbudget-demo and run npm install to get going.
Configure the Perfbudget Task
Once you’ve installed the plugin, you’ll need to setup your plugin options and create a task in your Gruntfile.js. I’ve created a demo Gruntfile which runs the perfbudget task as part of the default Grunt command, with just the bare minimum of options to begin – a URL to test and your API key:
module.exports = function(grunt){

  require("matchdep").filterDev("grunt-*").forEach(grunt.loadNpmTasks);
  grunt.initConfig({

    pkg: grunt.file.readJSON('package.json'),
    perfbudget: {

      default: {

        options: {

          url: 'http://cfarman.com',

          key: 'APIKEY'

        }

      }

    }

  });
  grunt.registerTask('default', ['perfbudget']);

};
When I run the default grunt task with my API key set, I get the following output in the console:
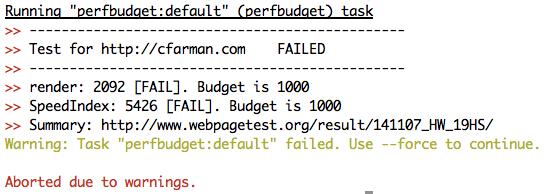
Why did my task fail? Because my website didn’t pass the default budget: render in less than 1000ms. It also failed on a metric called “SpeedIndex.” How do I find out more about my web page’s performance? Luckily, WebPageTest has a very detailed URL I can reference, linked directly from the console in my Perfbudget test!
In order to get my website to pass and not cause the Grunt task to fail (therefore stopping any website builds in an automated build environment), I have two options: I can edit my budgets until I pass (useful for testing, not so much for performance!) or I can follow my performance budget rules: optimize, remove stuff or stop adding stuff until I pass the default metrics. For now, let’s play with our Grunt task to see what a passing test looks like.
Perfbudget Options and WebPageTest Metrics
Like most Grunt tasks, the Perfbudget task lets me customize a range of options. And because of the amazingly detailed metrics measured by WebPageTest, I can test all kinds of metrics for my performance budget to see whether I pass or fail.
First, I’m going to change my options so that my website stops failing and the Grunt task reports I’m under budget. This requires an additional property in my perfbudget task called ‘budget’:
perfbudget: {

  default: {

    options: {

      url: 'http://cfarman.com',

      key: 'APIKEY',

      budget: {

        render: '3000',

        SpeedIndex: '5500'

      }

    }

  }

}
My site’s pretty slow at this point so my values are high in order to pass the test.
The results? I PASSED!
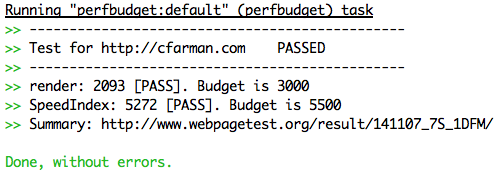
This means the Grunt task doesn’t fail and if I have other tasks in my Gruntfile, they’ll proceed as normal – success!
Besides the default metrics, what else can we measure? All kinds of stuff, including:
- loadTime: The total load time in milliseconds
- requests: The total number of files requested
- bytesIn: The total page weight in bytes
The last metric is the one I most commonly report and want to track for budgeting purposes, so let’s look at how to measure it:
perfbudget: {

  default: {

    options: {

      url: 'http://cfarman.com',

      key: 'APIKEY',

      budget: {

        render: '3000',

        SpeedIndex: '5500',

      bytesIn: '2000000'

      }

    }

  }

}
I chose a total bytes budget of 2 million, since the average page weight at this time hovers around just under 2 megabytes. Once I edit the budget options, I can see how I do by running the grunt task again:
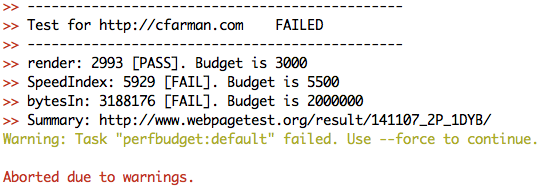
My website clocks in at 3+ megabytes, putting it way over budget! Looks like I have some work to do. But, having this information at hand is incredibly useful to me as a developer. No other Grunt plugin provides information about total page weight in such a lightweight, easy-to-test manner. Measuring these important metrics allows me to see the real impact of development decisions as I’m coding – and helps me to improve performance as a result.
Frequently Asked Questions about Automating Performance Testing with Grunt.js
What is Grunt.js and why is it important for performance testing?
Grunt.js is a JavaScript task runner that automates repetitive tasks like minification, compilation, unit testing, and linting. It’s built on Node.js and uses a command-line interface to run custom tasks defined in a file known as a Gruntfile. Grunt.js is crucial for performance testing because it allows developers to automate the tasks that ensure the code runs efficiently and without errors. This saves time and reduces the risk of human error, leading to more reliable and higher quality software.
How do I install Grunt.js for performance testing?
To install Grunt.js, you first need to have Node.js and npm (Node Package Manager) installed on your system. Once you have these, you can install Grunt.js by running the command npm install -g grunt-cli in your terminal. This installs the Grunt command line interface globally on your system. After that, you can add Grunt and Grunt plugins to your project by defining them as dependencies in a package.json file and running npm install.
How do I create a Gruntfile for my project?
A Gruntfile is a JavaScript file that goes in the root directory of your project and contains the configuration for Grunt tasks. It’s named Gruntfile.js or Gruntfile.coffee and is written in JavaScript or CoffeeScript. To create a Gruntfile, you define a wrapper function that gets passed an instance of the Grunt runtime and inside this function, you can load Grunt plugins, configure tasks, and register custom tasks.
What are some common tasks that can be automated with Grunt.js?
Grunt.js can automate a wide range of tasks related to performance testing and code optimization. These include minifying JavaScript and CSS files to reduce their size, compiling LESS and SASS files into CSS, linting JavaScript code to catch errors and enforce coding standards, running unit tests to ensure the code works as expected, and concatenating files to reduce the number of HTTP requests.
How can I use Grunt.js to automate performance testing?
To automate performance testing with Grunt.js, you can use plugins like grunt-contrib-uglify for minification, grunt-contrib-cssmin for CSS minification, grunt-contrib-jshint for linting, and grunt-contrib-qunit for unit testing. You install these plugins via npm, load them in your Gruntfile with grunt.loadNpmTasks(), and configure them by adding a property to the grunt.initConfig() method. You can then run the tasks from the command line with grunt <taskname>.
Can I run multiple tasks at once with Grunt.js?
Yes, you can run multiple tasks at once with Grunt.js by defining a task that calls other tasks. In your Gruntfile, you can use grunt.registerTask() to define a task that runs multiple tasks in the order they are specified. For example, grunt.registerTask('default', ['jshint', 'qunit', 'uglify']); would run the jshint, qunit, and uglify tasks in that order.
How can I customize the behavior of Grunt tasks?
You can customize the behavior of Grunt tasks by passing options to the grunt.initConfig() method in your Gruntfile. Each task has a set of options that control its behavior and these can be specified in the task’s configuration object. For example, the uglify task has options for mangle, compress, and beautify that control how the JavaScript code is minified.
What is the role of the package.json file in a Grunt project?
The package.json file in a Grunt project is used to manage the project’s dependencies. It lists the Grunt plugins and other npm packages that the project needs to run. When you run npm install, npm looks at the package.json file and installs the listed packages. This makes it easy to manage and share your project’s dependencies.
Can I use Grunt.js with other testing frameworks?
Yes, Grunt.js is compatible with a wide range of testing frameworks. There are Grunt plugins for popular testing frameworks like Mocha, Jasmine, and QUnit, and you can also write custom tasks to run tests with other frameworks. This makes Grunt.js a versatile tool for automating performance testing.
What are some best practices for using Grunt.js for performance testing?
Some best practices for using Grunt.js for performance testing include keeping your Gruntfile clean and organized by splitting it into multiple files, using the --verbose flag when running tasks to get detailed output, and using the --force flag to continue running tasks even if one fails. It’s also a good idea to regularly update your Grunt plugins to get the latest features and bug fixes.