
Key Takeaways
- Information Architects (IAs) are most effective when they focus on defining the organizational structure and behavior of a website or application, leaving implementation and final graphic design to other roles.
- IAs typically produce seven types of deliverables: Conceptual Model, Content Inventory and Organization, User Flows/Scenarios, Task Analysis, Site Map, Page Architecture, and Decision Tables. However, the choice of which to use depends on the project’s needs.
- The Conceptual Model, often a graphic or flowchart, communicates to the user how the product works in an intuitive, easy-to-understand manner.
- The role of IAs within a company and the deliverables they produce are unique to each project, but their main job is to define the structure and behavior of systems as perceived by the user.
One of the hottest topics these days in Information Architecture circles is documentation. This is probably partly because the IA’s role is so ill defined. Our jobs sit perched between engineering and graphic design: go too far in one direction, we’re doing the coding, go to far in the other and we are doing the design. Neither role maximizes the architect’s key skills; defining the organizational structure and behavior of the web site or application. An IA is most effective when they leave implementation and final graphic design out of the mix. The documents they create to express this have to be crafted with equal skill and diplomacy.
There are seven typical deliverables an IA will produce. Occasionally they will not produce all seven, sometimes the deliverables will include others such as a thesaurus or taxonomy. I’ve presented them in rough chronological order, though these are a toolset, not a rigid methodology, and the choice of which to use and when to use them will depend on the needs of the project.
1. Conceptual Model
User experience guru Don Norman defined three types of models that occur when creating a product
- Implementation models
- Conceptual models
- Mental models.
The implementation model is how the product works from a technical point of view. The mental model is how the user thinks the product works. The conceptual model is the message the designer or IA sends to the user about how the product works.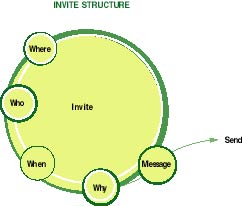
A conceptual model is most often a graphic, though it can be a chart, a written paragraph or a flowchart. The key is that it expresses an explanation of the system’s behavior to the user that is easy and intuitive-it does not have to be how the system actually works.
Used by: Everyone who comes in contact with the project. It can be a great jumping-off point for designers, engineers and marketers to get their head around what the project does for its end users.
Diagram courtesy of Noel Franus, carboniq.com
2. Content Inventory and Organization
Most typically used for content rather than application sites. The content inventory may be provided by the IA or the client. It is exactly what you might guess: a complete list of all the content that the site holds and will hold. For sites particularly rich in content, it may be a list of types of content. Once the content is aggregated, the most simple way to deal with organizing it is to perform a card sort. Typically the names of each of the items is written on an index card. These are then sorted by likeness. Card sorts are most effective when performed with the end user of the system, rather than only by the IA. I’ve done card sorts with cut up excel spread sheets, and also with post-it notes on a white board (my personal favorite); the only important thing is to have the card sort done on discreet bits of paper- the sorter needs to be able to play, rearrange, and not get caught up in perfection.
Once the content has been grouped, the cart sorter should be requested to label each collection. The IA can then take the card sort (or card sorts, doing this exercise with at least three users is a good idea) and refine the collection and labeling.
Used by: Content, IA, Marketing, Engineering
3. User Flows/Scenarios
User flows are simple diagrams that follow a user down a path of activity. Occasionally they look like storyboards, other times like flow charts. The important thing is to not outline every single possible behavior, but rather show most likely user experience. It’s a good way to understand what the product does without being confused by every tiny detail. It is particularly useful if one needs to explain the core interactions to someone new or not deeply involved with the project.
Scenarios are a written equivalent of the User Flows, and are often a good jumping off point for them. To create them, the development team gathers together to tell the story of a user working with the system. The most effective way to do this is using a technique called personas. With personas, you start by creating archetypal users: first giving them names, then filling in relevant demographic and psychographic details about them. And finally you can describe their ideal interaction with the system you are designing.
Imagine you are designing a new version of excel. Telling the story of Jane who is 24 and working in accounting would create a different story than one describing Sarah, 45, working at home to do her budget. Both stories are potentially more useful than a story that tells user x accessed chart creation wizard: visualizing an actual person trying to use a system typically inspires much more compassionate designs. To learn more about personas, I recommend Alan Cooper’s book “The Inmates are Running the Asylum.”
Used by: Design, marketing, content and product managers. Involving any teams that have contact with users (marketing, customer service), and other stake holders such as business strategists. It is a good way to build better personas and insure buy in.
4. Task Analysis
From the scenario, you can move toward a task analysis. This is a discrete step-by-step analysis of how users accomplish their desired tasks. This allows the IA to carefully analyze each step a user needs to complete any give task.
My favorite example has always been one Peter Merholz put together: Imagine Wily Coyote trying to buy an anvil for one of his nefarious schemes from the web:
(A.)Buy An Anvil
(1.)Find The Anvil
(a.)Search For Anvil
(i.)Type in “anvil” in Search box
(ii.)Read results
(b.)Browse the Store
(2.)View anvil
(B.)Purchase The Anvil
Of course a real task analysis would be quite more detailed and complex, but the essential idea is here.
Used by: IA’s
5. Site Map
This is the IA’s workhorse, the one thing we all do when building a website. Jesse James Garrett has undertaken the Herculean task of creating a standardized language for site maps; unfortunately most IA’s still use the systems they developed early on when IA’s weren’t talking to each other. A site map can be small and simple, or can take up a hundred pages or be printed out on a plotter 6 foot wide. It all depends on the site and the needs of the project. The map documents the various pages or page types throughout the site and the user paths to and from them. It is typically started early in the project, and refined throughout.
from Jesse James Garrett's Visual Vocabulary
Used by: Engineering, design, project managers, content.
6. Page Architecture
Also called wireframes or schematics, these are probably the most controversial of the IA's deliverables. Too precise wireframes, and visual designers feel dictated to, too loose and the architecture can be misinterpreted.
- WireframeOne agency has solved this by having the visual designers create the wireframes, other companies make their page architectures look more like flow charts, eliminating design from them entirely. No matter how you decide to represent them they must show:
- Items on page
- Importance of each item on page
- Behavior of each item on page
Another type of page architecture -
Used by: Design primarily, sometimes engineering for early prototyping.
7. Decision tables
The tables allow precise documentation of the design of every interaction possible. It is especially useful when designing error handling. Often errors are ignored by design, and when engineering codes the product, they have to make up error messages. This can result in messages like “error in dll 5034. click okay to continue” Not a happy user experience.
Used By: Engineering, customer service
Again, this is not a complete list of every possible tool an IA may use but these are among the most common. Every project is unique, and the role each IA plays within the company is also unique. However, the IA’s job is to define the structure and behavior of the systems as it is perceived by the user, and these seven deliverables are an excellent way to make sure the IA’s thinking is clear and clearly communicated.
Frequently Asked Questions (FAQs) about Architecture Deliverables
What are the key components of architecture deliverables?
Architecture deliverables are the documentation and artifacts created during the process of designing and planning a project. These include architectural diagrams, design specifications, and other documents that provide detailed information about the system’s structure and behavior. The key components of architecture deliverables are the architectural vision, business architecture, information systems architecture, technology architecture, and the architecture roadmap.
How do architecture deliverables contribute to project success?
Architecture deliverables provide a clear and detailed plan for the project, outlining the system’s structure, components, and behavior. They serve as a guide for the development team, helping them understand the project’s requirements and expectations. By providing a clear vision and roadmap, architecture deliverables can help ensure that the project is completed on time, within budget, and meets the desired quality standards.
What is the role of TOGAF in architecture deliverables?
The Open Group Architecture Framework (TOGAF) is a methodology used by organizations to develop and manage their enterprise architecture. It provides a structured approach to designing, planning, implementing, and governing an enterprise’s architecture. In the context of architecture deliverables, TOGAF provides a set of guidelines and standards that help ensure the deliverables are comprehensive, consistent, and aligned with the organization’s business objectives.
How are information architecture deliverables different from other architecture deliverables?
Information architecture deliverables focus specifically on the organization and structure of information within a system. They include things like site maps, wireframes, and content inventories. While other architecture deliverables might focus on the system’s overall structure or the technology used, information architecture deliverables are concerned with how information is presented to and accessed by users.
What are some common challenges in creating architecture deliverables?
Some common challenges in creating architecture deliverables include understanding the project’s requirements, aligning the architecture with the business objectives, and ensuring the deliverables are comprehensive and consistent. It can also be challenging to communicate the architecture effectively to different stakeholders, each of whom may have different levels of technical expertise.
How can these challenges be overcome?
These challenges can be overcome through careful planning, clear communication, and the use of structured methodologies like TOGAF. It’s important to involve all relevant stakeholders in the process, to ensure that the architecture meets the needs of the business and the users. Using visual representations, like diagrams and models, can also help communicate the architecture more effectively.
What is the importance of content in information architecture deliverables?
Content is a crucial component of information architecture deliverables. It’s not just about organizing information, but also about understanding what content is needed, how it should be presented, and how users will interact with it. This involves understanding the user’s needs and expectations, and designing the content to meet those needs.
How does technology architecture fit into the overall architecture deliverables?
Technology architecture is a component of the overall architecture deliverables that focuses on the technology infrastructure of the system. It includes details about the hardware, software, and network components of the system, and how they interact with each other. This information is crucial for the development team, as it provides a clear understanding of the technical requirements and constraints of the project.
What is the role of the architecture roadmap in architecture deliverables?
The architecture roadmap is a key component of architecture deliverables. It provides a timeline for the implementation of the architecture, outlining the key milestones and deliverables. The roadmap helps to ensure that the project stays on track and that the architecture is implemented in a structured and systematic way.
How can architecture deliverables be improved?
Architecture deliverables can be improved by ensuring they are comprehensive, consistent, and aligned with the business objectives. This involves careful planning, clear communication, and the use of structured methodologies like TOGAF. Regular reviews and updates can also help to ensure that the deliverables remain relevant and effective as the project progresses.