
eegeo.js is an open source 3D maps API built on top of Leaflet, the popular mapping library.
There are many mapping libraries that allow you to embed or build simple, 2D maps. Notably Google Maps, Bing Maps, HERE, Mapbox and OpenStreetMap. Popular mapping abstraction libraries such as OpenLayers and Leaflet also allow you to change the map ‘base layer’ without having to change your application logic.
With the usage of the Google Earth API falling to NPAPI security deprecation, the choice of 3D map APIs is limited. Alternatives do exist, such as the popular Cesium library. eegeo.js is another, providing a dynamic, truly seamless 3D map of the world, from space to a desk in an indoor map. Right in the browser using WebGL.

Key Takeaways
- eegeo.js, built on top of Leaflet, offers a dynamic and seamless 3D mapping experience right in the browser using WebGL, making it a robust alternative to other 3D map APIs.
- Transitioning from a 2D to a 3D map using eegeo.js requires minimal changes to existing Leaflet code, demonstrating the ease of integrating 3D capabilities.
- The Transport for London (TfL) API can be utilized without an API key for basic functionalities, though rate limits apply, and it provides comprehensive data about London’s transport network.
- Real-time data integration and interactive features like markers and polylines for the London Underground can be implemented using simple API calls and JavaScript, enhancing the utility and interactivity of the map.
- The combination of eegeo.js and Leaflet allows for the creation of detailed, interactive 3D maps that can be further enhanced with real-time data, making complex geographical visualizations more accessible and engaging.
Getting Started
In this article, I’ll show you how simple it is to embed a gorgeous 3D map of London and add some basic functionality using the Transport for London API.
Spoiler: 3D maps are as simple as using 2D maps.
Disclaimer: I am SVP Software Development at eeGeo, and I have oversight of the development of eegeo.js
There are plenty of tutorials on how to use Leaflet. eeGeo.js was consciously built on top of Leaflet so that developers already familiar with Leaflet can get up and running immediately. I thoroughly recommend the Leaflet examples and documentation.
This article will cover basic HTML, CSS, JavaScript and simple mapping concepts.
What You’ll Need
This article will cover a few key components:
- Leaflet (documentation, examples)
- eeGeo.js (documentation, examples)
- Transport for London (TfL) API
- Python, or somewhere to upload your HTML, CSS and JavaScript
Displaying a 2D Map of London
First, let’s create a 2D map of London, using Leafet and Open Street Map. Leaflet is super simple. All you need is a tiny bit of HTML to setup the page, a <div> to contain your map, and a few lines of JavaScript to create and set the initial position.
Create the HTML
Let’s create a HTML file with the following markup:
<!DOCTYPE html>
<html lang="en">
  <head>
    <meta charset="utf-8">
    <title>Building Gorgeous 3D maps with eegeo.js and Leaflet</title>
  </head>
  <body>
    <div id="map" style="width: 600px; height: 400px;"></div>
  </body>
</html>
Include Leaflet
To include Leaflet it’s as simple as adding the Leaflet JavaScript library and CSS. Include these within the <head> tag:
<link rel="stylesheet" href="https://unpkg.com/leaflet@1.0.3/dist/leaflet.css" />
<script src="https://unpkg.com/leaflet@1.0.3/dist/leaflet.js"></script>
Add the Leaflet JavaScript
The following lines of JavaScript initialize Leaflet, and use OpenStreetMap as a tile layer. You can add this as an external JavaScript file, or for simplicity in a <script></script> block below <div id="map"/>:
var map = L.map('map', {
  center: [51.517327, -0.120005],
  zoom: 15
});
L.tileLayer('http://{s}.tile.osm.org/{z}/{x}/{y}.png', {
  attribution: '© <a href="http://osm.org/copyright">OpenStreetMap</a> contributors'
}).addTo(map);
The code initializes the map centered on Holborn Tube Station at the WGS84, decimal degrees latitude, longitude of 51.517327, -0.120005. You can obtain these coordinates by right clicking and selecting ‘What’s here’ on digital maps like maps.eegeo.com or Google Maps. You’ll see later that most geospatial APIs return positions in standard WGS84 decimal degrees latitude and longitude, including the TfL API.
Fire up the 2D Map
Upload your HTML somewhere, or view it locally. I recommend not loading directly from the file system but using a local loopback web server. Save your HTML as index.html, and in the same folder, run: python -m SimpleHTTPServer 8000 You can then visit http://localhost:8000/ in your browser.
You’ll see the following map, centered on Holborn Tube Station in London:

Displaying a 3D Map of London
As eeGeo.js is built on top of Leaflet there are very few changes to make to turn the 2D map of London into a gorgeous 3D map.
Change the JavaScript we added above which read var map = L.map ... to the following. A free eeGeo API key is required. You should also delete the JavaScript that calls L.tileLayer as it is no longer required.
The JavaScript should now read:
var map = L.eeGeo.map('map', '<your_api_key>', {
  center: [51.517327, -0.120005],
  zoom: 15
});
Change the <script> include we added to <head> to include eegeo.js rather than Leaflet. The eegeo.js file already contains Leaflet, so don’t include both:
<script src="https://cdn-webgl.eegeo.com/eegeojs/api/v0.1.780/eegeo.js"></script>
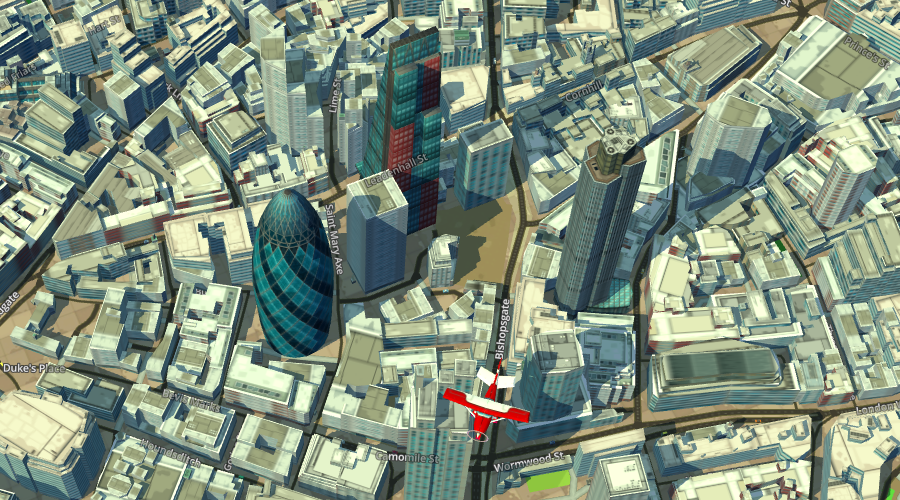
And that’s it! By changing just a couple of lines, you’ll now see the exact same view of Holborn Tube Station but in gorgeous 3D:

Changing zoom, tilt & orientation
As eeGeo.js is completely 3D, it’s possible to rotate and tilt the map. The Leaflet setView function is supported, with optional tilt and heading arguments to support the 3D behavior of the map.
Add the following JavaScript and after 10 seconds the map will seamlessly animate in 3D from Holborn Tube Station to the Gherkin in London:
setTimeout(function() {
  map.setView([51.514613, -0.081019], 17, {headingDegrees: 204.374, tiltDegrees:15.0});
}, 10000);

The screenshot doesn’t do the interaction justice, but this CodePen shows the animation in action:
See the Pen Gorgeous 3D Map Transitions with eeGeo.js and Leaflet by SitePoint (@SitePoint) on CodePen.
The additional arguments to setView() above are as follows:
| Field | Type | Description |
|---|---|---|
headingDegrees |
decimal | decimal degrees from north, clockwise, where 0.0 is north. |
tiltDegrees |
decimal | tilt in degrees where 45.0 is directly overhead and 0.0 is the default tilted view |
Interacting with the 3D Map of London
Now, let’s add something useful to the map. Most Leaflet primitives are supported such as Markers, Polylines, and Polygons.
To add a Marker at Holborn Tube Station to the map, call L.marker():
L.marker([51.517327, -0.120005]).addTo(map);
To add a Polygon at Russell Square, call L.polygon(). The Polygon is defined by four vertices, clockwise, starting at the Bernard St & Wolborn Place junction at the north easterly corner of Russell Square:
L.polygon([[51.522771, -0.125772],
           [51.521520, -0.124192],
           [51.520631, -0.126358],
           [51.521963, -0.127895]]).addTo(map);
To add a Polyline of a route through Bloomsbury, starting at Great James St. and ending at Museum St.:
L.polyline([[51.521788, -0.117101],
            [51.520732, -0.116524],
            [51.520430, -0.117641],
            [51.519873, -0.119602],
            [51.519034, -0.120993],
            [51.518784, -0.121537],
            [51.517265, -0.125088],
            [51.516257, -0.124466]]).addTo(map);
Refresh, and the three Leaflet primitives will now be shown on the map:

You’ll notice the calls to L.marker(), L.polyline() and L.polygon() are all Leaflet API calls. If we revert the map back to the OpenStreetMap from earlier, the exact same calls will still work on the 2D OSM base layer:

Transport for London (TfL) API
Next, let’s add some data from a real-world API to the 3D map of London.
The Transport for London (TfL) API is large and complex. It covers all transport in London, including bus, tube, overground, cycle hire and provides real-time status and arrival time data.
The scope of the full TfL API is far too large to cover in this article. I will focus solely on a very small number of API endpoints that describe the London Underground, specifically answering:
- What are the available tube lines?
- Which stations does a particular tube line stop at?
- What is the “arrival board” of a particular tube station?
The TfL API can be used without an API key with strict rate limiting. If you use the TfL API in a real, production deployment, you should sign up for an API key.
What are the available tube lines?
To answer the question of ‘What are the available tube lines’, the TfL API provides an endpoint on the Line resource
We are only interested in the ‘tube’ mode of transport, so making the following call:
curl -v https://api.tfl.gov.uk/line/mode/tube
returns a JSON response with an array of Line entities. We are only interested in the id property of each of the entries:
[{
  "id": "bakerloo",
  "name": "Bakerloo",
  "modeName": "tube",
  "disruptions": [],
  "lineStatuses": [],
  "routeSections": [],
  ...
},...]
To simplify the interaction with the TfL API, we’ll use jQuery, but the dependency on jQuery is entirely optional. The following JavaScript calls the Line endpoint and collects the Line IDs:
$.getJSON( "https://api.tfl.gov.uk/line/mode/tube", function(data) {
  var lines = [];
  $.each(data, function(k, line) {
    lines.push(line.id);
  });
});
I will later use these Line IDs to query other TfL endpoints that describe the stations along a particular route of the Underground.
Modeling the London Underground as a Graph
You can think of the London Underground as a Graph. A Graph contains Vertices and Edges. For the London Underground, I will consider the stations to be the Vertices, and the tube lines will form the Edges.

Modeling the central line (in red above) as a Graph, there would be Vertices at North Acton, West Acton, and Hanger Lane. As there is a branch in the central line westbound from North Acton, a central line Edge exists between North Acton and West Acton and also between North Acton and Hanger Lane.
Further to the east on the central line is Notting Hill Gate. There is only one Notting Hill Gate underground station, yet it has platforms for three lines: central (red), circle (yellow) and district (green). We only want to add one Leaflet Marker for Notting Hill Gate, not three. If we model Notting Hill Gate as a Vertex, there would be central line Edges (to Holland Park and Queens Way), circle line and district line Edges to Bayswater and High Street Kensington.
This is significant, as the TfL API models the Underground as a directed graph.
What are the stations on a particular Tube line?
We now have the Line ID of every line of the Underground. I’m also planning on loosely modeling the stations and lines as vertices and edges in a Graph. Given a Line ID, the TfL API can then tell us what stations each line stops at. The TfL API refers to these as StopPoints. The endpoint we will call is the Line, Route including sequence of StopPoints
Let’s make another call to the TfL API to describe the outbound route of the central line:
curl -v https://api.tfl.gov.uk/line/central/route/sequence/outbound
This returns a very large JSON payload, over 8000 pretty-printed lines. Luckily, we are only interested in the stopPointSequences key:
"stopPointSequences": [
  {
    "lineId": "central",
    ...
    "stopPoint": [
      ...
      {
        "id": "940GZZLUNHG",
        "name": "Notting Hill Gate Underground Station",
        ...
        "lat": 51.509128,
        "lon": -0.196104
      },
      {
        "id": "940GZZLUQWY",
        "name": "Queensway Underground Station",
        ...
        "lat": 51.510312,
        "lon": -0.187152
      },
      ...
    ],
  },
  ...
]
This property is a list of JSON objects that group the line into contiguous sections. Within a StopPointSequence are all the StopPoints, in order, along the line.
The following JavaScript handles the creation of unique stations and also the creation of polylines so we can draw a line for the edges of the tube lines.
var stopPoints = {};
$.getJSON( "https://api.tfl.gov.uk/line/central/route/sequence/outbound", function( data ) {
  var lineSegments = [];
  $.each(data.stopPointSequences, function(k, v) {
    var line = [];
    $.each(v.stopPoint, function(k, sp) {
      line.push([sp.lat, sp.lon]);
      if (!(sp.id in stopPoints)) {
        stopPoints[sp.id] = {"id":sp.id, "name":sp.name, "lat":sp.lat, "lon":sp.lon};
      }
    });
    lineSegments.push(line);
  });
});
We can now call the above JavaScript for each line of the Underground. Afterward, we will have every unique station collated in the stopPoint dictionary. For each line, we also have a collection of polylines representing the sections of the tube line in the lineSegments array.
Later I will show how to add Leaflet Markers and Polylines to visually display the tube stations and lines.
Which trains are arriving at a particular station?
The final TfL API endpoint we need is live arrivals. In the above section, we can see that a station has a unique identifier in the API. For Notting Hill Gate, the ID is 940GZZLUNHG:
{
  "id": "940GZZLUNHG",
  "name": "Notting Hill Gate Underground Station",
  ...
  "lat": 51.509128,
  "lon": -0.196104
}
We can now call the TfL StopPoint API, providing a StopPoint ID:
curl -v https://api.tfl.gov.uk/stoppoint/940GZZLUNHG/arrivals?mode=tube
This returns an array of arrivals:
[{
    ...
  "naptanId": "940GZZLUNHG",
  "stationName": "Notting Hill Gate Underground Station",
  "lineId": "central",
  "platformName": "Eastbound - Platform 3",
  "direction": "outbound",
  ...
  "destinationName": "Epping Underground Station",
  "timeToStation": 290,
  "currentLocation": "Between White City and Shepherd's Bush",
  "towards": "Epping",
  ...
},
...]
This is indicating that an Eastbound Train to Epping will arrive at Platform 3 in just under 5 minutes time (290 seconds).
Putting It Together
So far, I have shown you how to:
- Create a simple 2D OpenStreetMap map with Leaflet
- Turn that simple 2D map into a gorgeous 3D map with eeGeo.js and Leaflet
- Add simple details to maps in the form of Leaflet Markers, Polylines, and Polygons
- Perform basic interactions with the Transport for London API
Now to bring these simple concepts together to produce a 3D interactive map of London, showing the Lines and Stations of the London Underground and real-time arrival times for all Stations!

Add Markers for Underground stations
In the previous $.getJSON() call that requests https://api.tfl.gov.uk/line/central/route/sequence/outbound, call L.marker() for each Station:
$.each(stopPoints, function(k, sp) {
  L.marker([sp.lat, sp.lon],
    {
      title: sp.name,
      options: {"id":sp.id, "name":sp.name}
    }).addTo(map);
});
We have passed additional ‘options’ through the marker. This is so later when we handle mouse hover events, we know what Station ID and Name we have hovered over.
Add Polylines for Underground lines
Again, in the previous Ajax call that requests https://api.tfl.gov.uk/line/central/route/sequence/outbound, add an L.polyline() call for each of the line segments:
$.each(lineSegments, function(k, ls)
{
  L.polyline(ls, {weight:8, color:"#CC3333"}).addTo(map);
});
The color above could come from a lookup by Line ID. In this case, I have hard coded circle line red in accordance with the TfL Design Guidelines
Handling mouseover events on Leaflet Markers
I’d like to display the real-time arrival information from the TfL API. It’s possible to receive a callback when a Leaflet Marker is moused over. It’s also possible to show a Leaflet Popup to show the name of the station.
$.each(stopPoints, function(k, sp) {
  var marker = L.marker([sp.lat, sp.lon],
  {
    title: sp.name,
    options: {"id":sp.id, "name":sp.name}
  }).addTo(map);
  marker.bindPopup(sp.name);
  marker.on('mouseover',_hovercard.overstation);
  marker.on('mouseout',_hovercard.outstation);
});
In a more complex CodePen below, I will show how the _hovercard.* callbacks will make a request to the TfL API and populate a callout card with the real-time arrivals at the station.
Putting everything together
With some additional Separation of Concerns and some better modeling, you can see a full demo of eegeo.js, Leaflet, and the TfL API in this Code Pen:
See the Pen eeGeo.js and TfL API by SitePoint (@SitePoint) on CodePen.
3D Maps Don’t Have to Be Hard
In this article, I’ve shown how to add 2D maps to your site with JavaScript and Leaflet, and how to add simple map features like Markers, Polylines, and Polygons. I’ve then shown how data can be easily added from real-world APIs like the Transport for London (TfL) API
I’ve highlighted the benefits of coding against mapping abstraction libraries such as OpenLayers and Leaflet. The visuals of your map can change drastically with little to no change to your code. I’ve also shown how simple 3D mapping can be using eegeo.js.
If you’ve any comments or questions about something in this article, please let me know in the comments below.
Frequently Asked Questions (FAQs) about 3D Maps with eeGeo and Leaflet
How can I integrate eeGeo with Leaflet to create 3D maps?
Integrating eeGeo with Leaflet to create 3D maps involves a few steps. First, you need to include the eeGeo and Leaflet JavaScript libraries in your HTML file. Then, you can initialize the eeGeo map with your API key and set the initial location and zoom level. You can then add various features to your map, such as markers, popups, and layers, using the Leaflet API. Remember to replace ‘YOUR_API_KEY’ with your actual eeGeo API key.
What are the benefits of using eeGeo with Leaflet for 3D mapping?
Using eeGeo with Leaflet for 3D mapping offers several benefits. eeGeo provides a highly detailed and interactive 3D environment, which can make your maps more engaging and informative. Leaflet, on the other hand, is a powerful open-source JavaScript library for mobile-friendly interactive maps. It has a simple, easy-to-use API that works across all major desktop and mobile platforms.
Can I use custom data with eeGeo and Leaflet?
Yes, you can use custom data with eeGeo and Leaflet. Both libraries support GeoJSON, a common format for encoding geographic data structures. This means you can import your own data and display it on your 3D map. You can also style your data using Leaflet’s powerful styling options.
How can I add interactivity to my 3D map?
Adding interactivity to your 3D map is straightforward with eeGeo and Leaflet. You can use Leaflet’s event handling methods to respond to user interactions, such as clicks or mouse movements. For example, you can add a click event to a marker that opens a popup with more information.
Can I use eeGeo and Leaflet for indoor mapping?
Yes, eeGeo and Leaflet can be used for indoor mapping. eeGeo’s Indoor Maps API allows you to create detailed, interactive indoor maps. You can add multiple floors, highlight points of interest, and even integrate with indoor positioning systems.
How can I optimize my 3D map for mobile devices?
Optimizing your 3D map for mobile devices involves a few considerations. First, you should ensure your map is responsive, meaning it adjusts its size and layout based on the screen size. Second, you should consider performance. 3D maps can be resource-intensive, so you may need to simplify your map or reduce the level of detail for mobile devices.
Can I add custom styling to my 3D map?
Yes, you can add custom styling to your 3D map. Leaflet provides a range of styling options that you can apply to your map and its features. For example, you can change the color, opacity, and weight of lines and polygons, and you can use custom icons for markers.
How can I add layers to my 3D map?
Adding layers to your 3D map is easy with Leaflet. You can use the L.layerGroup() function to create a layer group, and then add layers to it using the addLayer() method. You can also control the visibility of layers using the addTo() and remove() methods.
Can I use eeGeo and Leaflet with other mapping libraries?
Yes, you can use eeGeo and Leaflet with other mapping libraries. Both libraries are designed to be flexible and interoperable, so you can easily integrate them with other mapping tools and services. However, you should be aware that using multiple libraries may increase the complexity of your project and could potentially lead to compatibility issues.
How can I troubleshoot issues with my 3D map?
Troubleshooting issues with your 3D map can involve several steps. First, you should check the console for any error messages. These can often provide clues about what’s going wrong. If you’re having trouble with a specific feature, you should try isolating it to see if the issue persists. You can also refer to the eeGeo and Leaflet documentation, or ask for help on their respective support forums.