This article is part of a web development series from Microsoft. Thank you for supporting the partners who make SitePoint possible.
In April 2015, our team of engineers and tech evangelists at Microsoft released vorlon.js – an open source, extensible, platform-agnostic tool for remotely debugging and testing your JavaScript. This article is the first in a series that will take a detailed look at one specific feature, starting with one of the biggest: the DOM Explorer.
Overview
If you’re not familiar with vorlon.js, I recommend first reading this blog post, which explains why we made vorlon.js and how to use it. You’ll find additional vorlon.js information at the end of this article.
The DOM inspector shows you the DOM of the remote webpage. You can inspect the DOM, clicking on nodes will highlight them in the host webpage, and if you select one you can also view and modify its CSS properties.
Installing Vorlon.js
Just as a reminder, here is what you have to do to use Vorlon.js:
- Install and run the Vorlon.JS server from npm:
$ npm i -g vorlon $ vorlon - Once Vorlon.js is done installing, you can now run the server:
$ vorlon The Vorlon server is running - With the server is running, open
http://localhost:1337in your browser to see the Vorlon.js dashboard. - The last step is to enable Vorlon.js by adding this script tag to your app:
<script src="http://localhost:1337/vorlon.js"></script>Now when you open your app you should see your client appear on the dashboard.
Using the DOM Explorer
By default, the DOM explorer is on but if you need to enable it, you have to go to [Vorlon folder]\Server\config.json and enable the plugin:
{
"useSSL": false,
"includeSocketIO": true,
"activateAuth": false,
"username": "",
"password": "",
"plugins": [
{ "id": "DOM", "name": "Dom Explorer", "panel": "top", "foldername": "domExplorer", "enabled": true }
]
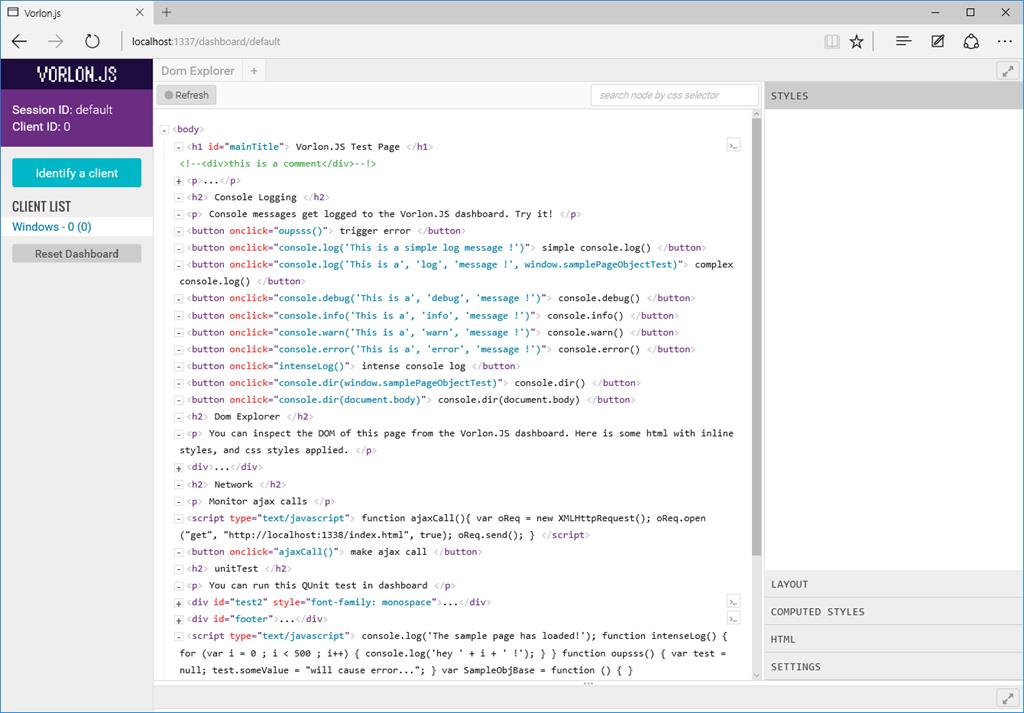
}Once enabled you will be able to control almost everything related to the DOM through plugin’s main window.
And here is what you’ll be able to do:
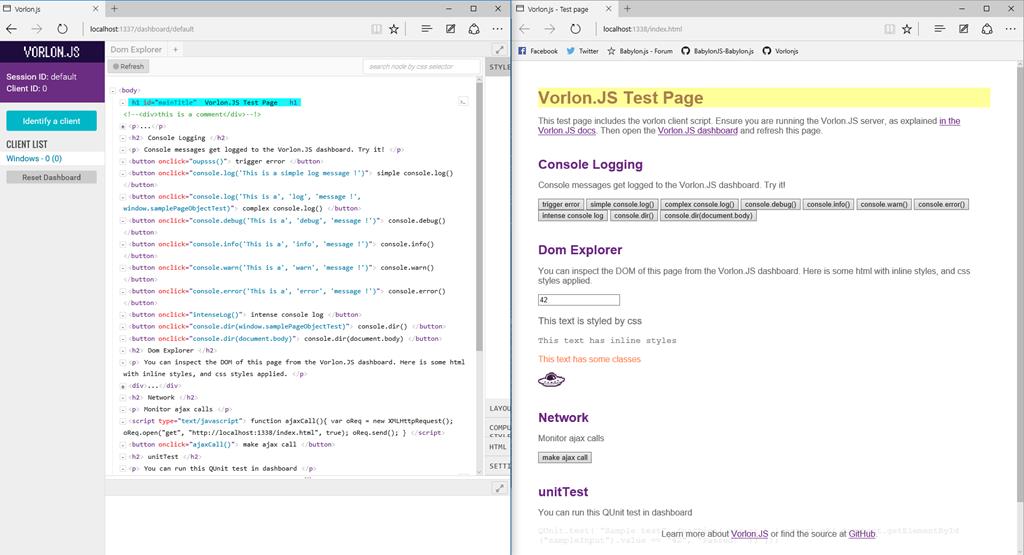
Selection overlay
By moving your mouse over any node, you will be able to see where this node belongs on the client side:
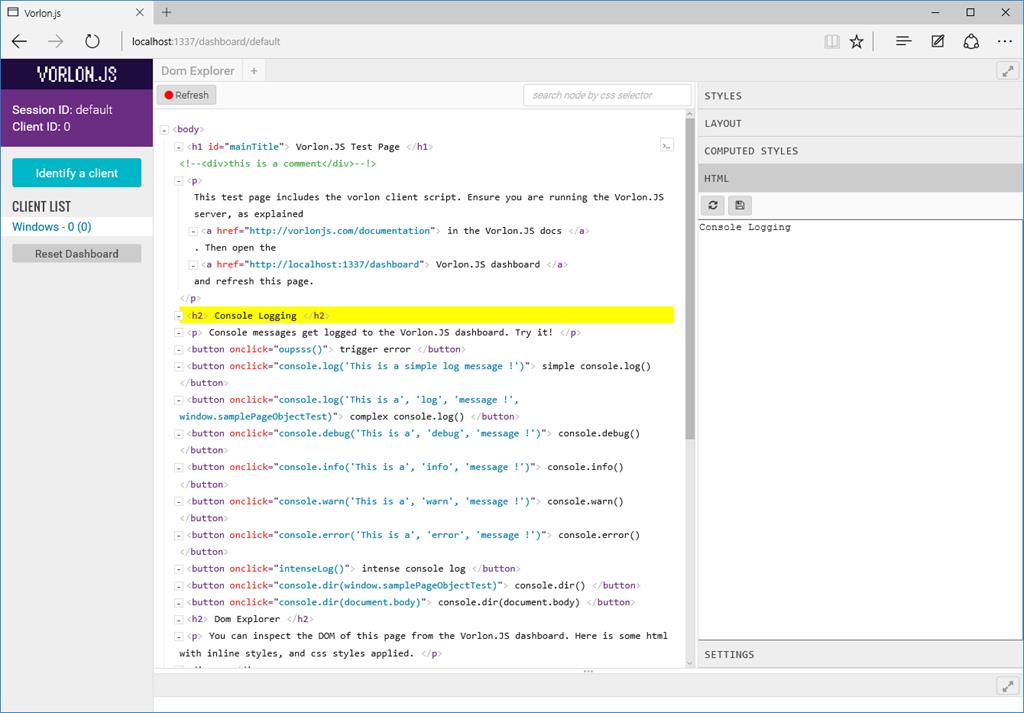
Live text editing
By double-clicking on any text inside the DOM explorer window, you have the ability to live edit it:

But you can also use the HTML section on the right pane to edit HTML text content:
This feature can also be reached by right-clicking on the node itself.
Attributes edition
Nodes’ attributes are also editable by just clicking on them:
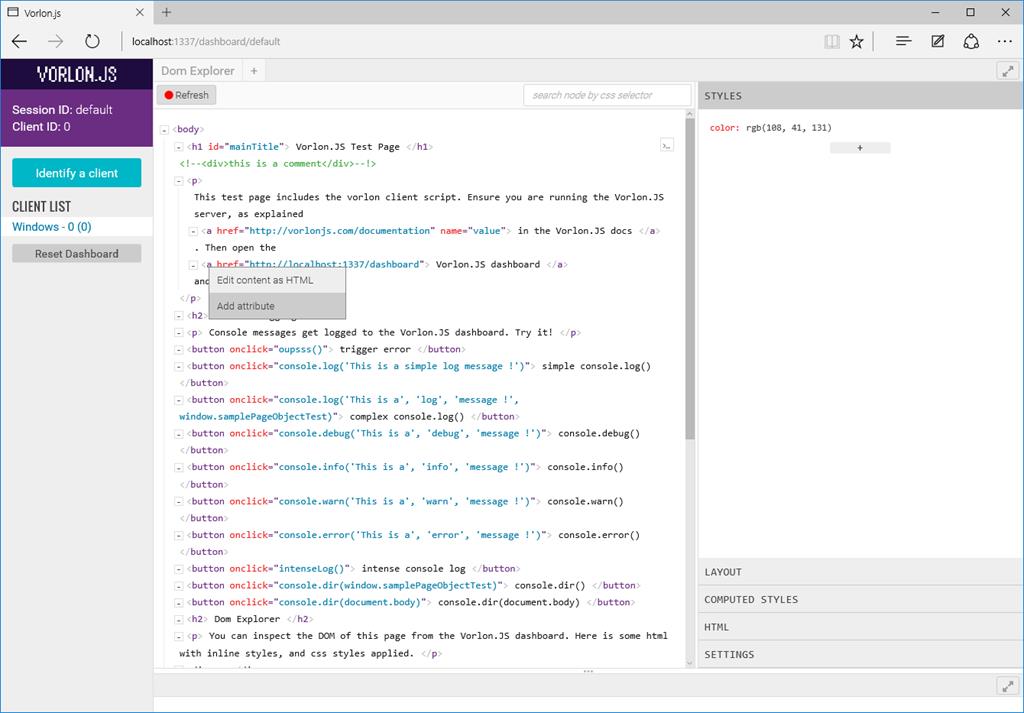
But you can also right click on the node name itself to add a new attribute:
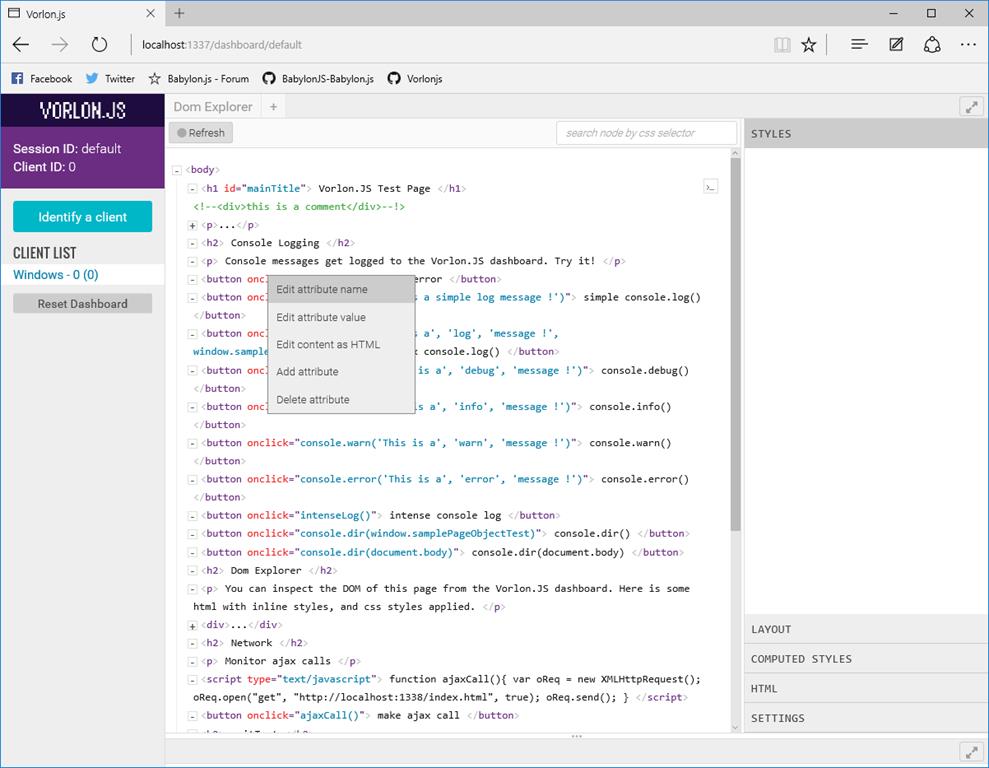
By right-clicking on existing attribute, you will get even more options like updating value or name or deleting the attribute:
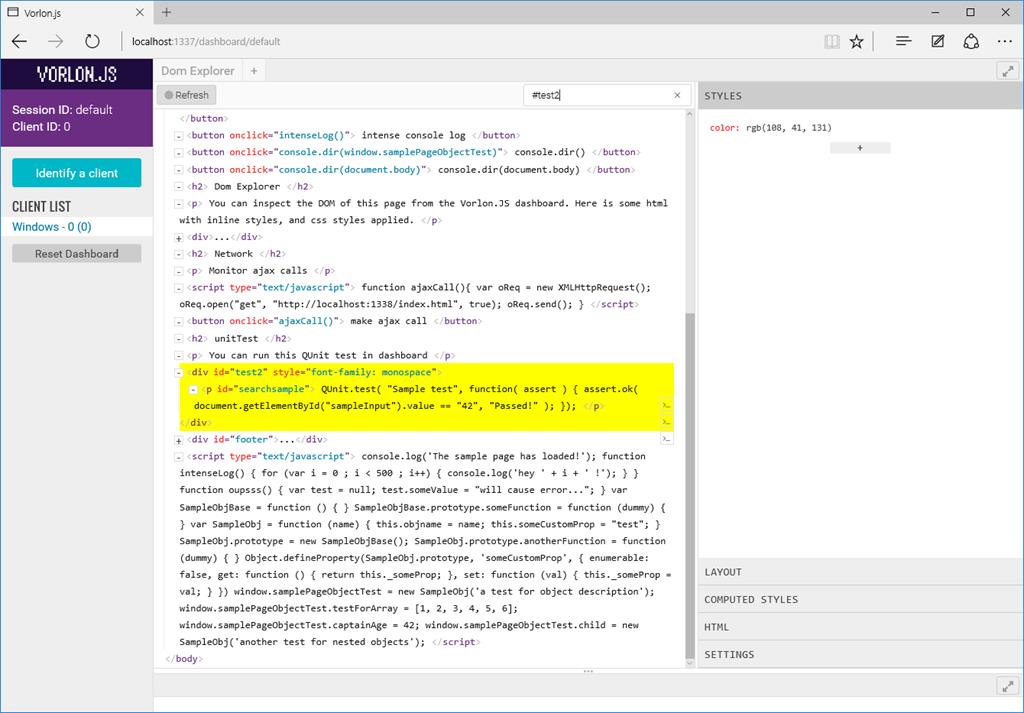
Search using CSS selector
When dealing with big HTML pages you may want to search a specific node. This is why we introduced the “search node by CSS selector” feature.
Just enter your selector in the search box and you’re done!
Dynamic refresh
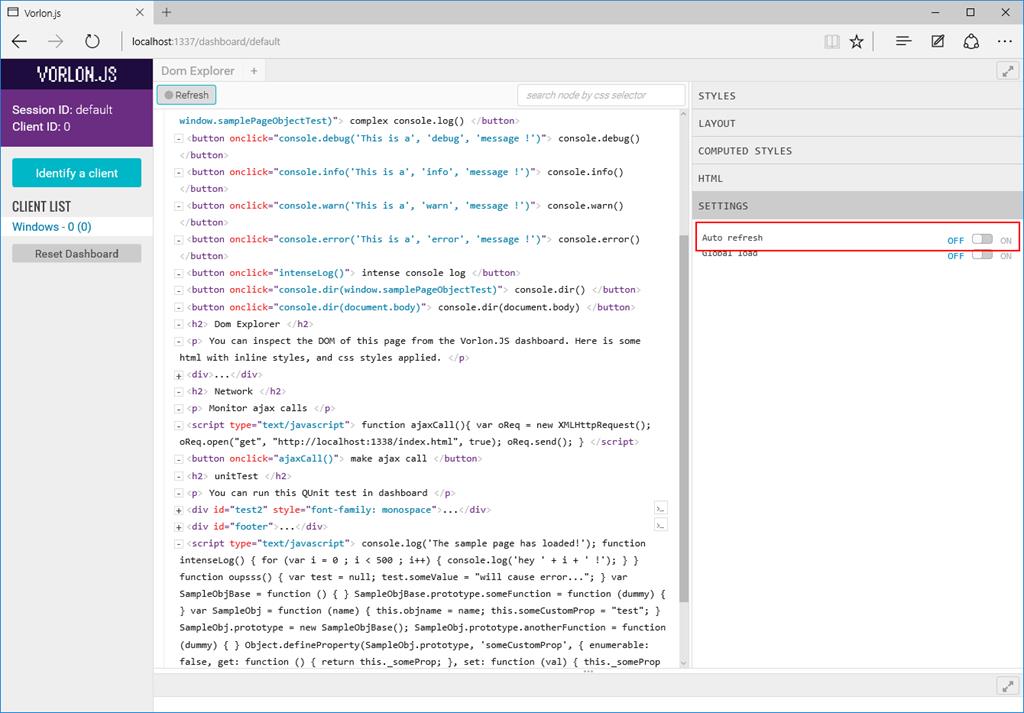
The DOM Explorer window can either be automatically refreshed when client DOM changes (beware as this could consume a lot of CPU power and network bandwidth even if we use delta updates) or can be refreshed on demand.
Auto refresh in controlled on the settings pane:
When auto refresh is off, the Refresh button can tell you if there are available updates on the client side (The little dot on the button will turn red):
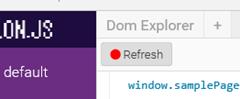
In this case, just clicking on the button will launch a complete refresh of the page
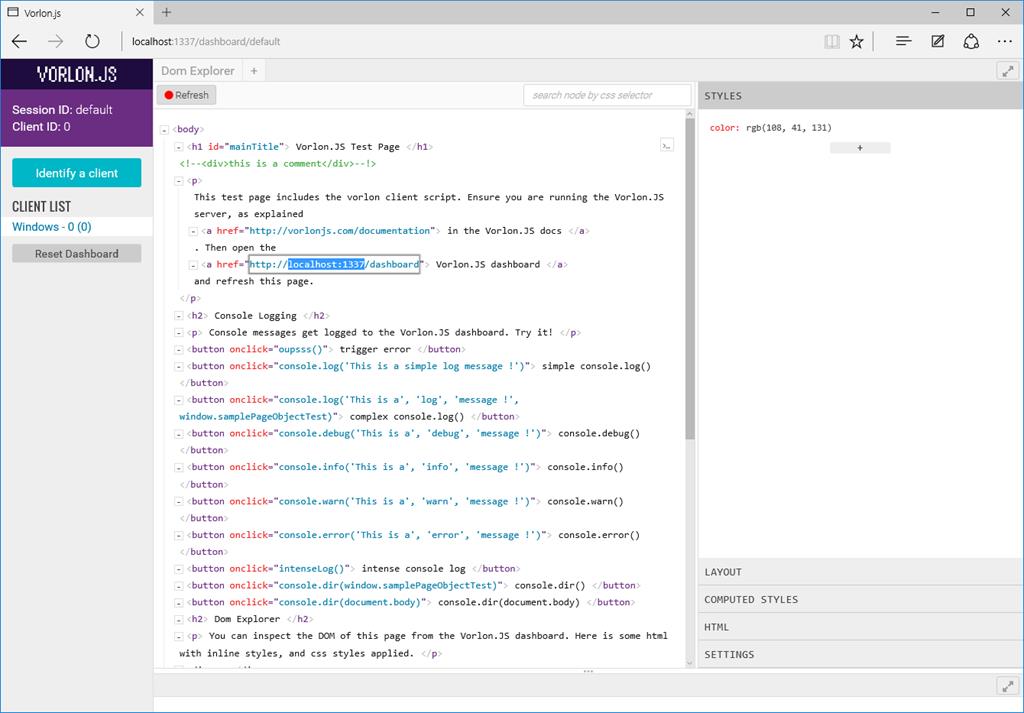
Styles editor
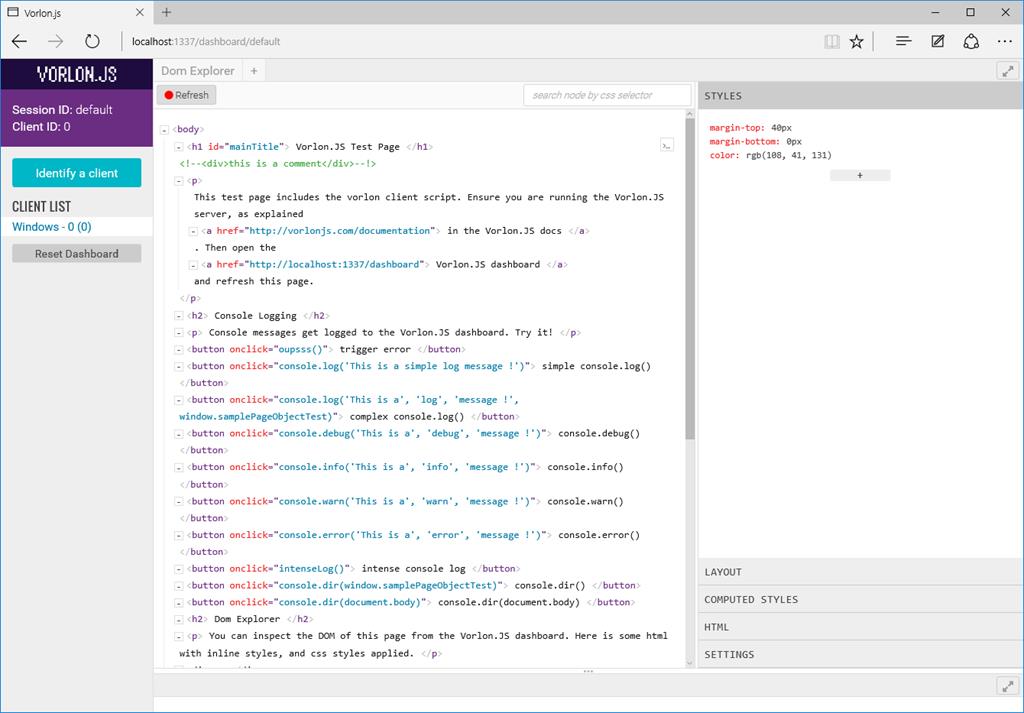
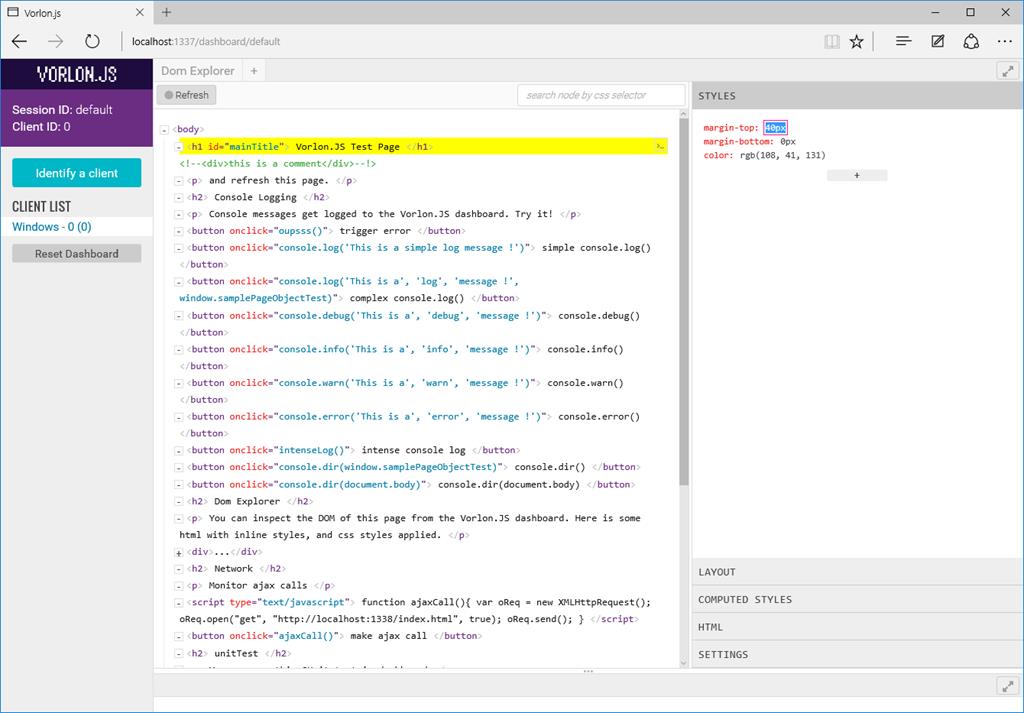
When you click on a node, the Styles pane will present you all the styles explicitly defined for this node:

You can then use the “+” button to add new style or click on existing ones to change their value:
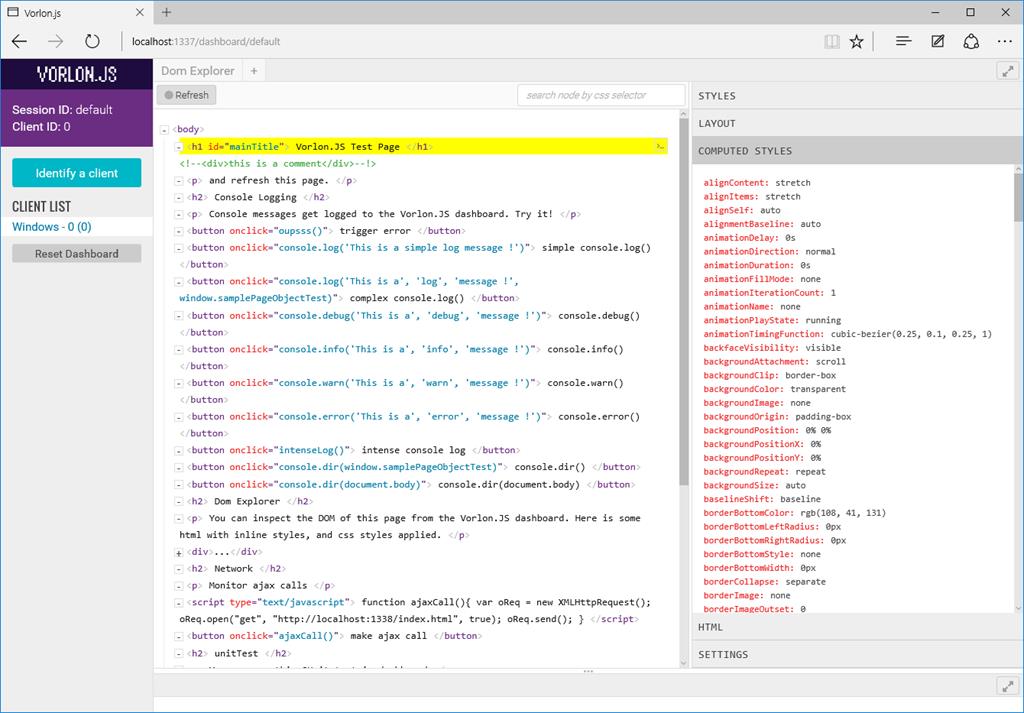
To see ALL styles applied to a node (including implicit ones), you just have to use the Computed Styles pane:
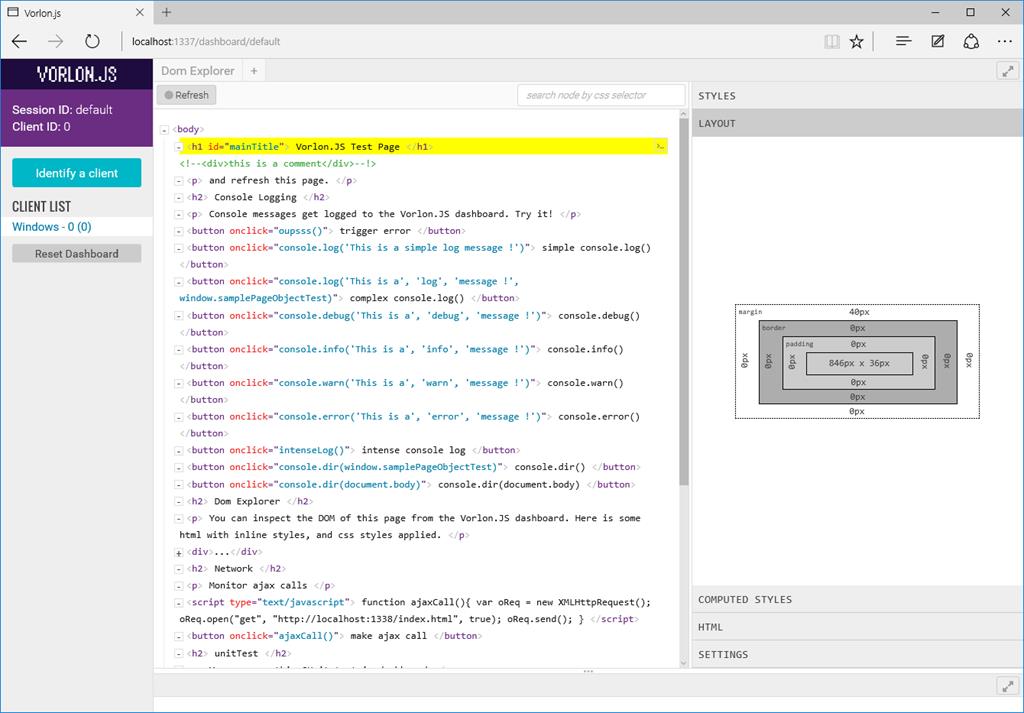
Layout
Like browsers’ F12 tools, the Layout pane is here to help you understand the layout of every node that you select:
Link with Interactive console plugin
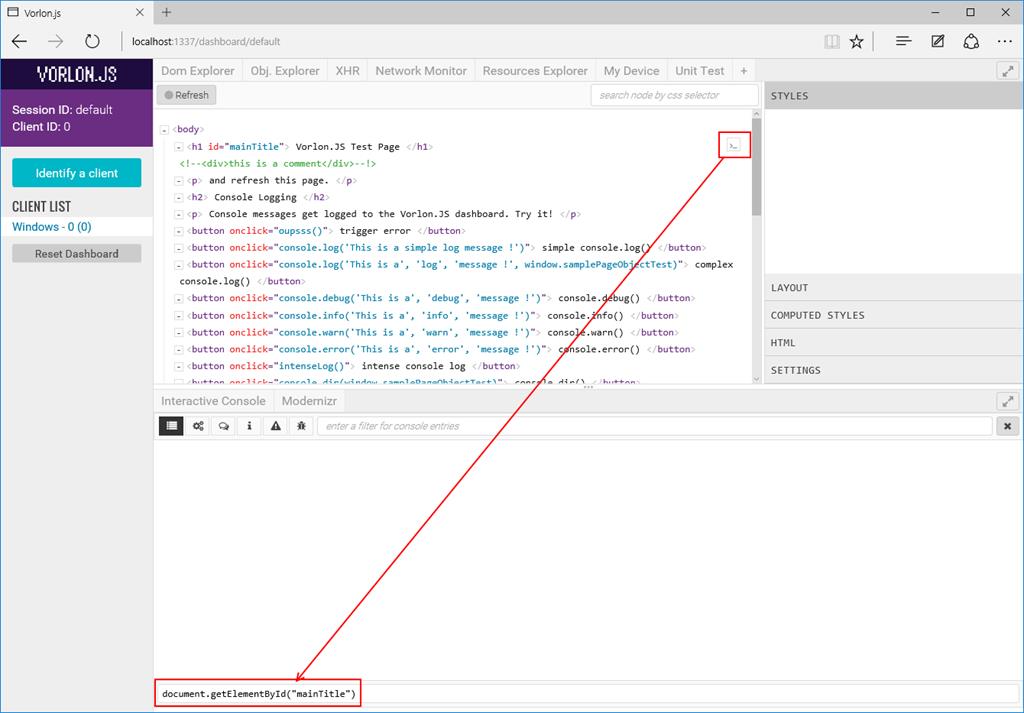
Finally, last one thing that you can find useful: When a node has an ID, you can click on the little button on the right of the node to have it linked directly in the interactive console where you will be able to execute the code you want with it:
Going further
That’s a lot of feature for a single plugin. I hope it will help you debug and fix your remote sites or web apps!
If you are interested by going further with Vorlon.js, you may find these articles interesting:
- Why we made vorlon.js and how to use it to debug your JavaScript remotely
- How to create a Vorlon.js plugin
- Vorlon.js 0.0.15 is out
We are also looking for more contributors to help us creating the most useful tool possible. So if you are interested in contributing, please visit our GitHub repository.
More hands-on with JavaScript
This article is part of the web development series from Microsoft tech evangelists on practical JavaScript learning, open source projects, and interoperability best practices including Microsoft Edge browser and the new EdgeHTML rendering engine.
We encourage you to test across browsers and devices including Microsoft Edge – the default browser for Windows 10 – with free tools on dev.modern.IE:
- Scan your site for out-of-date libraries, layout issues, and accessibility
- Use virtual machines for Mac, Linux, and Windows
- Remotely test for Microsoft Edge on your own device
- Coding Lab on GitHub: Cross-browser testing and best practices
In-depth tech learning on Microsoft Edge and the Web Platform from our engineers and evangelists:
- Microsoft Edge Web Summit 2015 (what to expect with the new browser, new supported web platform standards, and guest speakers from the JavaScript community)
- Woah, I can test Edge & IE on a Mac & Linux! (from Rey Bango)
- Advancing JavaScript without Breaking the Web (from Christian Heilmann)
- The Edge Rendering Engine that makes the Web just work (from Jacob Rossi)
- Unleash 3D rendering with WebGL (from David Catuhe including the vorlon.JS and babylonJS projects)
- Hosted web apps and web platform innovations (from Kevin Hill and Kiril Seksenov including the manifold.JS project)
More free cross-platform tools & resources for the Web Platform:
 David Catuhe
David Catuhe is a Principal Program Manager at Microsoft focusing on web development. He is author of the babylon.js framework for building 3D games with HTML5 and WebGL. Read his blog on MSDN or follow him on Twitter.