

Back in June, Ektron and SitePoint jointly sponsored the State of Web Development 2006 survey, polling the people who actually build the Web to discover the truth about the technologies and practices being used by the community. The survey asked people about their jobs, the tools they use, the platforms they develop for, and the practices they apply to their design and development tasks. In this article, we present an overview of the survey, the data collected, and the sorts of information that can be extracted from the data with deeper analysis.
Key Takeaways
- The State of Web Development 2006 survey, sponsored by Ektron and SitePoint, revealed insights about the technologies, practices, and tools used by web developers. The survey identified four stereotypes of web developers: the Guru, the Entrepreneur, the Designer, and the Corporate.
- The survey discovered trends in web development, such as 68% of developers using PHP, 40% using Dreamweaver as their primary development environment, and 46% planning to introduce AJAX technology into their projects. It also revealed that 37% of developers primarily use a home-grown content management system.
- The survey results also showed correlations between certain practices and preferences. For instance, developers who use PHP are likely to be planning to use Python or Ruby on Rails, less likely to use a commercial CMS, and more likely to use a home-grown or open-source CMS. Developers who use magazines as a learning resource are more likely to learn from books or attend user groups/conferences and less likely to use forums.
The Survey
The survey was a great success: more than 5000 people responded, probably making this the most comprehensive survey of web developers ever conducted. There was a major prize — the chance to win a 20″ widescreen flat panel display from Dell — and every respondent gained access to the information revealed by the survey.
If you didn’t enter, you’ve definitely missed out on the chance to win the prize (congratulations to Jerry Sullivan, Principal of NavillusWebWorks in South Yarmouth, MA!). However, you can get the survey results; they’re free, with the compliments of Ektron and SitePoint.
The survey asked fifteen questions:
- What best describes your primary involvement with the Web?
- What is your primary development environment?
- Which server platform(s) do you develop for?
- What server platform(s) are you not developing for, but expect to in the next 12 months?
- How extensively are you using CSS for layout?
- Do you validate your markup?
- Which do you practice in your web development work?
- For your web projects, what is the primary type of content management system you use?
- Which technologies do you or your organization use in current web projects?
- Which technologies are you or your organization planning to use in your future web projects (over the next 12 months)?
- Do you personally maintain a blog?
- What resource(s) do you use to keep your skills sharp and your knowledge timely?
- What technologies do you wish had more resources available on the Web and in print?
- Aside from specific technologies, what do you want to learn more about in the next 12 months?
- What will be the next big thing on the Web?
Some of the results were reasonably predictable. For example:
- 68% of web developers say they develop for PHP among other server platforms, and 33% say they develop only for PHP.
- 40% of web developers use Dreamweaver as their primary development environment.
- 46% of web developers are planning to introduce AJAX technology into their web projects over the next twelve months.
There were also a few surprises in the results. For example:
- 24% of web developers expect to start developing for Ruby on Rails in the next 12 months, but only 8% expect to start using Python.
- 37% of web developers primarily use a home-grown content management system, which is more than the combined number of those who use commercial (11%) or open source (24%) CMS tools.
Digging Deeper
When those of us here at SitePoint realised how much data the survey had actually collected, we wondered whether there was a way of digging deeper into the responses to gain fresh insight into the way the web development community is thinking.
Several of us spent over a month sifting through the data, looking for patterns, and documenting our findings. We discovered some definite trends in terms of the ways in which people work, the technologies they use, and the sources they tap to obtain information. We’ve published the results of this research as a PDF report, which is available for purchase from sitepoint.com.
The approach we took was not just to look at the answers to individual questions, but to correlate the answers given to combinations of questions, and thereby, to find “hidden” relationships.
Let’s look at an example to see how this works. Consider these two statements:
- “I primarily use a commercial content management system.”
- “One of the resources I use to keep my skills sharp and my knowledge timely is online forums.”
The survey results show that:
- 11% of respondents use a commercial CMS.
- 60% of respondents use online forums as a learning resource.
Would you care to guess whether or not there was any relation between these two statements? It’s not obvious, is it? Let’s find out!
We can write the answers in a simple grid like the one shown below, so that the totals represent the overall responses to each question. The totals actually vary slightly from the figures quoted before, because not every person answered every question and, as such, we had to drop some of the data for some parts of the analysis.
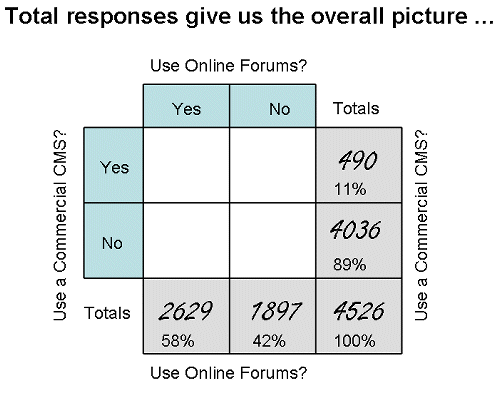
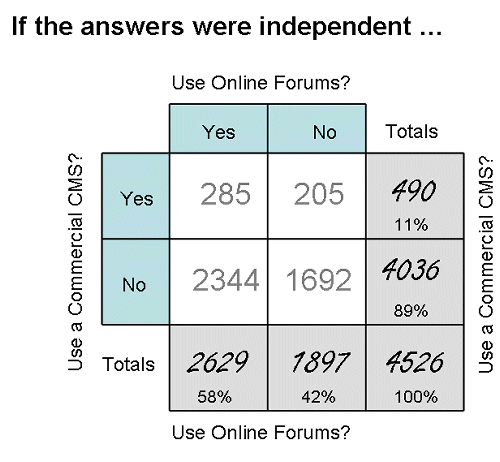
Now, if we assume for the moment that the answers to these two questions were completely independent, we can calculate the number we would expect to find in each individual cell of the grid. Since 11% of people use a commercial CMS and 58% use online forums, we would expect to find that about 58 x 11/100 = 6.4% of people use both. Applying the same reasoning to the other cells (and glossing over a few rounding issues) we can predict the number we would expect in each of the remaining cells in the grid, assuming the answers to the two questions are independent.
That’s what we expect to see. But what does the actual data show? The answer to this question is achieved by simply counting the individual responses and recording the result in the appropriate cell in the grid.
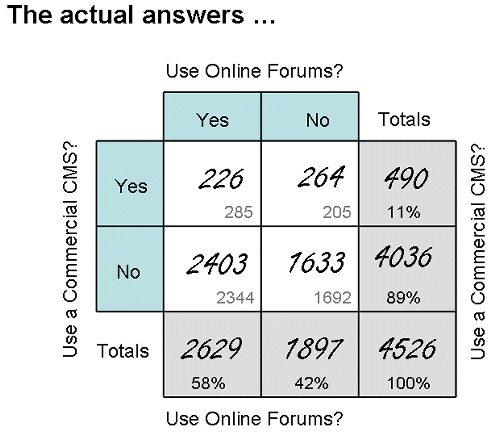
You can see at once that the numbers are different. But before we attach any significance to the difference, we have to answer an important question: could the difference simply be due to chance? After all, if you tossed a coin 10 times you might expect to get 5 heads and 5 tails, but you wouldn’t conclude the coin was biased just because you got 6 heads and 4 tails; that outcome is quite likely through chance alone. (It would be quite a different story if you tossed the coin 1000 times and got 600 heads.)
Fortunately, there are standard tests for statistical significance that can be used in situations like this. In this analysis, we’ve applied Yates X2 (chi-squared) test, which allows us to conclude that the difference between the actual data and the expected values is extremely unlikely to have occurred by chance (much less than 1 chance in 1000). So we can be confident that the answers to these two questions collected in the survey are not independent at all: they are related in some way.
Note that saying that the two answers are not independent is not the same as saying that one causes the other — both statistics could be caused by other factors. Neither does saying that something is statistically significant mean that it is actually important to us in the real world.
Now that we know there is a statistically significant relationship between the answers to these two questions, how do we interpret this data? Clearly, the data shows that people who use a commercial CMS are less likely to rely on information gathered through online forums. Of the survey respondents who use a commercial CMS, the proportion that uses online forums is 46% (226/490), while it is 60% (2403/4036) for those who do not use a commercial CMS.
(Note that in the published analysis, we have actually plotted the ratio of the Yes-Yes / No-No diagonal, which represents a positive correlation, to the Yes-No / No-Yes diagonal, which represents a negative correlation. There, we were more interested in emphasizing the direction and strength of the trend.)
Is this useful information? Well, that depends on your situation.It could be quite important knowledge if you were planning to market a commercial CMS through online forums. (Hint: consider other channels such as conferences, user groups, and, to a lesser extent, magazines.)
This is the type of analysis we applied to the data collected from the State of Web Development 2006 survey: we paired up the questions and looked to see if there were statistically significant correlations between the answers given. To give just a few examples, we learned that:
- People who develop for PHP are:
- likely to be using, or are planning to start using, Python and/or Ruby on Rails
- less likely to be planning to start using ASP .NET (go figure!)
- more likely to be using a home-grown or open-source CMS
- very much less likely to be using a commercial CMS
- more likely to learn from books or attend user groups/conferences
- less likely to be users of forums
- more likely to be using Dreamweaver or Visual Studio
- less likely to be developing in PHP
In the published analysis of the survey data, we’ve listed more than a thousand of these linked statements — some of them rather obvious, others more interesting — together with the strength of the trend and its statistical correlation. We’ve also published the raw data (with personal information removed, of course) and the intermediate analysis products for those who want to perform their own analyses.
Explaining the Patterns
The analysis turned up so many strong correlations between answers to the various questions that we started to look for reasons that might explain them. Warning: at this point, we leave the realm of statistical analysis and move into opinion and educated guesswork!
One theory is that the technologies and practices that people use tend to form natural clusters. For example, if you’ve done a lot of work with PHP, the theory suggests that you’ll tend to be more comfortable with open source tools, and therefore, you might be more likely to be thinking about trying Python or Rails and less likely to be considering ASP.NET. And, since open source tools are generally supported through community tools such as forums and blogs, you’ll be more comfortable with these tools, too.
That’s not a particularly radical idea, but the survey data actually lets us identify some of these clusters of related practices. As we explored the data, we found that the clearest clusters represented stereotypes of different types of web developers, so we gave them names:
- The “Guru” is strongly motivated toward technical excellence, actively tracks new technological trends, and is interested in learning how to use them to improve the quality and functionality of web sites.
- The “Entrepreneur” is strongly motivated toward building and retaining an audience, and is less interested in using technologies just because they’re new.
- The “Designer” is strongly motivated toward the timely delivery of visually appealing web sites that meet the business requirements of clients.
- The “Corporate” is strongly motivated toward reliable, stable performance; the “Corporate works in a larger organization, and faces the unique mixture of constraints and opportunities that the corporate environment offers.
We can’t make absolute predictions about what these different groups think, but we can identify clear trends. Our “Entrepreneur,” for example, is most likely to say that he or she:
- runs an ecommerce business
- wants to learn about email marketing and search engine optimization
- develops with Dreamweaver
- is planning to get into blogging and podcasting
And the same person is least likely to say that he or she:
- works for a design firm or manages a company web site
- practices versioning, MVC, or OOP
- develops with a text editor, Visual Studio, or Zend
- uses AJAX, wikis, or Microformats
For the record, the correlation we used as an example earlier can be explained by noting that the use of commercial content management systems and a tendency not to rely on online forums are both characteristic of the “Corporate” stereotype.
A complete profile for each of these stereotypes is contained in the published analysis, along with:
- the raw data from the survey, in an Excel spreadsheet (with personal information removed)
- the statistically correlated data, also as an Excel spreadsheet
- the same correlated data presented as an HTML file that’s more human-readable
Conclusion
That brings us to the end of this tour of the Ektron-SitePoint “State of Web Development” survey. Even though we’ve only had time to touch on a few highlights, we hope this article has shown that there is a wealth of valuable information contained in the survey results.
If you’d like to pick up a copy of the 2006 survey results, you can download it for free.
And if you feel like digging deeper, you can purchase access to the complete survey data (with respondents’ personal information removed), together with our analysis of the data. This report comes complete with insightful commentary, as well as tools for performing your own analysis — we believe it to be the most comprehensive snapshot of the state of web development today.