

Key Takeaways
- OpenLayers is a powerful alternative to Google Maps, offering extensive customization and the ability to use a variety of map sources including WMS, WMTS, Bing Maps, and OSM. Unlike Google, it allows usage in authenticated areas of a website.
- OpenLayers supports the addition of vector layers, which can contain features made up of geometries. This allows users to add their own data to the map, such as specific locations.
- The tool provides a high level of customization, enabling users to alter the style of map features, control the layout and positioning of map controls, and even create custom controls.
- OpenLayers is designed to handle large amounts of data and provides smooth rendering of map features, using techniques like tile caching and hardware acceleration to ensure high performance. It also supports GeoJSON, a popular format for encoding a variety of geographic data structures.
Most of you have probably at some point used or looked at the Google Maps API or Bing Maps API because you wanted a fancy map on a contact page with a pointer on it. Let’s be honest; it adds an interactive element to the page which might give it a little more wow effect. Unfortunately, Google for one doesn’t allow you to use their maps in an area of your site that requires authentication.
OpenLayers gives you a way to visualize your data the way you want it in any environment. You are not bound by provided map material and can choose from a wide variety of map backgrounds. The OpenStreetMap is one of the best examples, maintained by volunteers like you and me. You’re allowed to update the map itself if you come across any flaws. The interface for this is easy and they’ll implement your change immediately.
Getting Started
The OpenLayers basics are simple – include the JavaScript in your page, place a div with an id and pass that to OpenLayers. The following example uses jQuery to load OpenLayers, but jQuery is not required.
jQuery(window).on('load', function() {

  var map = new OpenLayers.Map('map', {

    projection: new OpenLayers.Projection('EPSG:900913')

  });

  var osm = new OpenLayers.Layer.OSM();

  var gmap = new OpenLayers.Layer.Google('Google street maps');

  var bing = new OpenLayers.Layer.Bing({

    key: 'register your api key at bingmapsportal.com',

    type: 'Road',

    metadataParams: { mapVersion: 'v1' }

  });
  map.addLayers([osm, gmap, bing]);

  map.setCenter(new OpenLayers.LonLat(2.2, 54.0)

    .transform(new OpenLayers.Projection('EPSG:4326'), map.getProjectionObject()), 5);

  map.addControl(new OpenLayers.Control.LayerSwitcher());

});
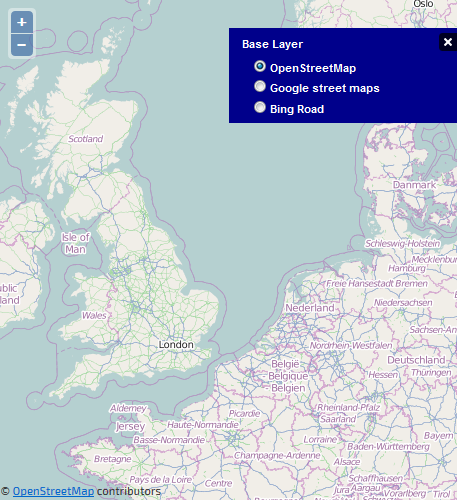
And now we have one map which holds the OpenStreet map, Google Street map, and Bing Street map.
There is one thing that I feel needs explanation. On the first line, you’ll see something about projections. What’s that you might ask? A projection is a way to see the world. For some time in the past the earth was believed to be flat and projections are a way to make the earth flat again. We all know the WGS84 coordinate system from our GPS (aka. EPSG:4326), but most countries have one or more projections which they use for their geographical data.
Quite popular in these applications is the Spherical Mercator projection (EPSG:900913), which is also used by Google and Bing. So that is why we tell OpenLayers to use that one. This is where OpenLayers excels. You can set different projections on each layer or data, and OpenLayers will handle the transformation between them.
The rest of the example speaks for itself – create all the map layers, add them to the view, center on some place (note the transformation again), and show a layer switcher.
Let’s Place Something on the Map
Now, let’s add our own thing to the map. For OpenLayers this means adding a vector layer. A vector layer will contain features which are made up of geometries. Let’s start with a simple one and add your location to the map. Here’s how it’s done.
var overlay = new OpenLayers.Layer.Vector('Your location');

var map = new OpenLayers.Map('map');
map.addLayers([new OpenLayers.Layer.OSM('OSM'), overlay]);

map.setCenter(

  new OpenLayers.LonLat(2.2, 54.0).transform(

    new OpenLayers.Projection('EPSG:4326'),

    map.getProjectionObject()

  ), 11);
navigator.geolocation.getCurrentPosition(function(position) {

  var yourLocation = new OpenLayers.Geometry.Point(position.coords.longitude, position.coords.latitude)

        .transform(new OpenLayers.Projection('EPSG:4326'), map.getProjectionObject());
  map.getLayersByName('Your location')[0].addFeatures([new OpenLayers.Feature.Vector(yourLocation)]);

  map.setCenter(new OpenLayers.LonLat(yourLocation.getCentroid().x, yourLocation.getCentroid().y));

});
The first line adds the vector layer. A point is created, based on your location, which is added as a feature to the vector layer. The map is then centered on you.
Adding Your Own Style
Would you be satisfied with orange dots on the map? Probably not. Luckily, it’s quite simple to customize your map with your own style map. Each layer can have a different style. On a layer there can be different styles for normal features (‘default’) or ‘selected’ features. Here’s an example of a simple style map with only a ‘default’ style.
var styleMap = new OpenLayers.StyleMap({
pointRadius: 20,
strokeColor: '#ff0000',
fillColor: '#ff0000',
fillOpacity: 0.6
});
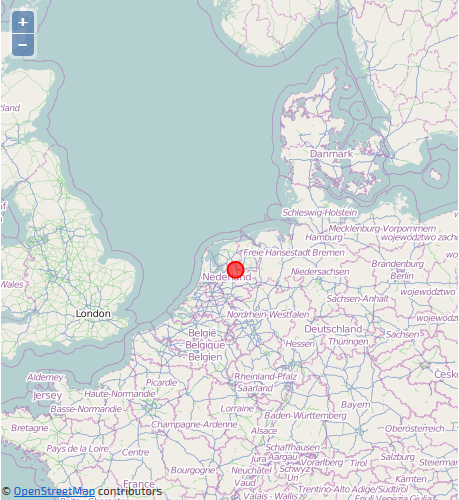
var overlay = new OpenLayers.Layer.Vector('Your position', {styleMap: styleMap});
This causes our location to be displayed as a somewhat transparent red dot. But, we can go even further with this. If your features have attributes, you can tell the style to use those named attributes like this.
var styleMap = new OpenLayers.StyleMap({

  pointRadius: '$(pointRadius)',

  strokeColor: '#ff0000',

  fillColor: '$(pointColor)',

  fillOpacity: 0.6

});
If you have other requirements you can go even further. Define a context with references to functions which will be passed the current feature being rendered. From there control the rendering. An example of this is shown below.
var context = {

  getColor: function(feature) {

    return '#00ff00';

  },

  getPointRadius: function(feature) {

    return 15;

  }

}

var template = {

  strokeColor: '${getColor}',

  pointRadius: '${getPointRadius}',

}

var styleMap = new OpenLayers.StyleMap(new OpenLayers.Style(template, {context: context}));
Dynamic Map Data
Now, if you’re following along then you have something to show, right? Let’s talk about how you query your own back end for data to display. Below you see an example of a dynamic vector layer.
var myLayer = new OpenLayers.Layer.Vector('My vector data', {

  strategies: [new OpenLayers.Strategy.BBOX()],

  protocol: new OpenLayers.Protocol.HTTP({

    url: 'http://my.server.net/geoData',

    params: {

        src: map.projection,

        maxfeatures: 1500,

    },

    format: new OpenLayers.Format.GeoJSON(),

  }),

  styleMap: new OpenLayers.StyleMap(style),

});
The Bounding Box (BBOX) strategy will read new features when the views bounding box changes. I’ve chosen to use GeoJSON as the return format from my URL. OpenLayer supports many formats – KML, XML, GPX, XLS, CSV, JSON, GeoJSON, GeoRSS, and many more.
You’ll get a request there with a bounding parameter bbox=left,bottom,right,top. Those are the outer bounds of the current viewport. It is wise to pass yourself the projection of the layer for verification. I’ve also added maxFeatures to tell my back end how much to return. Here it’s set at 1500, which is quite a lot. Current web browsers might start to show problems depending on the performance of you users’ computers/devices. Moving around >500 elements in the DOM and rendering them might be a lot to ask. OpenLayers has a solution for that called Clustering.
var myLayer = new OpenLayers.Layer.Vector("My vector data", {

  strategies: [new OpenLayers.Strategy.BBOX(),

               new OpenLayers.Strategy.AnimatedCluster({

                  distance: 10,

                  animationMethod: OpenLayers.Easing.Expo.easeInOut,

                  animationDuration: 10

              })],

  protocol: new OpenLayers.Protocol.HTTP({

      ...

});
You can add that as a strategy to your layer so that it’ll start clustering your points if they are within a certain radius. In my example here I use the Animated Cluster strategy which you can download. It does the same with a fancy animation.
Now you have a solution that’ll ask you what you want to show within the users area. If features come too close it’ll nicely cluster them. You could add a different style to a cluster to show just that. It’s really up to you to decide!
Conclusion
With OpenLayers you get a lot of freedom in the way you supply and visualize your data. Take a look at the examples and API description at the OpenLayers website, and see how you can also draw on your vector layer. Don’t forget to check and update your neighborhood in the OpenStreetMap if you do use it.
We’re interested to hear if you see possibilities to use OpenLayers. Or perhaps you’ve already implemented it somewhere. Please let us know in the comments.
You can see the code from this article in action on the demo page.
Frequently Asked Questions about OpenLayers as an Alternative to Google Maps
What makes OpenLayers a good alternative to Google Maps?
OpenLayers is a powerful, open-source JavaScript library used for displaying all kinds of geographically referenced information. It offers a wide range of features that make it a good alternative to Google Maps. For instance, it supports a variety of map sources, including WMS, WMTS, Bing Maps, and OSM. It also allows for advanced features like vector layers with custom styles, animations, and interaction handling. Moreover, being open-source, it provides the flexibility to customize and adapt the tool according to specific needs, which is not possible with Google Maps.
How does OpenLayers handle mobile and touch devices?
OpenLayers is designed to work well on both desktop and mobile platforms. It has a responsive design that adjusts to the screen size of the device being used. It also supports touch events, which means you can use gestures like pinch-to-zoom or drag-and-drop on touch devices. This makes it a versatile tool for developing interactive map applications that work seamlessly across different devices.
Can I use OpenLayers for commercial projects?
Yes, you can use OpenLayers for commercial projects. It is released under the 2-clause BSD License, which allows for free use, modification, and distribution of the software in both open and closed source projects. This means you can use it to develop commercial applications without worrying about licensing fees or restrictions.
How does OpenLayers compare to other mapping libraries?
OpenLayers stands out from other mapping libraries due to its extensive feature set, flexibility, and open-source nature. It supports a wide range of map sources, vector data, and GIS functionalities. It also allows for high customization, which can be a significant advantage over other libraries that may not offer the same level of flexibility. However, it’s worth noting that the choice of a mapping library should depend on the specific needs of your project.
Is it difficult to learn and use OpenLayers?
OpenLayers has a steep learning curve compared to some other mapping libraries. However, it offers extensive documentation and a supportive community that can help you get started. Once you get the hang of it, you’ll find that it provides a powerful and flexible platform for creating interactive map applications.
Does OpenLayers support 3D mapping?
Yes, OpenLayers supports 3D mapping through integration with other libraries like OL-Cesium. This allows you to create interactive 3D globes and maps, adding an extra dimension to your geospatial data visualization.
Can I customize the look and feel of maps in OpenLayers?
Absolutely. OpenLayers provides a high level of customization. You can change the style of map features, control the layout and positioning of map controls, and even create your own custom controls. This allows you to tailor the look and feel of your maps to match your application’s design.
How is the performance of OpenLayers?
OpenLayers is designed to handle large amounts of data and provides smooth rendering of map features. It uses techniques like tile caching and hardware acceleration to ensure high performance, even when dealing with complex maps and large datasets.
Does OpenLayers support GeoJSON data?
Yes, OpenLayers supports GeoJSON, a popular format for encoding a variety of geographic data structures. This means you can easily import and display GeoJSON data on your maps.
Can I contribute to the OpenLayers project?
Yes, being an open-source project, OpenLayers welcomes contributions from the community. You can contribute in various ways, such as reporting bugs, improving documentation, or even adding new features. This is a great way to give back to the community and help improve the tool for everyone.