


Key Takeaways
- Airbrake.io is a comprehensive error monitoring service that can track and report on actual errors that users encounter in real time. It provides a range of useful details about how the error occurred, including browser version, operating system, session data, and a backtrace of the error.
- Airbrake supports a broad range of back-end and front-end languages and environments, and integrates with popular code management and deployment services. The reporting interface is clean and easy to navigate, allowing for quick generation of actionable information from deployed production code.
- Implementing Airbrake into a product is straightforward. After creating an account, a range of pre-written integration code options are provided. Airbrake provides a project id and an api key to be inserted into the app source file, allowing Airbrake to catch and track errors.
- Airbrake’s error monitoring provides detailed reports on every error encountered in a production environment, including when it occurred, where it came from, and how many times it’s happened. This information can save time, money, and frustration in a real-world production environment.
This article was sponsored by Airbrake. Thank you for supporting the partners who make SitePoint possible.
We’re all very careful about testing our code before putting it out into a production environment, right? We use test-driven development or build out elegant suites of unit tests, functional tests, and integration tests. We run our products through all the likely environments where it may be deployed repeatedly every time we make a change to our code. We test every possible path a user could follow on every conceivable browser.
Right?
Well, ok, none of us is perfect. But at least our users are always diligent about reporting every error they encounter, and providing detailed information about exactly how to reproduce those errors so they’re easy to track down and fix.
Right?
Yeah, I didn’t think so.
Error Monitoring to the Rescue!
Thankfully there are services out there to help us diagnose and resolve issues that may have slipped through the infinitesimal cracks in our diligent quality testing procedures.
I’m talking about remote error monitoring services. If you haven’t heard of them before, remote error monitoring services can track and report on actual errors that users encounter in real time as they happen, before the user even has a chance to file a vague or misleading bug report.
In addition, they can provide you with a range of useful details about how the error came about: what browser version the user was running, what account was logged in, what operating system was being used, any session data, a backtrace of the error itself, as well as any custom tags you might have inserted into your code to help identify issues.
Getting Started With Error Monitoring
There are a number of services and options in the market, but a good comprehensive one is Airbrake.io. They’ve been around for a long time in internet years, so you may remember them as Hoptoad back before they changed their name in 2011.
Airbrake also supports a very broad range of back-end and front end languages and environments from Ruby and PHP to .NET and Node.js. They also offer native integration with most of the popular code management and deployment services such as GitHib, JIRA, Bitbucket, and Slack. It’s likely that whatever you’re working with, they have the tools you need to get started quickly and easily. Their reporting interface is also clean and easy to navigate, so you can start generating actionable information from your deployed production code quickly.
Implementing the Airbrake.io code into your product is straightforward. To get started, you can create an account at Airbrake.io that’s free for the first 14 days while you kick the tires, with no credit card required during the trial period.
When you create your first project, you’ll be provided with a range of options with pre-written integration code in over 20 languages. As an example, let’s say we want to use JavaScript end-to-end, and have an Express based Node.js api service on the back end.
Monitoring an Express App
Let’s set up a quick example to show how easy integrating error monitoring with Airbrake can be. Assuming we already have node installed, in the terminal we can create a simple Express app to monitor using the Express Generator, which we can install with yarn or npm:
yarn global add express-generator
We can then run it to create a bare-bones Express app:
express sample-app
Then cd into the directory that was created and run yarn (or npm install if you prefer) to install our dependencies
cd sample-app
yarn
Then run node bin/www to start our server, optionally setting a port with PORT=#### at the beginning of the command. (If we don’t specify a port, node will default to port 3000.)
node bin/www
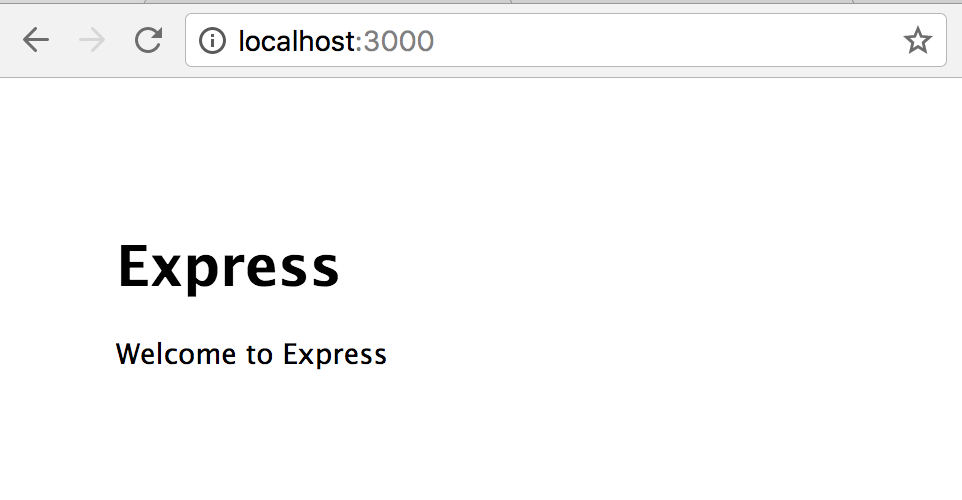
Now if we navigate to http://localhost:3000 in the browser, we’ll see a basic Express app that just says “Welcome to Express.”
You can either add Airbrake to your dependencies or use yarn or npm to install airbrake. We’ll already have a package.json file in our Express app, so we can simply add a line at the bottom of our dependencies specifying airbrake and a target version:
{
  "name": "sample-app",
  "version": "0.0.0",
  "private": true,
  "scripts": {
    "start": "node ./bin/www"
  },
  "dependencies": {
    "body-parser": "~1.17.1",
    "cookie-parser": "~1.4.3",
    "debug": "~2.6.3",
    "express": "~4.15.2",
    "jade": "~1.11.0",
    "morgan": "~1.8.1",
    "serve-favicon": "~2.4.2",
    "airbrake": "^2.1.0"
  }
}
Of course current version numbers and specific dependencies may have changed in this file, but the concept is the same. They key is to add airbrake, in this case as the last line of the dependencies. Once this file is updated, we can just run yarn (or npm install) again in our main app directory to update our app.
yarn
Now all we need to do is add the sample Express airbrake code near the top of our app source file app.js, after our app variable has been defined. Airbrake can take advantage of the built-in error handling provided by Express versions as early as 2.x.
var airbrake = require('airbrake').createClient(
  '<YOUR_AIRBRAKE_PROJECT_ID>',
    '<YOUR_AIRBRAKE_API_KEY>'
);
app.use(airbrake.expressHandler());
Airbrake will provide you with a project id and an api key, and will include them in the sample code they provide once you’ve logged into your account. Now the errors that would normally be caught by Express, as well as any other errors your code may generate, will be caught and tracked by Airbrake.
Checking Our Error Monitoring
For example, let’s see what happens when JavaScript throws an error. We can add code to throw a new Error into the default route handler in our routes/index.js file to trigger a JavaScript error, and see how it is tracked:
var express = require('express');
var router = express.Router();
/* GET home page. */
router.get('/', function(req, res, next) {
  res.render('index', { title: 'Express' });
  throw new Error('I am an uncaught exception');
});
module.exports = router;
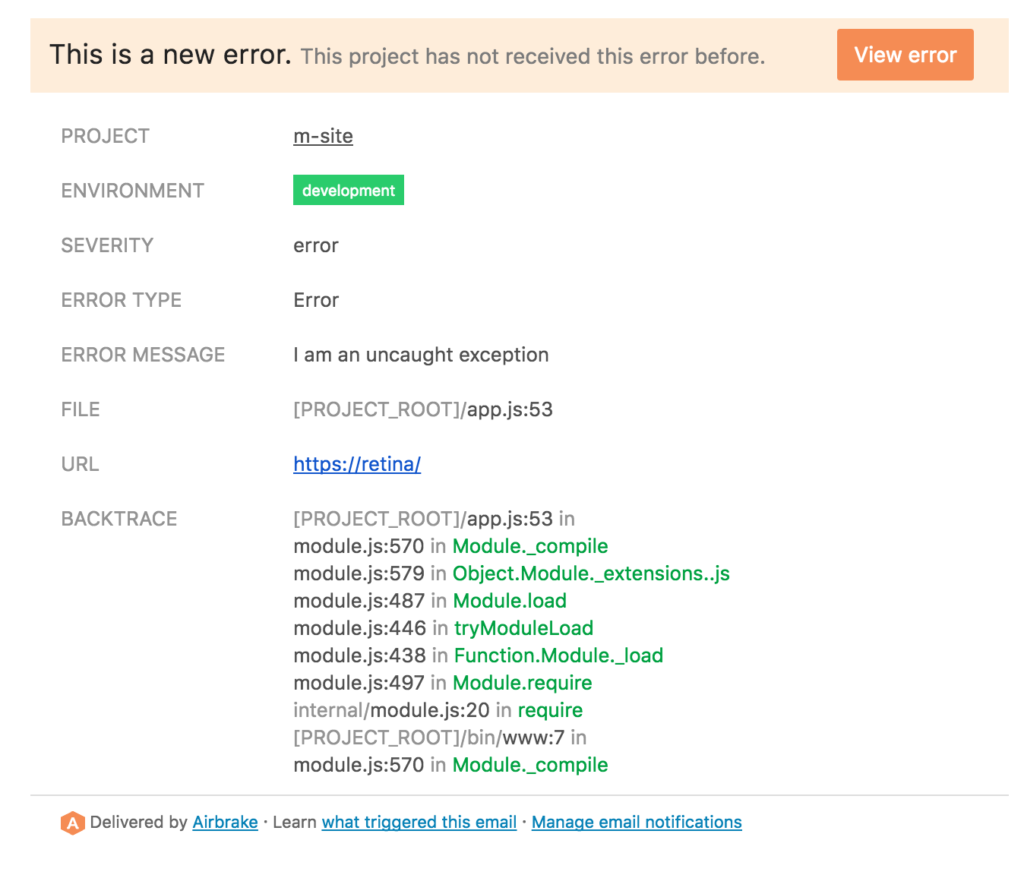
If this were a regular production site, the first thing we might notice when the homepage generates that error is an email message from Airbrake, or possibly a notification in Slack or some other supported alert system. Airbrake lets you easily customize how frequently alerts of various kinds are sent, where they should go, and what events should trigger a notification.
With the default account settings, we would receive an email at the developer’s account with an overview of the error that occurred. In this case, it would include a warning that this is the first time this error has been encountered.
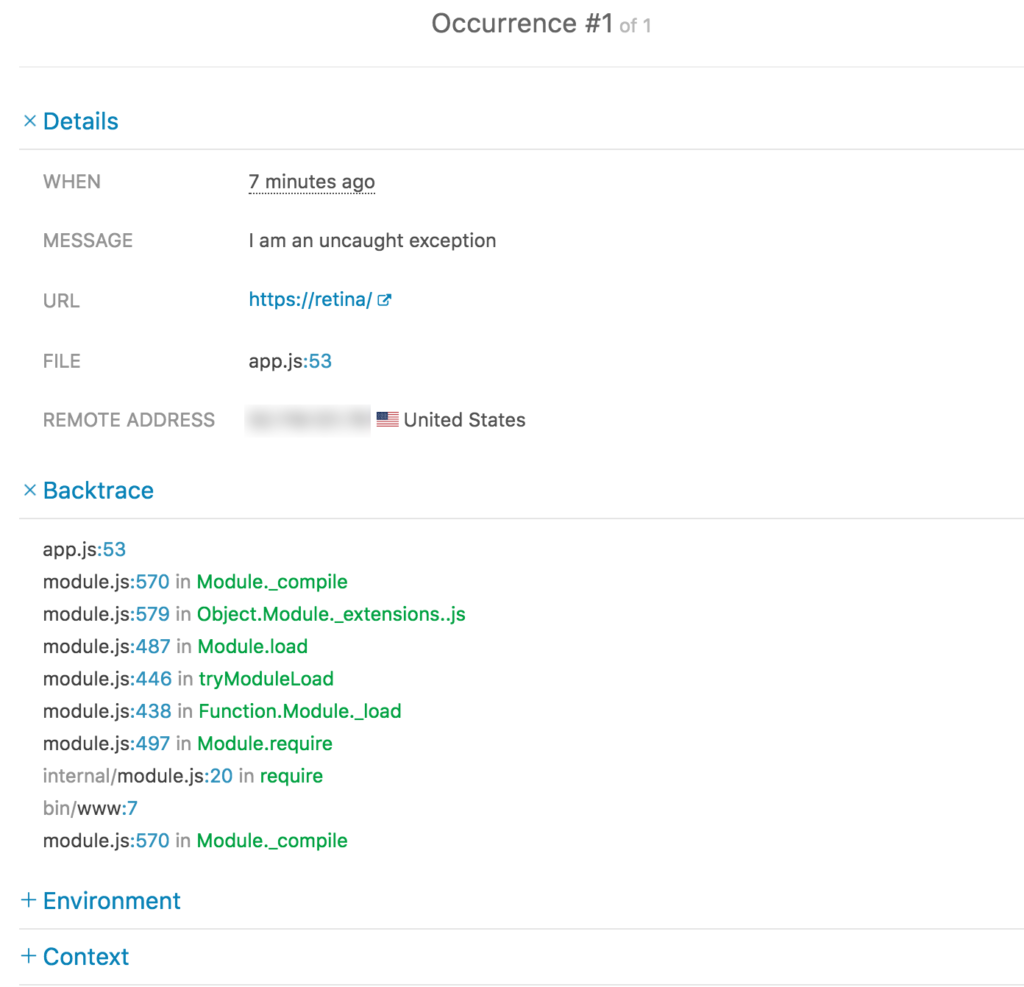
Next we can visit our Airbrake dashboard and see the error reflected in our reports, along with a lot of useful information including the custom message we created, when the error occurred, where it came from, the specific url and host, and how many times it’s happened. (Just once so far.)

Visiting the “Occurrences” tab on the dashboard will show us a backtrace from our server code to help us debug when and where the error might have been triggered in our code.
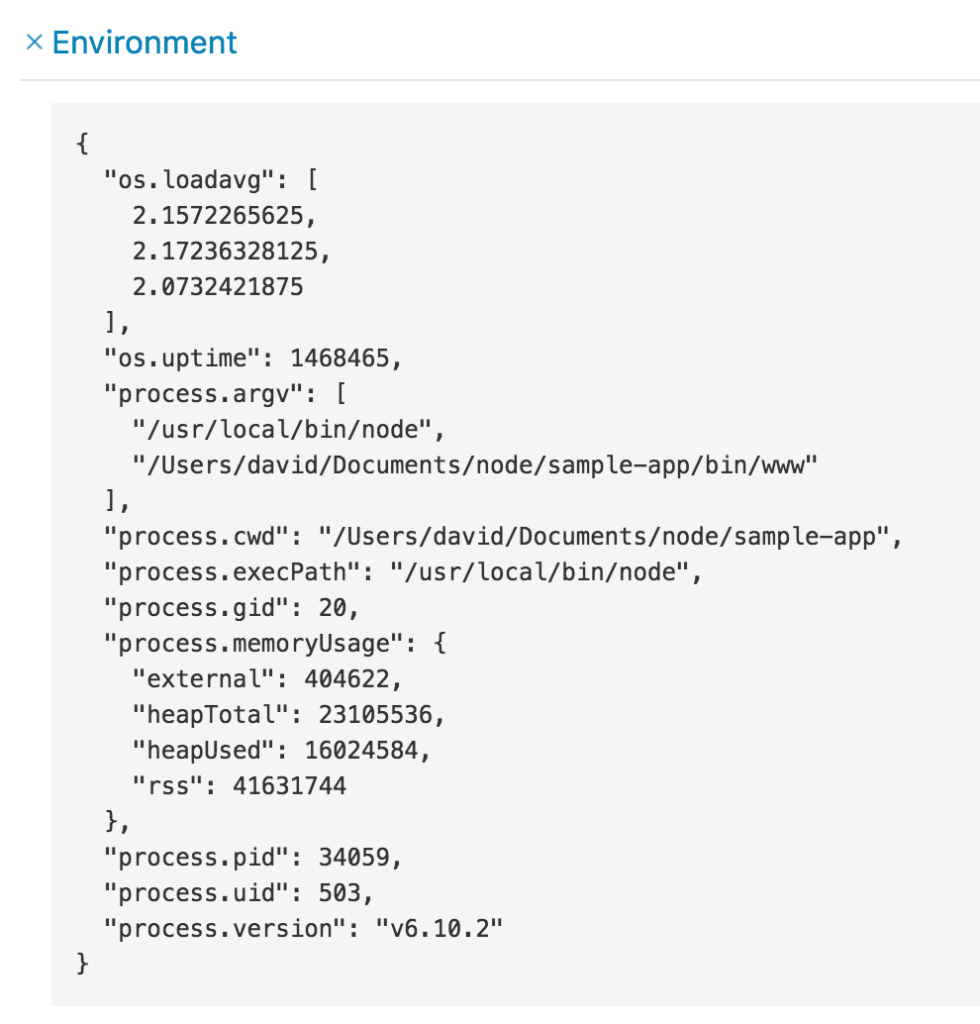
Expanding the “Environment” section of the tab will show us a number of useful details about our server and the processes that were running when the error occurred.
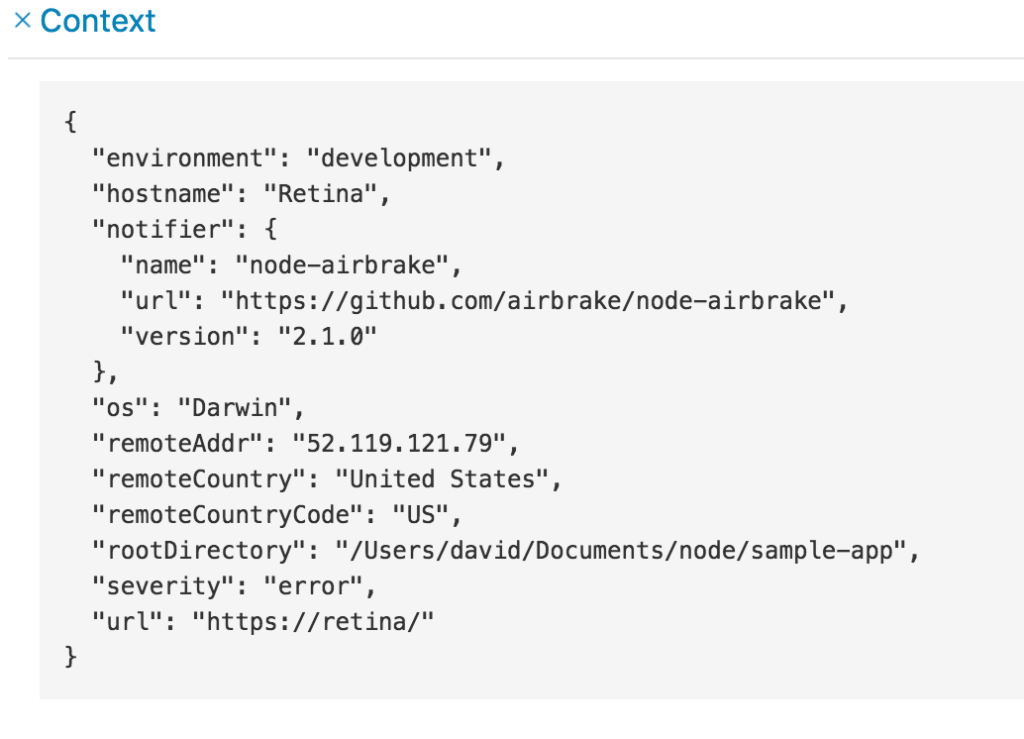
More information can be found by expanding the “Context” section of the tab, telling us about the operating environment our scripts were running in when the error happened.
Your App’s New Best Friend
Imagine that level of error coverage spread out over your entire user base, tracking every error on your app your users encounter in a production environment, and tabulating the results.
You can easily see how helpful this kind of information might be in a real-world production environment where users aren’t seeing what you want them to see. And thanks to the complete and detailed reports, think about how much time, money, and frustration you could save.
With Airbrake’s remote error tracking, you won’t have to wait for your friends to tell you when something’s wrong with your app. You’ll already know.
Frequently Asked Questions (FAQs) on Setting Up Airbrake Error Monitoring for Your JavaScript App
What is Airbrake Error Monitoring?
Airbrake Error Monitoring is a robust error tracking software designed to provide real-time error alerts and detailed diagnostic reports. It is designed to help developers identify and fix errors in their applications quickly. It supports multiple programming languages, including JavaScript. The tool provides insights into how many times an error occurred, what was happening at the time, and who might be affected.
How does Airbrake Error Monitoring work with JavaScript?
Airbrake Error Monitoring integrates seamlessly with JavaScript. Once you’ve installed and configured Airbrake in your JavaScript application, it will automatically start monitoring for errors. When an error occurs, Airbrake captures detailed information about the error and sends a report to your dashboard. This report includes crucial details like the type of error, where it occurred, and the environment in which it happened.
How do I set up Airbrake Error Monitoring for my JavaScript app?
Setting up Airbrake for your JavaScript app involves a few steps. First, you need to sign up for an Airbrake account. After that, you install the Airbrake notifier for JavaScript using npm or yarn. Then, you configure the notifier with your project id and project key, which you can find in your Airbrake account. Once set up, Airbrake will start monitoring your app for errors.
What kind of errors can Airbrake Error Monitoring detect in a JavaScript app?
Airbrake can detect a wide range of errors in a JavaScript app. This includes runtime errors, syntax errors, and logical errors. It can also track AJAX calls, console logs, and route changes. This comprehensive error tracking helps you identify and fix issues quickly, improving your app’s overall performance and user experience.
Can I integrate Airbrake Error Monitoring with other tools?
Yes, Airbrake Error Monitoring can be integrated with a variety of other tools. This includes project management tools like Jira and Trello, communication tools like Slack and HipChat, and version control systems like GitHub and Bitbucket. These integrations allow you to streamline your workflow and manage errors more effectively.
How does Airbrake Error Monitoring help in improving the performance of my JavaScript app?
By providing real-time error alerts and detailed diagnostic reports, Airbrake helps you identify and fix issues quickly. This reduces downtime and improves the overall performance of your app. Additionally, Airbrake’s performance monitoring features allow you to track your app’s response times and throughput, helping you identify performance bottlenecks.
Is Airbrake Error Monitoring secure?
Yes, Airbrake takes data security seriously. It uses SSL encryption for data in transit and at rest. It also complies with GDPR and other privacy regulations, ensuring that your data is handled securely and responsibly.
How does Airbrake Error Monitoring compare to other error monitoring tools?
Airbrake stands out for its real-time error alerts, detailed diagnostic reports, and seamless integration with other tools. It supports a wide range of programming languages, including JavaScript. While other tools offer similar features, Airbrake’s user-friendly interface and robust error tracking capabilities make it a popular choice among developers.
Can I customize the error alerts in Airbrake Error Monitoring?
Yes, Airbrake allows you to customize error alerts. You can choose to receive alerts via email, Slack, or other communication tools. You can also set up custom filters to control which errors trigger alerts, helping you focus on the most critical issues.
What support options are available for Airbrake Error Monitoring?
Airbrake offers a variety of support options. This includes a comprehensive documentation library, a community forum, and a dedicated support team. You can also find a wealth of information and tutorials online to help you get the most out of Airbrake.

