
In a previous article , I covered the basics of Chartkick – a great library to easily render graphs in Rails apps. The article gained some attention so I decided to cover a bit more and show how Chartkick, along with Groupdate, can be used to solve a real-world task.
Just to remind you, Chartkick is a gem that integrates with Rails and provides methods to quickly render graphs based on your data. This gem supports Chart.js, Google Charts, and Highchart adapters. Chartkick comes with out-of-the-box support for Groupdate, which simplifies writing some complex grouping queries.
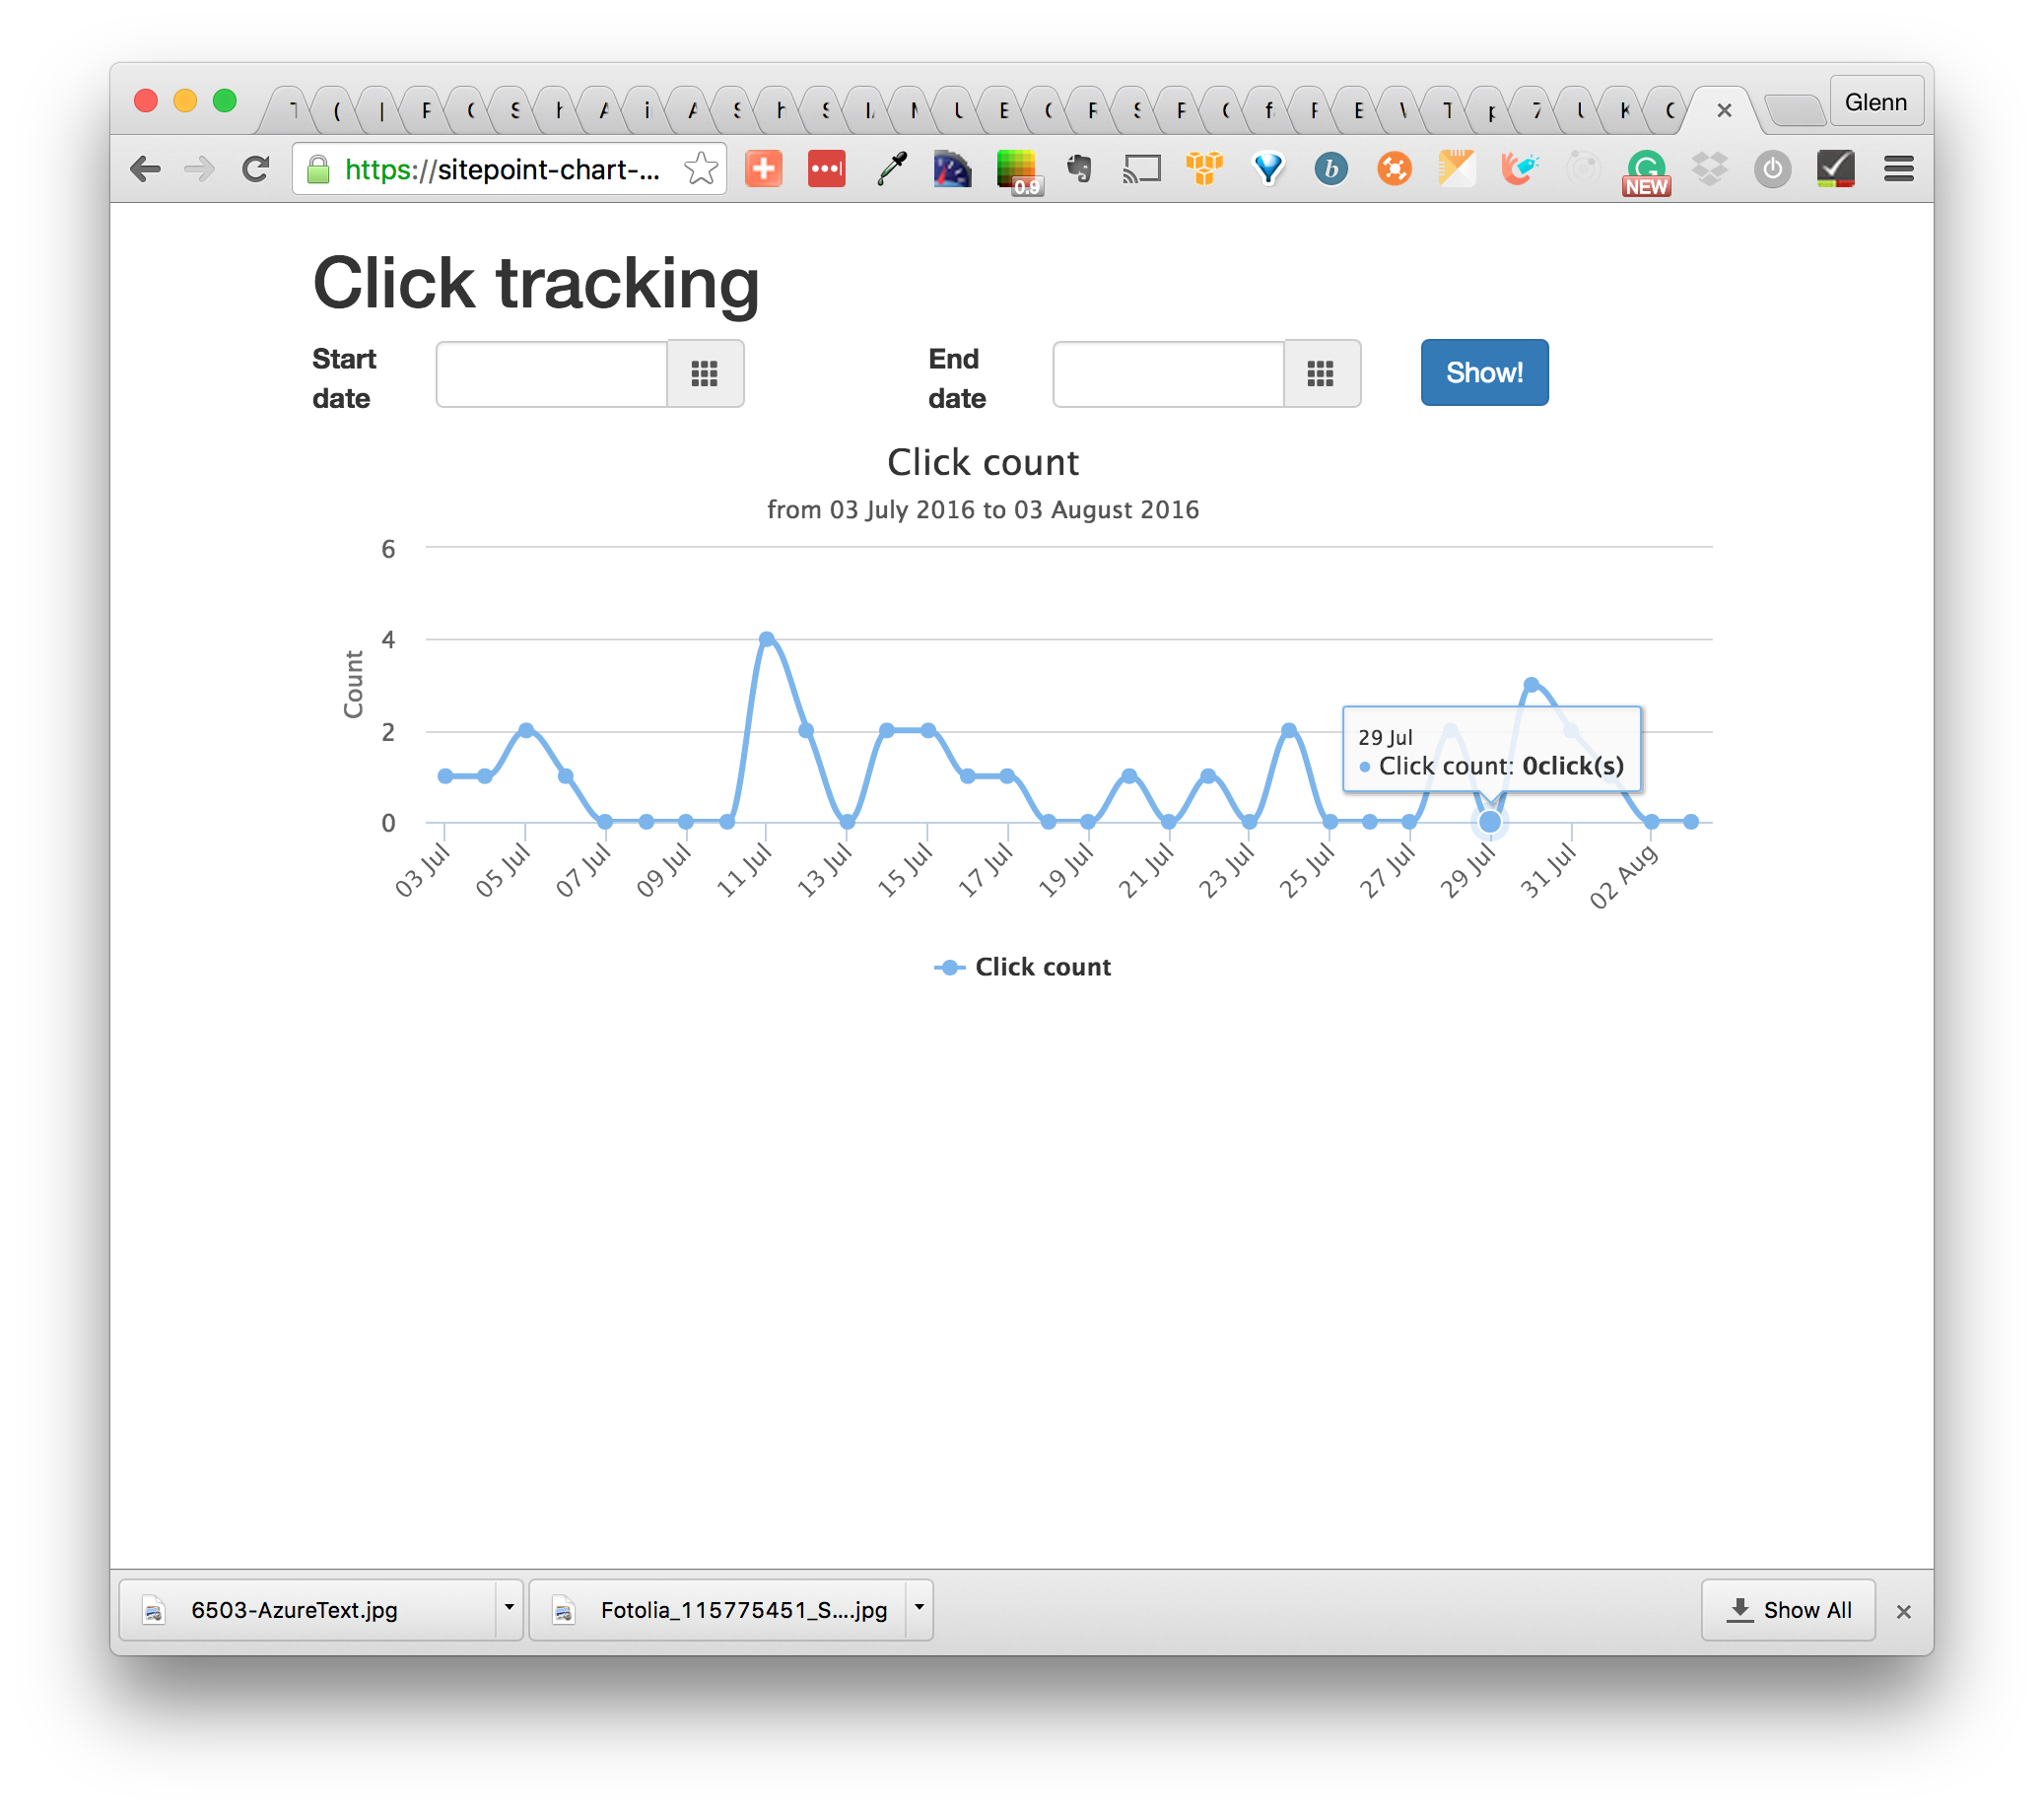
In this post I will show you how to build an app visualizing click counts by day, month, or year for various items. Users will be able to select the date range with the help of a handy date picker and the resulting graph’s scale will change accordingly.
The source code can be found on GitHub.
The working demo can be found on Heroku.
Key Takeaways
- Chartkick integrates seamlessly with Rails, enabling easy creation of dynamic graphs using data from your Rails application, with support for Chart.js, Google Charts, and Highcharts.
- The Groupdate gem complements Chartkick by simplifying complex date grouping queries, essential for organizing and visualizing time-series data effectively.
- Implementing a user-friendly date selection interface with Bootstrap Datepicker enhances interactivity, allowing users to customize the data range displayed in the graphs.
- Asynchronous graph rendering improves the user experience by loading data in the background, thus keeping the interface responsive and engaging.
- The combination of Chartkick and Groupdate allows for flexible, dynamic data grouping based on user-selected time ranges, which can be adjusted to display data by day, month, or year, accommodating various analytical needs.
Preparations
For this demo I will be using Rails 5, but the steps are nearly identical for Rails 3 and 4.
Okay, so the idea is to build an app that hosts a number of “items” – it does not really matter what these items are, but suppose we sell fruits via an online store. Our customer is very interested to see how many clicks each fruit garners, asking us to store that information and visualize it somehow. They want to see how many clicks were done each day for each item with the ability to change the date range to things like “The last six months” or “The last year.”
OK, the task is clear and we’ll dive into the code now.
Create a new Rails app called Tracker without the default testing suite:
$ rails new Tracker -T
Drop in these gems:
Gemfile
[...]
gem 'chartkick'
gem 'groupdate'
gem 'bootstrap-sass'
gem 'pg'
[...]
Chartkick is, of course, our main tool for today. groupdate is a nice addition allowing to use advanced queries with ease. bootstrap-sass will be used for styling and pg is the PostgreSQL adapter. Note that Groupdate will not work with SQLite 3!
Install your gems now:
$ bundle install
Don’t forget to create a new Postgres database and configure the app to work with it. You may use this sample config to get started:
config/database.yml
development:
  adapter: postgresql
  encoding: unicode
  database: tracker
  pool: 5
  username: "PG_USER"
  password: "PG_PASSWORD"
  host: localhost
  port: 5432
On top of that, we’ll also need some additional assets:
Highcharts is a great library to build interactive graphs and I am going use it in this demo. Still, you may stick with either Chart.js (which is used by default starting from Chartkick v2) or Google Charts. Bootstrap Datepicker is an add-on for Bootstrap that we are going to use to build the form.
Now hook up all these assets (note that Turbolinks should be placed last):
javascripts/application.js
//= require jquery
//= require jquery_ujs
//= require datepicker
//= require highcharts
//= require chartkick
//= require turbolinks
stylesheets/application.scss
@import 'bootstrap-sprockets';
@import 'bootstrap';
@import 'datepicker';
Great! Of course, we’ll need data and a place to store them, so let’s proceed to the next section and create models.
The Models
Generate two very simple models: Item and ClickTrack
$ rails g model Item title:string
$ rails g model ClickTrack item:belongs_to
$ rake db:migrate
Item is our product and click track is created every time the item was clicked. We are not going to code this logic but, as you see, it is really simple. Make sure that you’ve set up the one-to-many relation between the models:
models/item.rb
class Item < ApplicationRecord
  has_many :click_tracks
end
models/click_track.rb
class ClickTrack < ApplicationRecord
  belongs_to :item
end
Of course, we need some sample data. I won’t do anything fancy here, but just add two items with a bunch of click tracks that have a random creation date:
db/seeds.rb
%w(apple cherry).each do |item|
  new_item = Item.create({title: item})
  1000.times do
    new_item.click_tracks.create!({created_at: rand(3.years.ago..Time.now) })
  end
end
Load sample data into the database:
$ rails db:seed # use rake for Rails < 5
Once again, don’t forget that starting from Rails version 5 all commands live under the rails namespace:
$ rails db:migrate # use rake for Rails < 5
The Routes and the Main Page
Let’s also set up the basic routes and prepare the home page of our app. As long as the click tracks are directly related to items and do not make much sense on their own, I want the click_tracks resource to be nested:
config/routes.rb
[...]
resources :items, only: [:index] do
  resources :click_tracks, only: [:index]
end

root 'items#index'
[...]
Create two controllers:
items_controller.rb
class ItemsController < ApplicationController
  def index
    @items = Item.all
  end
end
click_tracks_controller.rb
class ClickTracksController < ApplicationController
  def index
    @item = Item.find_by(id: params[:item_id])
  end
end
They are really basic so nothing to comment here. Now the view for the root page:
views/items/index.html.erb
<h1>Items</h1>

<ul><%= render @items %></ul>
And the corresponding partial
views/items/_item.html.erb
<li>
  <%= item.title %>
  <%= link_to 'View clicks', item_click_tracks_path(item), class: 'btn btn-primary' %>
</li>
As long as we have the nested routes, we have to use the item_click_tracks_path helper, not the click_tracks_path. You may read more here about nested resources.
Lastly, let’s also wrap the whole page’s content into the div equipped with the Bootstrap’s class:
views/layouts/application.html.erb
[...]
<body>
<div class="container">
  <%= yield %>
</div>
</body>
[...]
Building the Form
Great, the first step is done and we are ready to build the main feature now. Speaking of the form, it definitely has to contain two inputs: one for the start date and another one for the end date. Having them in place, the user may choose the time period for which to to display click tracks. These inputs will be powered by Bootstrap’s styling and the Datepicker plug-in:
views/click_tracks/index.html.erb
<h1>Click tracking</h1>

<div id="event_period" class="row">
  <%= form_tag api_item_click_tracks_path(@item), remote: true do %>
    <div class="col-sm-1">
      <label for="start_date">Start date</label>
    </div>

    <div class="col-sm-3">
      <div class="input-group">
        <input type="text" class="actual_range form-control datepicker" id="start_date" name="start_date">
        <div class="input-group-addon">
          <span class="glyphicon glyphicon-th"></span>
        </div>
      </div>
    </div>

    <div class="col-sm-1 col-sm-offset-1">
      <label for="end_date">End date</label>
    </div>

    <div class="col-sm-3">
      <div class="input-group">
        <input type="text" class="actual_range form-control datepicker" id="end_date" name="end_date">
        <div class="input-group-addon">
          <span class="glyphicon glyphicon-th"></span>
        </div>
      </div>
    </div>

    <div class="col-sm-2">
      <%= submit_tag 'Show!', class: 'btn btn-primary' %>
    </div>
  <% end %>
</div>
This code is pretty long, but very simple. We add the form that should be submitted asynchronously to the api_item_click_tracks_path (this route does not exist yet). Inside the form there are two inputs with the ids of #start_date and #end_date.
To make them a bit prettier I am using the .input-group-addon class that adds a small icon next to each
input. Lastly, there is a submit button to, well, submit the form.
Now we need the routes:
config/routes.rb
[...]
namespace :api do
  resources :items, only: [] do
    resources :click_tracks, only: [:create] do
      collection do
        get 'by_day'
      end
    end
  end
end
[...]
We namespace these routes under api. The corresponding actions will be coded in the next steps.
To take advantage of the Datepicker plug-in, place the following code in your view (of course, you can also place it in a separate CoffeeScript file):
views/click_tracks/index.html.erb
[...]
<script data-turbolinks-track>
  $(document).ready(function() {
    $('#event_period').datepicker({
      inputs: $('.actual_range'),
      startDate: '-3y',
      endDate: '0d',
      todayBtn: 'linked',
      todayHighlight: 'true',
      format: 'yyyy-mm-dd'
    });
  });
</script>
[...]
We equip the whole form with this new functionality and provide the actual inputs using the inputs option. Also, the startDate is set to 3 years ago (because, as you remember, click tracks’ creation dates were defined as rand(3.years.ago..Time.now)) and the endDate to 0d meaning that it should contain today’s date. Then, display the “Today” button, highlight today’s date, and provide the date format. Great!
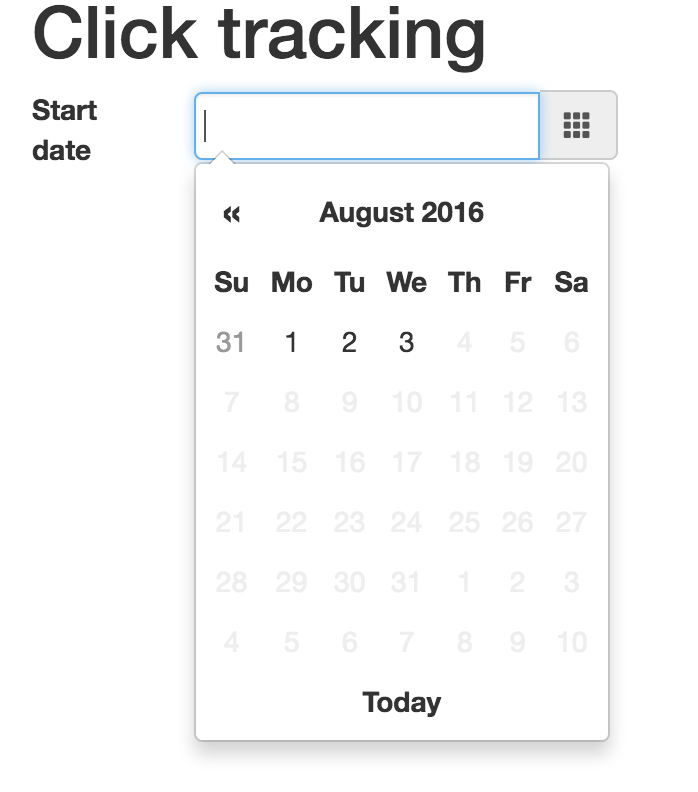
You can boot the server and observe the result now. Note that when the drop-down is open, you may click on the month or the year to select another one.
Displaying the Graph
Okay, it is high time for today’s star to emerge. Let’s display the graph in a separate partial (so we can re-use the markup later):
views/click_tracks/index.html.erb
[...]
<%= render 'graph' %>
views/click_tracks/_graph.html.erb
<div id="graph">
  <%= stat_by(@start_date, @end_date) %>
</div>
stat_by is a helper method (we are going to create it soon) that accepts start and end dates. When the page is loaded, these dates are not set, so we have to take care of such a scenario ourselves.
helpers/click_tracks_helper.rb
module ClickTracksHelper
  def stat_by(start_date, end_date)
    start_date ||= 1.month.ago
    end_date ||= Time.current
  end
end
Here we use the so-called “nil guards” (||=) to set the default values. Let’s display the chart relying on Chartkick’s asynchronous loading feature:
helpers/click_tracks_helper.rb
module ClickTracksHelper
  def stat_by(start_date, end_date)
    start_date ||= 1.month.ago
    end_date ||= Time.current
    line_chart by_day_api_item_click_tracks_path(@item, start_date: start_date, end_date: end_date),
               basic_opts('Click count', start_date, end_date)
  end
end
So, instead of loading the chart during the page load, it is done in the background which is, of course, better in terms of user experience. In order for this to work, you need to set up an action in your app that presents the properly formatted data and hook up jQuery or Zepto.js. In this case we use the by_day_api_item_click_tracks_path that was already set up but the action is not coded – it will be in the next step.
The basic_opts method, as the name implies, prepares some options (including the library-specific ones) for the graph:
helpers/click_tracks_helper.rb
private

def basic_opts(title, start_date, end_date)
  {
    discrete: true,
    library: {
      title: {text: title, x: -20},
      subtitle: {text: "from #{l(start_date, format: :medium)} to #{l(end_date, format: :medium)}", x: -20},
      yAxis: {
        title: {
          text: 'Count'
        }
      },
      tooltip: {
        valueSuffix: 'click(s)'
      },
      credits: {
        enabled: false
      }
    }
  }
end
The l method is an alias for the localize that formats the timestamp. There is no format called :medium by default so let’s add one:
config/locales/en.yml
en:
  time:
    formats:
       medium: '%d %B %Y'
Once again, notice that when using the other graph adapters, options will be differnt. Refer to your adapter’s docs for more details.
Controller Actions
The front end is ready and now it’s time to take care of the back end. As long as we’ve namespaced our routes under api, the new controller files has to be placed inside the api folder:
controllers/api/click_tracks_controller.rb
class Api::ClickTracksController < Api::BaseController
end
Note, however, that Api::ClickTracksController inherits from Api::BaseController, as will all Api::* controllers. For example, in my production app I have two somewhat similar controllers that share these methods.
controllers/api/base_controller.rb
class Api::BaseController < ApplicationController
end
What do we want to happen inside the Api::BaseController? It is going to host two callbacks: one to load the necessary data (the item and its click tracks) and another one to format the received dates (because the user may enter them by hand or not provide any date at all.)
Data loading is not a problem for us:
controllers/api/base_controller.rb
[...]
before_action :load_data

private

def load_data
  @item = Item.includes(:click_tracks).find_by(id: params[:item_id])
  @click_tracks = @item.click_tracks
end
[...]
As for formatting the dates, the method is going to be a bit more complex:
controllers/api/base_controller.rb
[...]
before_action :load_data
before_action :format_dates

private

def format_dates
  @start_date = params[:start_date].nil? || params[:start_date].empty? ?
      1.month.ago.midnight :
      params[:start_date].to_datetime.midnight
  @end_date = params[:end_date].nil? || params[:end_date].empty? ?
      Time.current.at_end_of_day :
      params[:end_date].to_datetime.at_end_of_day
  @start_date, @end_date = @end_date, @start_date if @end_date < @start_date
end

[...]
If one of the dates is empty, we populate is with a default value. Note the usage of the pretty self-explantory midnight and at_end_of_day methods. If the date is not empty, convert it to datetime (because initially it is a string). Lastly, we swap the date if the end date comes after the start date.
Now code the create action that fires when we submit the form. Of course, it responds with Javascript as the form submission is done via AJAX:
controllers/api/click_tracks_controller.rb
[...]
def create
  respond_to do |format|
    format.js
  end
end
[...]
The actual Javascript is simple: just replace the old chart with a new one. That’s where the partial created earlier comes in handy:
views/api/click_tracks/create.js.erb
$('#graph').replaceWith('<%= j render 'click_tracks/graph' %>');
The last step is to code an action that prepares data for our graph. As you recall, we have the following routes:
config/routes.rb
[...]
namespace :api do
  resources :items, only: [] do
    resources :click_tracks, only: [:create] do
      collection do
        get 'by_day'
      end
    end
  end
end
[...]
Therefore, the action should be called by_day. We want it to render JSON containing information about how many clicks happened on each day.
controllers/api/click_tracks_controller.rb
[...]
def by_day
  clicks = @click_tracks.group_by_day('created_at', format: '%d %b', range: @start_date..@end_date).count
  render json: [{name: 'Click count', data: clicks}].chart_json
end
[...]
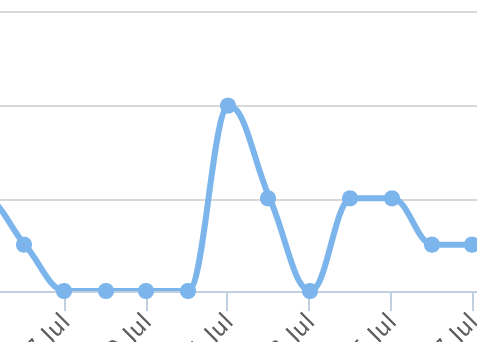
group_by_day is a method introduced by the groupdate gem that groups click tracks by creation date. The count method, as you’ve probably guessed, counts how many clicks happened on each day. As a result, the click variable is going to contain an object like {'07 Jun': 10, '08 Jun': 4} (the keys’ formatting is controlled by the :format option). chart_json is a special Chartkick method to prepare the JSON to be visualized.
Suppose, however, that a user chooses 2 years as the time range: with the current method’s implementation we are going to display more than 700 days in one graph which is not really helpful. Instead, let’s check the range and do dynamic grouping based on it.
First of all, add two more methods to the BaseController:
controllers/api/base_controller.rb
[...]
private

def by_year?
  @end_date - (1.year + 2.days) > @start_date
end

def by_month?
  @end_date - (3.month + 2.days) > @start_date
end
[...]
These methods simply check the length of the selected period – we’ll use them now in the by_day method:
controllers/api/click_tracks_controller.rb
[...]
def by_day
  opts = ['created_at', {range: @start_date..@end_date, format: '%d %b'}]
  method_name = :group_by_day
  if by_year?
    opts[1].merge!({format: '%Y'})
    method_name = :group_by_year
  elsif by_month?
    opts[1].merge!({format: '%b %Y'})
    method_name = :group_by_month
  end
  clicks = @click_tracks.send(method_name, *opts).count
  render json: [{name: 'Click count', data: clicks}].chart_json
end
[...]
Here we prepare an array of the arguments that will be passed to one of the groupdate methods (group_by_day,
group_by_month or group_by_year). Next, set the default method to call and do some checks. If the range is greater than a month, update the formatting options so that only a year or a month and a year are being displayed, then dynamically call the method. *opts will take an array and convert it to the list of arguments. With this code in place, you can easily define your own conditions and grouping rules.
Now the job is done and you may observe the final result!
Conclusion
In this article we continued the discussion of Chartkick and Groupdate and used them in practice. To make the user experience a bit more pleasant, we’ve also utilized Bootstrap’s Datepicker plug-in. The code listed here can be further extended. For example, if you wish to visualize the display count for each item, that’s easy to do as well.
If you have any other questions left, don’t hesitate to contact me – I’m really glad when you send your feedback. As always, thanks for staying with me and see you soon!
Frequently Asked Questions (FAQs) about Chartkick in Rails
How Can I Customize the Colors in My Chartkick Chart?
Chartkick allows you to customize the colors of your charts to match your application’s theme. You can do this by passing an array of colors in hexadecimal format to the ‘colors’ option in your chart method. For example, you can use the following code to create a pie chart with custom colors:pie_chart data, colors: ["#b00", "#666"]
In this example, ‘#b00’ and ‘#666’ are the hexadecimal codes for the colors you want to use. You can replace these with any color codes you prefer.
Can I Use Chartkick with Other Charting Libraries?
Yes, Chartkick is compatible with several popular charting libraries, including Google Charts and Highcharts. You can specify the library you want to use by setting the ‘adapter’ option in your Chartkick initializer. For example, to use Highcharts, you would use the following code:Chartkick.options = {
adapter: "highcharts"}
You can replace ‘highcharts’ with ‘google’ to use Google Charts instead.
How Can I Add Interactivity to My Chartkick Charts?
Chartkick supports several options for adding interactivity to your charts. For example, you can use the ‘click’ event to trigger a function when a user clicks on a data point in your chart. Here’s an example of how you can use this feature:column_chart data, library: {
events: {
click: ->(event) { alert("You clicked on #{event.point.category}") }
}}
In this example, the ‘click’ event triggers a function that displays an alert with the category of the clicked data point.
Can I Use Chartkick to Create Real-Time Charts?
Yes, Chartkick supports real-time charts through the ‘refresh’ option. You can use this option to specify the interval at which your chart should update its data. For example, to create a line chart that updates every 5 seconds, you would use the following code:line_chart data_path, refresh: 5
In this example, ‘data_path’ is the URL of the endpoint that provides your chart’s data.
How Can I Group Data in My Chartkick Charts?
Chartkick provides several methods for grouping data in your charts. For example, you can use the ‘group_by_day’ method to group data by day. Here’s an example of how you can use this feature:line_chart User.group_by_day(:created_at).count
In this example, the ‘group_by_day’ method groups the users by the day they were created, and the ‘count’ method counts the number of users for each day.
Can I Use Chartkick to Create Multi-Series Charts?
Yes, Chartkick supports multi-series charts. You can create a multi-series chart by passing an array of data series to your chart method. Each series should be a hash with a ‘name’ key and a ‘data’ key. Here’s an example:line_chart [
{name: "Series A", data: series_a_data},
{name: "Series B", data: series_b_data}]
In this example, ‘series_a_data’ and ‘series_b_data’ are the data for your two series.
How Can I Customize the Tooltip in My Chartkick Chart?
Chartkick allows you to customize the tooltip that appears when a user hovers over a data point in your chart. You can do this by setting the ‘tooltip’ option in your chart method. For example, you can use the following code to customize the tooltip:line_chart data, library: {
tooltip: {
headerFormat: '<b>{series.name}</b><br>',
pointFormat: '{point.y} on {point.x}'
}}
In this example, the ‘headerFormat’ and ‘pointFormat’ options specify the format of the tooltip’s header and point, respectively.
Can I Use Chartkick to Create Stacked Bar Charts?
Yes, Chartkick supports stacked bar charts. You can create a stacked bar chart by setting the ‘stacked’ option to true in your chart method. Here’s an example:bar_chart data, stacked: true
In this example, the ‘stacked’ option causes the bars in the chart to be stacked on top of each other.
How Can I Add a Title to My Chartkick Chart?
Chartkick allows you to add a title to your chart by setting the ‘title’ option in your chart method. For example, you can use the following code to add a title to your chart:line_chart data, title: "My Chart Title"
In this example, “My Chart Title” is the title of your chart. You can replace this with any title you prefer.
Can I Use Chartkick to Create Donut Charts?
Yes, Chartkick supports donut charts. You can create a donut chart by setting the ‘donut’ option to true in your pie chart method. Here’s an example:pie_chart data, donut: true
In this example, the ‘donut’ option causes the pie chart to be displayed as a donut chart.