

AppSignal is an easy-to-use APM for your Ruby, Elixir, Node.js, frontend JavaScript, and Python projects. In this article, we’ll show you how you can use AppSignal to power up your Python app with our latest coding endeavor, Nesstr, the dating app for snakes.
AppSignal helps thousands of developers, from novice to expert, better understand how and why their app is performing the way it is. In short: AppSignal ingests all of your app’s complex performance data and translates it into easy-to-understand, actionable insights.
We created this article in partnership with AppSignal. Thank you for supporting the partners who make SitePoint possible.
What Is an APM, and How Can It Help You?
Application performance monitoring (APM) tools help transform your app’s monitoring data — known as metrics — into practical insights that help you enhance your app’s performance.
AppSignal offers tools that detect exceptions, performance problems, and anomalies such as high response times and slow background job queues.
In other words, if you imagine an app is a car, AppSignal is a diagnostics tool. We give you glanceable insights into the performance and health of your app, helping you know when to take action before any warning lights start flashing.
Squashing Bugs with AppSignal
Sometimes, despite manual and automated testing, bugs slip through to production. When this happens, it can be quite frustrating and time-consuming to pinpoint the root cause of an issue.
Let’s imagine a scenario where users of Nesstr report not receiving notifications when someone likes their profile. The seemingly simple action of “liking” a profile involves multiple components. Apps make it challenging to determine where the root of the issue might reside. For example, is it in a React component, an API function, or a Celery background task?
This is where AppSignal can help us, by eliminating guesswork and identifying where an exception occurs within our app. In the case of Nesstr, we’ve configured AppSignal to notify us via Slack whenever an issue arises in our app.
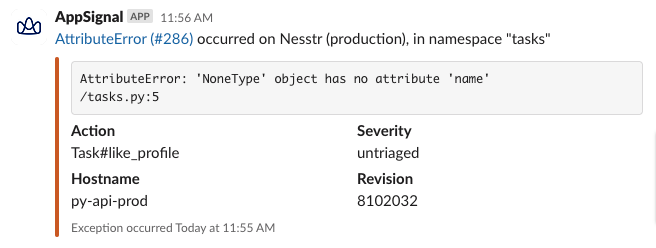
Once we’ve been alerted to this exception, we can delve deeper into AppSignal for a more comprehensive understanding of the incident. AppSignal provides us with a detailed context for each recorded exception occurrence.
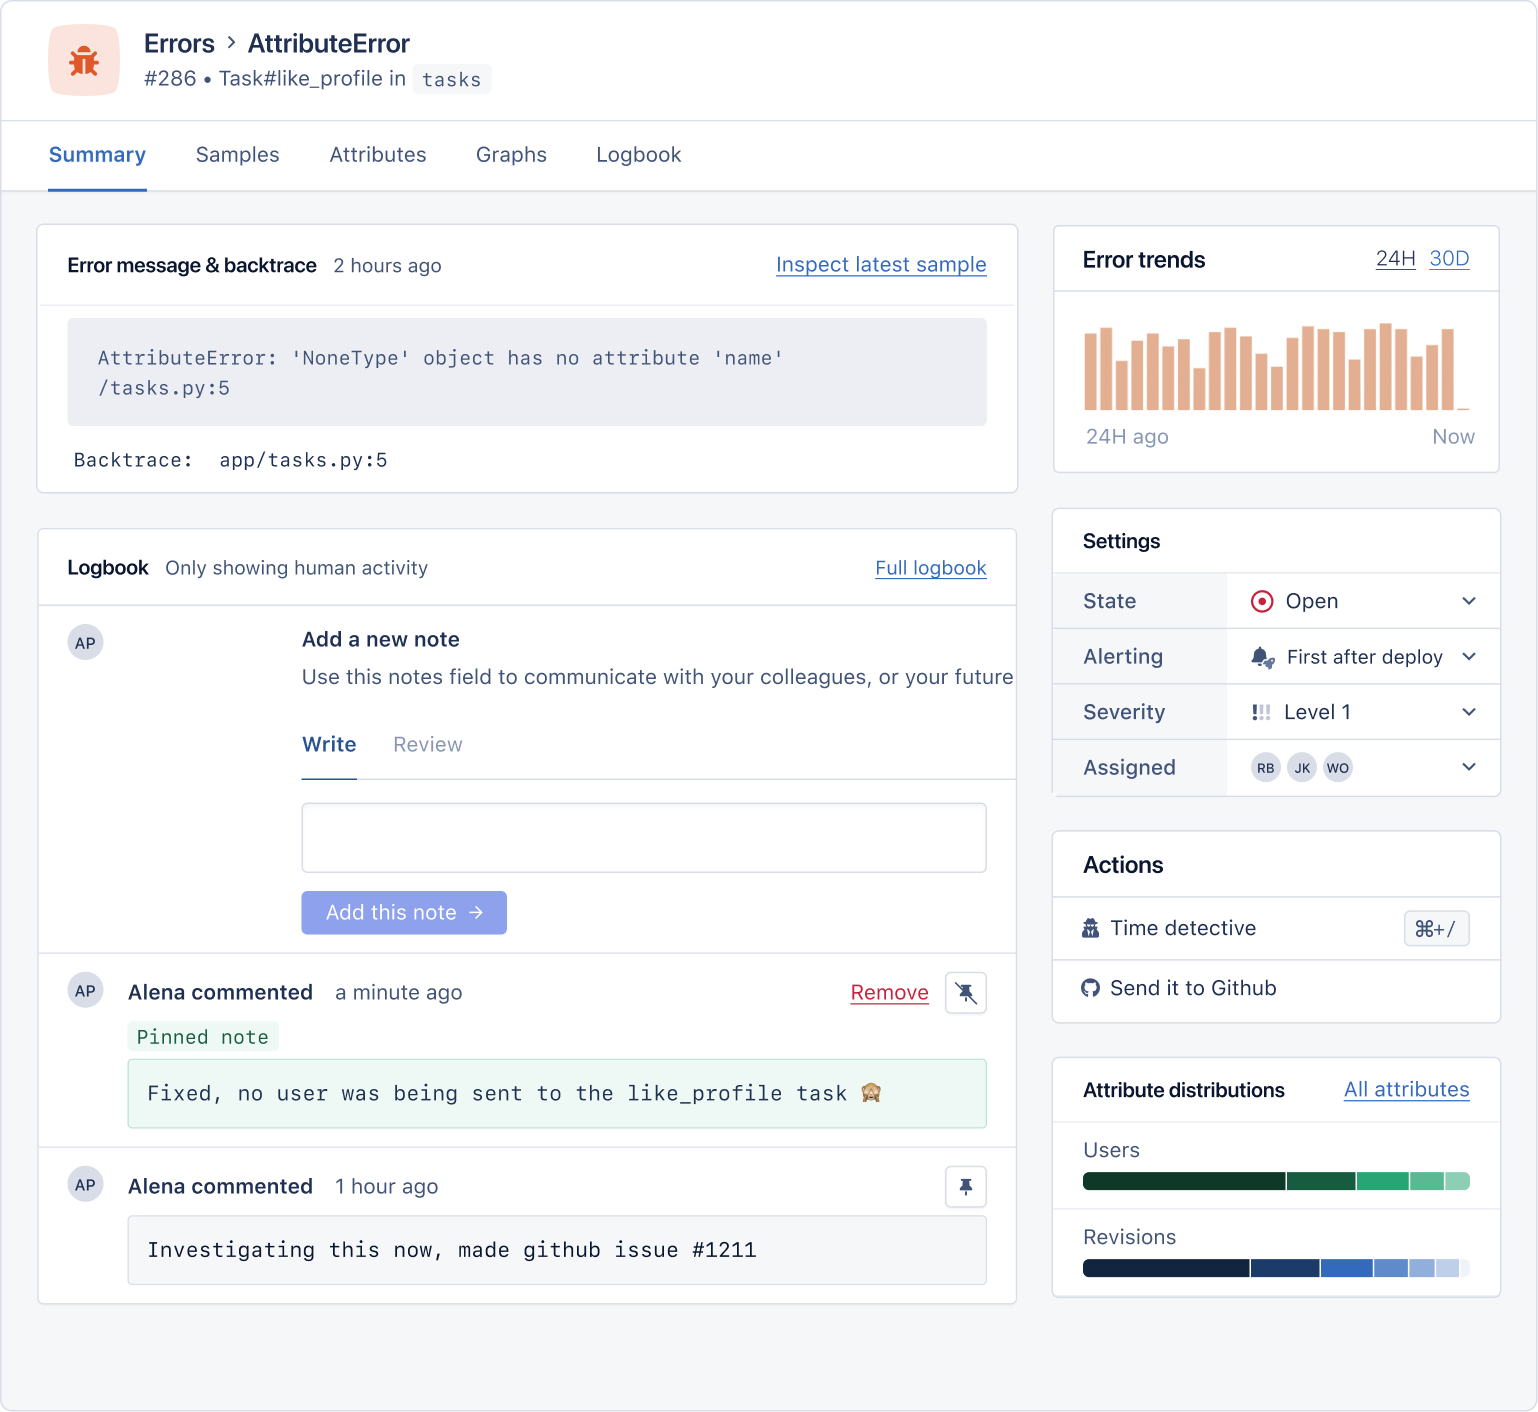
Thanks to the detailed exception data provided by AppSignal, we can quickly identify the root cause of the issue in our code. Looking at the error message logged in AppSignal, we can tell that our app is trying to retrieve the name attribute from a noneType object in the send_like_notification Celery task:
@app.task
def like_profile(profile, user):
    profile.add_like_from(user)

user = User.get(user_id) # This is returning none because our user_id is nil.
profile = Profile.get(profile_id)
like_profile(post, user)
Instead of manually reproducing the entire flow of likes to find this error, we can immediately resolve it by ensuring the noneType object is defined. Nice!
Monitoring Performance with AppSignal
Having fixed our “like” notifier, AppSignal has noticed our fetch_matches endpoint is responding slowly. Thanks to AppSignal’s insights, we don’t need to wait for a user to complain to us, nor do we have to go through the trouble of downloading a sanitized database clone to try and reproduce the issue locally. We can review the Event timeline of the fetch_profiles performance samples that AppSignal has recorded.
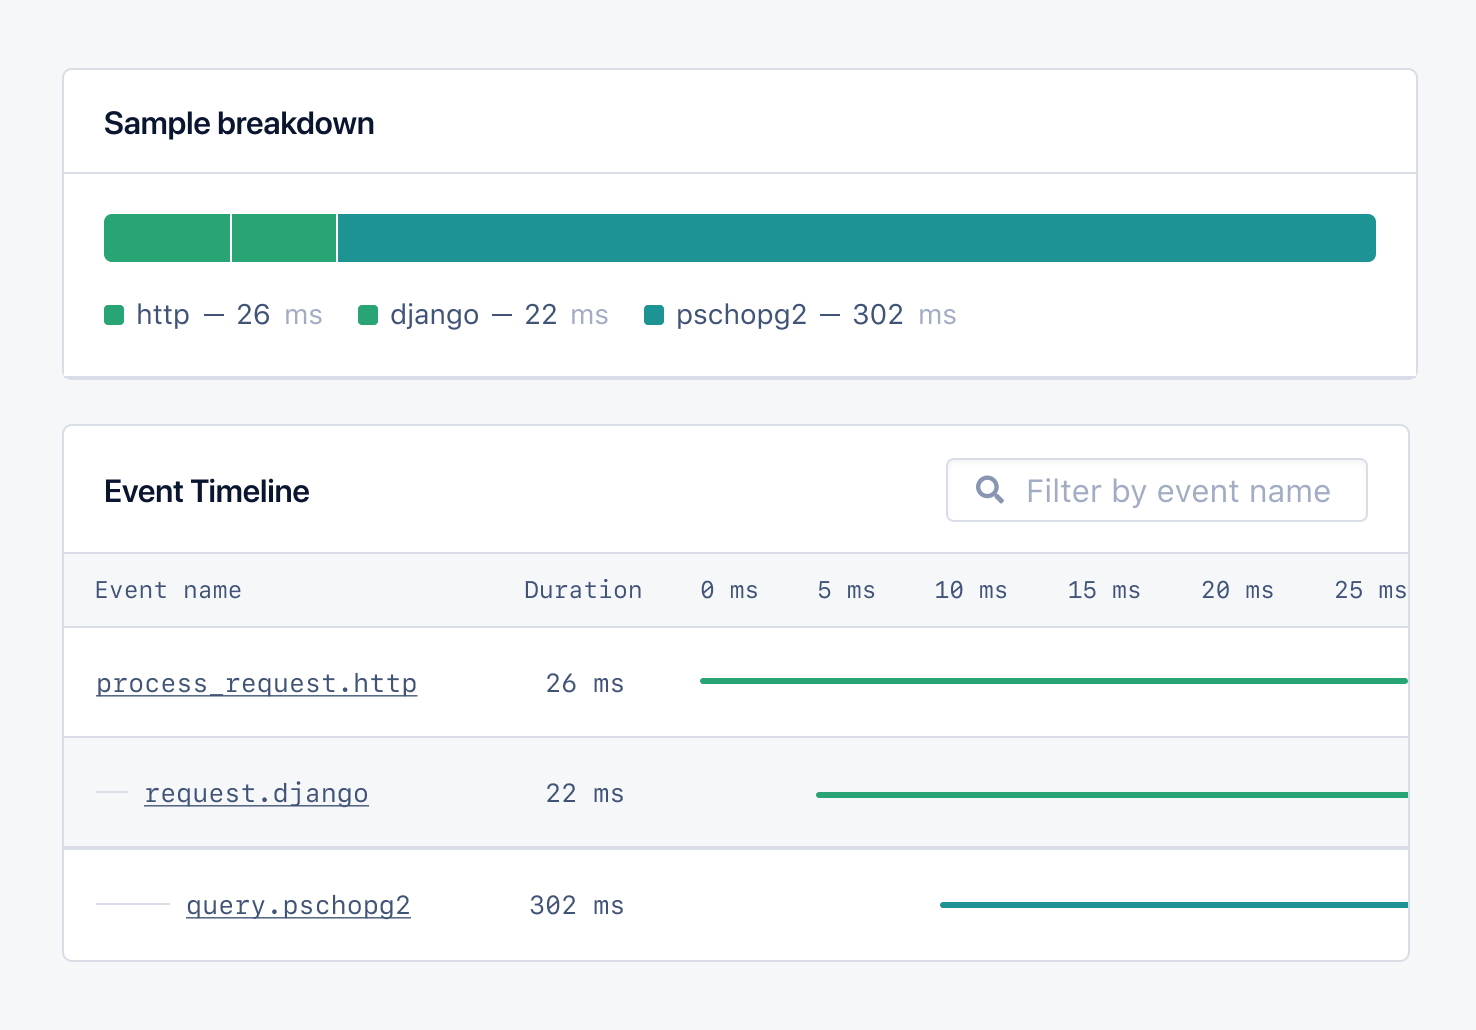
Here, we can easily see that psycopg2 is lagging when the request_match endpoint is requested, slowing down our app.
AppSignal has not only cut out all the guesswork from figuring out why the endpoint is slow, but it’s helped us proactively identify a potential future bottleneck. We can now amend our endpoint and scale confidently.
Being Alerted of Anomalies with AppSignal
Now that we’ve used AppSignal to tackle some more glaring issues in our app, we can utilize AppSignal to help us take a more proactive approach to development and anticipate issues even before they surface.
At AppSignal, we call this anomaly detection. This feature is a game changer. We can use it to flag errors and spot sluggish performance before it impacts end users or our app’s availability.
With Anomaly detection, we can create triggers that notify us when a desired metric meets a specific threshold — such as when our error rate exceeds 5%, or an endpoint takes more than 200ms to respond.
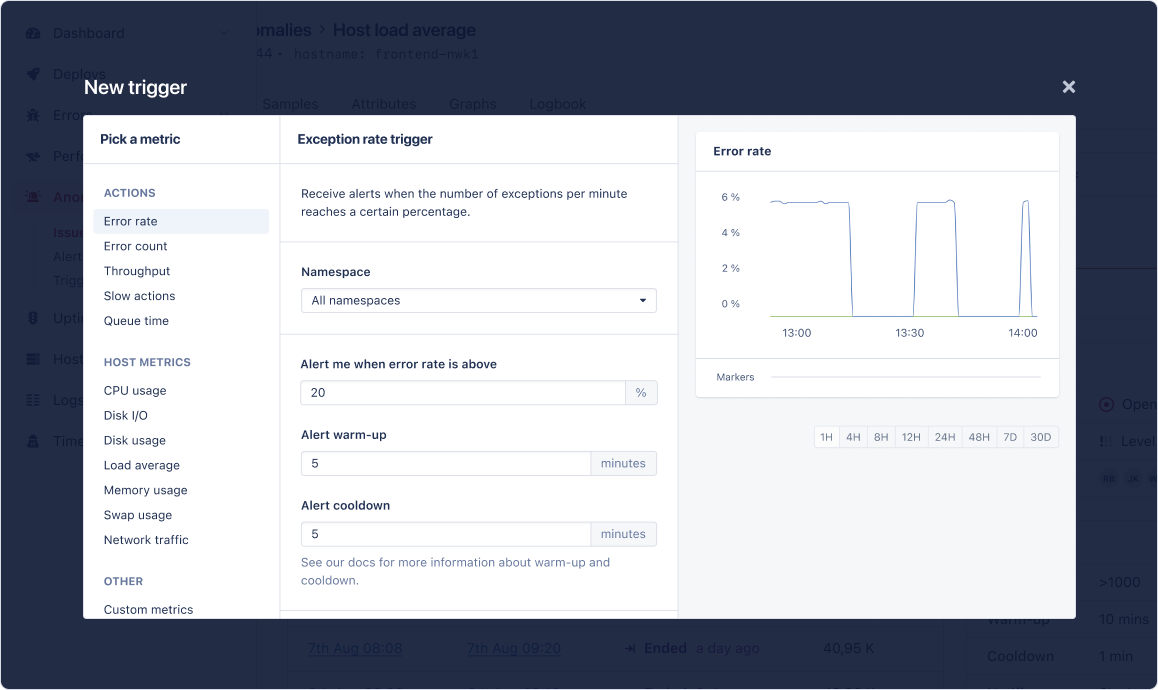
The great thing about anomaly detection is that we can configure it in a way that makes sense for your app and be notified in a way that makes sense for your organization. With AppSignal, you can integrate with many popular third-party collaboration tools like Discord and Slack, meaning AppSignal integrates into your flow rather than forcing you to change how you usually work.
Keeping Your Monitoring Observable with AppSignal
AppSignal’s dashboards give you instant visual insights into your app’s metrics, allowing you to track and trace performance metrics quickly.
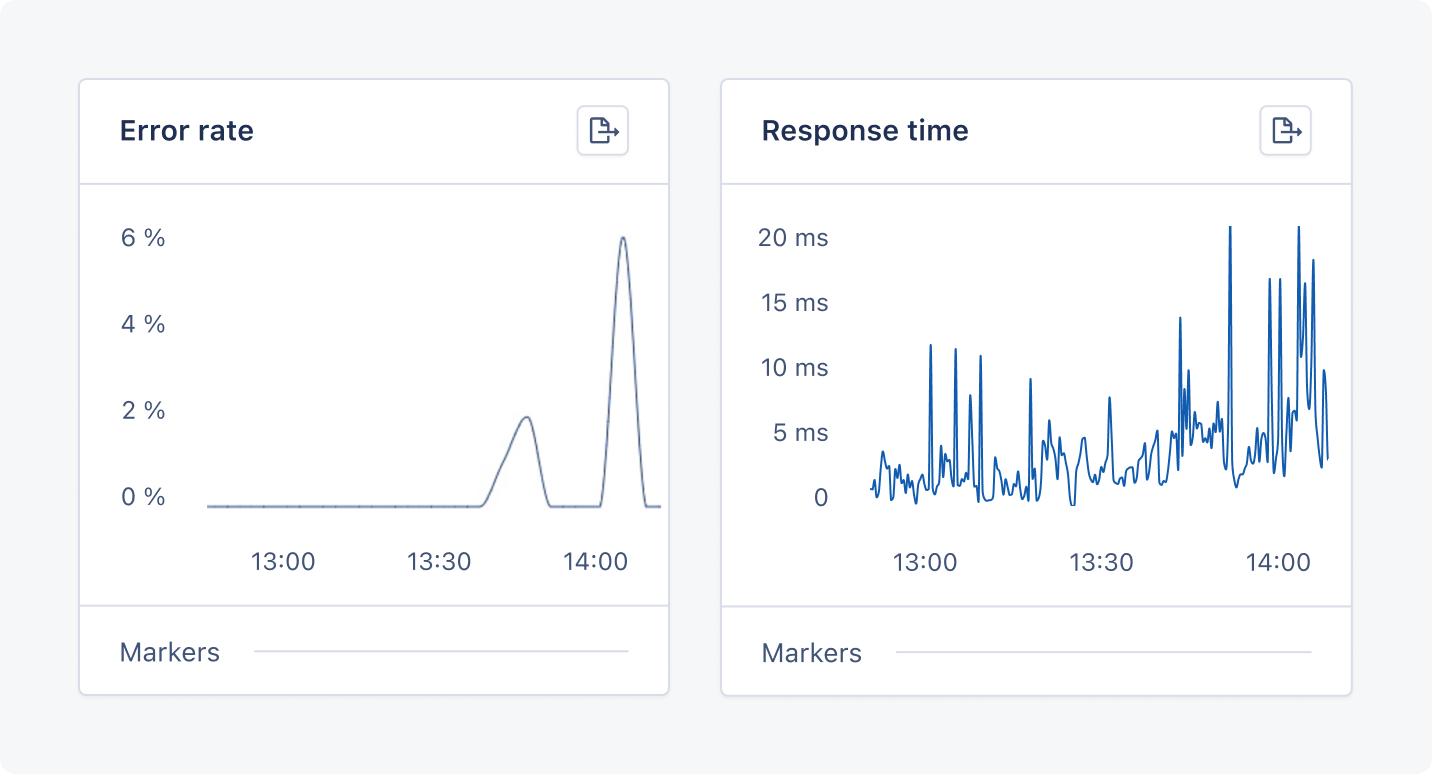
If you see something you want to investigate further, such as a rapidly increasing error rate, click on that point on the chart, and you’ll view the state of your app at that specific point in time.
You can add custom markers to help you and your team better understand how your app performs, and with full-screen support, you can monitor your metrics anywhere you can install a screen.
Managing Your Logs with AppSignal
Sometimes, logs give us great insights into why our app is performing unexpectedly. With AppSignal, you don’t need to SSH into servers and trail your logs. AppSignal can ingest your app’s logs, giving you a live view, and you can filter, query, and share with teammates.
So, you can go from viewing an error incident in AppSignal to viewing logs at the time of the occurrence in seconds.
What’s great about AppSignal logging is that no matter where you are in the AppSignal app, with our amazing Time Detective feature, you’re never more than a few clicks from your logs.
When investigating an error or performance incident, you can use Time Detective to gain a helicopter view of your app performance when the issue occurred and delve deeper into your logs for more in-depth debugging.
Getting Started with AppSignal
You can have your Python app push metrics to AppSignal in less time than it takes to drink a coffee.
Sign up for an AppSignal account and follow our installation wizard instructions. The installation wizard will walk you through all the steps needed to send metrics from your Python app to AppSignal!
Our Python documentation will also take you through all the steps required to get the metrics you need, including how you can install AppSignal manually.