


This article was originally published by Ampere Computing.
You are running your application on a new cloud instance or a server (or SUT, a system under test) and you notice there is a performance issue. Or you would like to ensure you are getting the best performance, given the system resources at your disposal. This document discusses some basic questions you should ask and ways to answer those questions.
Prerequisites: Know Your VM or Server
Before you start troubleshooting or embarking on a performance analysis exercise, you need to be aware of the system resources at your disposal. System-level performance typically boils down to four components and how they interact with each other — CPU, Memory, Network, Disk. Also refer to Brendan Gregg’s excellent article Linux Performance Analysis in 60,000 milliseconds for a great start to quickly evaluate performance issues.
This article explains how to dig deeper to understand performance issues.
Determine CPU Type
Run the $lscpu command, and it will display the CPU type, CPU Frequency, Number of cores and other CPU relevant information:
ampere@colo1:~$ lscpu

Architecture:                    aarch64

CPU op-mode(s):                  32-bit, 64-bit

Byte Order:                      Little Endian

CPU(s):                          160

On-line CPU(s) list:             0-159

Thread(s) per core:              1

Core(s) per socket:              80

Socket(s):                       2

NUMA node(s):                    2

Vendor ID:                       ARM

Model:                           1

Model name:                      Neoverse-N1

Stepping:                        r3p1

CPU max MHz:                     3000.0000

CPU min MHz:                     1000.0000

BogoMIPS:                        50.00

L1d cache:                       10 MiB

L1i cache:                       10 MiB

L2 cache:                        160 MiB

NUMA node0 CPU(s):               0-79

NUMA node1 CPU(s):               80-159

Vulnerability Itlb multibit:     Not affected

Vulnerability L1tf:              Not affected

Vulnerability Mds:               Not affected

Vulnerability Meltdown:          Not affected

Vulnerability Mmio stale data:   Not affected

Vulnerability Spec store bypass: Mitigation; Speculative Store Bypass disabled via prctl

Vulnerability Spectre v1:        Mitigation; __user pointer sanitization

Vulnerability Spectre v2:        Mitigation; CSV2, BHB

Vulnerability Srbds:             Not affected

Vulnerability Tsx async abort:   Not affected

Flags:                           fp asimd evtstrm aes pmull sha1 sha2 crc32 atomics fphp asimdhp cpuid

                                  asimdrdm lrcpc dcpop asimddp ssbs
Determine Memory Configuration
Run the $free command, and it will provide you information about the total amount of physical and swap memory (including the breakdown of memory utilization). Run the Multichase benchmark to determine the latency, memory bandwidth and load-latency of the instance/SUT:
ampere@colo1:~$ free

              total        used        free      shared  buff/cache   available

Mem:      130256992     3422844   120742736        4208     6091412   125852984

Swap:       8388604           0     8388604
Assess Network Capability
Run the $ethtool command, and it will provide you information about the hardware settings of the NIC card. It also is used to control network device driver and hardware settings. In case you are running the workload in the client-server model, it is a good idea to know the Bandwidth and Latency between the client and the server. For determining the Bandwidth, a simple iperf3 test would be sufficient, and for latency a simple ping test would be able to give you that value. In the client-server setup it’s also advisable to keep the number of network hops to a minimum. A traceroute is a network diagnostic command for displaying the route and measuring transit delays of packets across the network:
ampere@colo1:~$ ethtool -i enp1s0np0

driver: mlx5_core

version: 5.7-1.0.2

firmware-version: 16.32.1010 (RCP0000000001)

expansion-rom-version:

bus-info: 0000:01:00.0

supports-statistics: yes

supports-test: yes

supports-eeprom-access: no

supports-register-dump: no

supports-priv-flags: yes>
Understand Storage Infrastructure
It is essential to know the disk capabilities before you start running the workloads. Knowing the throughput and latency of your disk and the filesystems will help you plan and architect the workload effectively. Flexible I/O (or “fio”) is the tool of choice to determine these values.
Now On to the Top 10 Questions
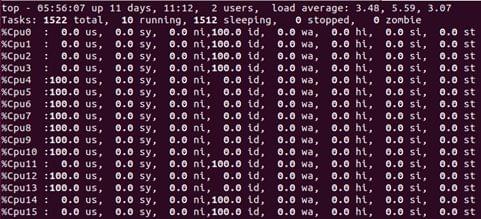
1. Are my CPUs being used well?
One of the primary components of the Total Cost of Ownership is the CPU. It is therefore worth finding out how efficiently CPUs are being used. Idle CPUs typically mean there are external dependencies, like waiting on disk or network accesses. It is always a good idea to monitor CPU utilization and to check if core usage is uniform.
A sample output from command $top -1 is pictured below.
2. Are my CPUs running at the highest frequencies possible?
Modern CPUs use p-states to scale the frequency and voltage at which they run to reduce the power consumption of the CPU when higher frequencies are not needed. This is called Dynamic Voltage and Frequency Scaling (DVFS) and is managed by the OS. In Linux, p-states are managed by the CPUFreq subsystem, which use different algorithms (called governors) to determine which frequency the CPU is to be run at. In general, for performance-sensitive applications, it is a good idea to ensure that the performance governor is used, and the following command uses the cpupower utility to achieve that. Keep in mind that the frequency utilization at which a CPU should run is workload dependent:
cpupower frequency-set –governor performance
To check the frequency of the CPU while running your application, run the following command:
ampere@colo1:~$ cpupower frequency-info

analyzing CPU 0:

  driver: cppc_cpufreq

  CPUs which run at the same hardware frequency: 0

  CPUs which need to have their frequency coordinated by software: 0

  maximum transition latency: Cannot determine or is not supported.

  hardware limits: 1000 MHz - 3.00 GHz

  available cpufreq governors: conservative ondemand userspace powersave performance schedutil

  current policy: frequency should be within 1000 MHz and 3.00 GHz.

                  The governor "ondemand" may decide which speed to use

                  within this range.

  current CPU frequency: Unable to call hardware

  current CPU frequency: 1000 MHz (asserted by call to kernel)

ampere@colo1:~$
3. How much time am I spending in my application versus kernel time?
It is sometimes necessary to find out what percentage of the CPU’s time is consumed in user space versus privileged time (i.e., kernel space). High kernel time might be justified for a certain class of workloads (network-bound workloads, for example) but can also be an indication of a problem.
The Linux application top can be used to find out the user vs. kernel time consumption as shown below.
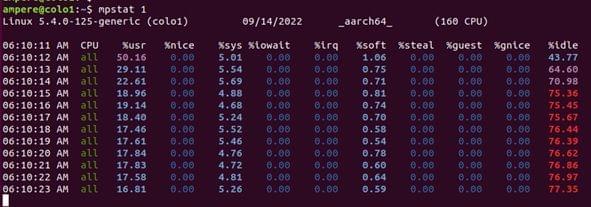
Mpstat— examine statistics per CPU and check for individual hot/busy CPUs. This is a multiprocessor statics tool, and can report statistics per CPU (-P option)
- CPU: Logical CPU ID, or all for summary
- %usr: User Time, excluding %nice
- %nice: User Time for processes with a niced priority
- %sys: System Time
- %iowait: IO wait
- %irq : Hardware interrupt CPU usage
- %soft: Software interrupt CPU usage
- %steal: Time spent servicing other tenants
- %guest: CPU time spent in guest Virtual Machines
- %gnice: CPU time to run a niced guest
- %idle: Idle
To identify CPU usage per CPU and show the user-time/kernel time ratio %usr, %sys, and %idle are the key values. These key values can also help identify “hot” CPUs which can be caused by single threaded applications or interrupt mapping.
4. Do I have enough memory for my application?
When you are managing a server, you might have to install a new application, or you might notice that the application has started to slow down. For managing your system resources and understanding your installed system memory and memory utilization by the system the $free command is a valuable tool. $vmstat is also a valuable tool to monitor memory utilization and if you are actively swapping your memory with your virtual memory.
-
Free. The Linuxfreecommand shows memory and swap statistics.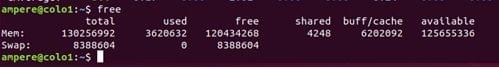
The output shows the total, used and free memory of the system. An important column is the available value, which shows available memory to an application with the need of swap. It also accounts for the memory which cannot be reclaimed immediately
-
Vmstat. This command provides a high-level view of system memory, health, including currently free memory and paging statistics.The
$vmstatcommand shows active Memory being swapped out (paging).
The commands print the summary of the current status. The columns are in kilobytes by default and are:
- Swpd: Amount of swapped out memory
- Free: Free available memory
- Buff: Memory in the buffer cache
- Cache: Memory in the page cache
- Si: Memory swapped in (paging)
- So: Memory swapped out (paging)
If the si and the so are non-zero, the system is under memory pressure and is swapping memory to the swap device.
5. Am I getting the appropriate amount of memory bandwidth?
To understand the appropriate amount of memory bandwidth, first get the “Max Memory Bandwidth” value of your system. The “Max Memory Bandwidth” value can be found by:
- Base DRAM clock Frequency
- Number of Data Transfers per clock: two, in case of “double data rate” (DDR*) memory
- Memory bus (interface) width: for Example, DDR 3 is 64 bits wide (also referred to as line)
- Number of interfaces: modern personal computers typically use two memory interfaces (dual-channel mode) for an effective 128-bit bus width
- Max Memory Bandwidth = Base DRAM clock Frequency * Number of Data Transfers per clock * Memory base width * Number of interfaces
This value represents the theoretical maximum bandwidth of the system, also known as the “burst rate”. You can now run benchmarks like Multichase, or Bandwidth against the system and verify the values.
Note: it has been seen that the burst rates may not be sustainable, and the values achieved might be a bit less than calculated.
6. Is my workload using all my CPUs in a balanced manner?
When running workloads on your server, as part of performance tuning or troubleshooting, you may want to know on which CPU core a particular process is currently scheduled and collect performance statistics of the process running on that CPU core. The first step would be to find the process running on the CPU core. This can be done using the htop. The CPU value does not reflect on the default display of htop. To get the CPU core value, launch $htop from the command line, press the F2 key, go to the “Columns”, and add “Processor” under the “Available Columns”. The currently used “CPU ID” of each process will appear under the “CPU” column.
-
How to configure
$htopto show CPU/core: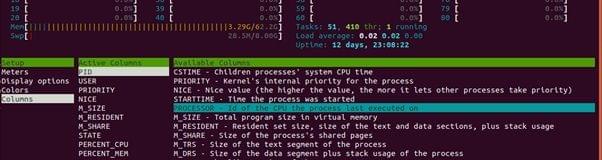
-
$htopcommand showing core 4-6 maxed out (htop core count start from “1” instead of “0”):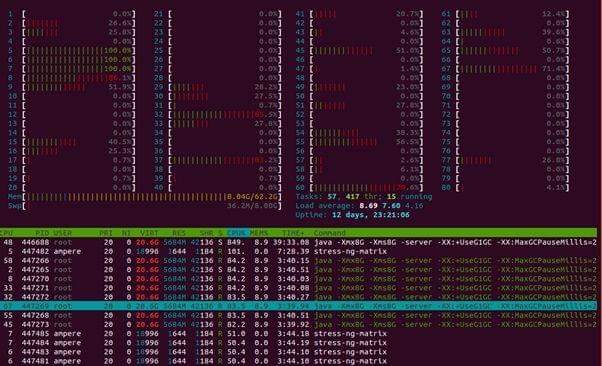
-
$mpstatcommand for selected cores to examine statistics: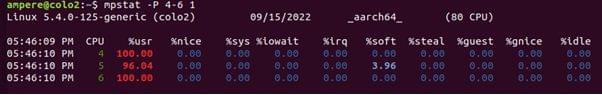
Once you have identified the CPU core, you can run the $mpstat command to examine statistics per CPU and check for individual hot/busy CPUs. This is a multiprocessor statics tool and can report statistics per CPU (or core). For more information on $mpstat see the “How much time am I spending in my application versus kernel time?” section above.
7. Is my network a bottleneck for my application?
Network bottlenecking can happen even before you saturate other resources on the server. This issue is found when a workload is being run in a client-server model. The first thing you need to do is determine how your network looks. The latency and bandwidth between the client and the server is especially important. Tools like iperf3, ping and traceroute are simple tools which can help you determine the limits of your network. Once you have determined the limits if your network, tools like $dstat and $nicstat help you monitor the network utilization and determine any bottlenecking happening with your system due to networking.
-
Dstat. This command is used to monitor the system resources, including CPU stats, Disk stats, Network stats, paging stats, and system stats. For monitoring the network utilization use the-noption.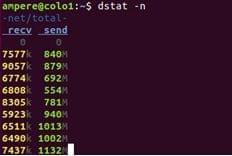
The command will give the throughput for packets received and sent by the system.
-
Nicstat. This command prints network interface statistics, including throughput and utilization.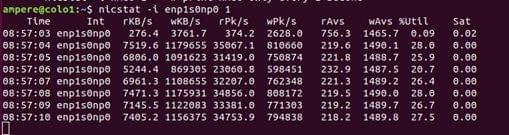
The columns include:
- Int: interface name
- %util: the maximum utilization
- Sat: value reflecting interface saturation statistics
- Values prefix “r” = read /receive
- Values prefix “w” = write/transmit
- 1- KB/s: KiloByes per second
- 2- Pk/s: packets per second
- 3- Avs/s: Average packet size in bytes
8. Is my disk a bottleneck?
Like Network, disk can also be the reason for a low performing application. When it comes to measuring disk performance, we look at the following indicators:
- Utilization
- Saturation
- IOPS (Input/Output Per Second)
- Throughput
- Response time
A good rule is that when you are selecting a server/instance for an application, you must first perform a benchmark test on the I/O performance of the disk so that you can get the peak value or “ceiling” of the disk performance and also be able to determine of the disk performance meets the needs of the application. Flexible I/O is the tool of choice to determine these values.
Once the application is running, you can use $iostat and $dstat to monitor the disk resource utilization in real time.
The iostat command shows the per-disk I/O statistics, proving metrics for workload characterization, utilization, and saturation.
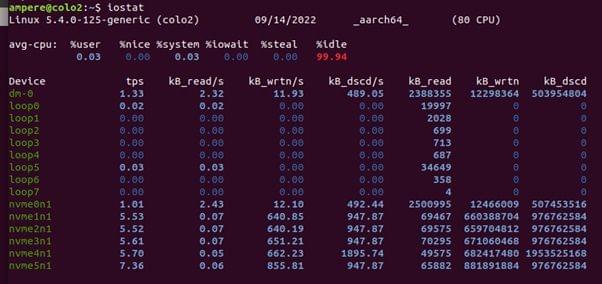
The first output line shows the summary of the system, including the kernel version, host name, data architecture and CPU count. The second line shows the summary of the system since boot time for the CPUs.
For each disk device shown in the subsequent rows, it shows the basic details in the columns:
- Tps: Transactions per second
- kB_read/s: Kilobytes read per second
- kB_wrtn/s: Kilobytes written per second
- kB_read: Total Kilobytes read
- KB_write: Total Kilobytes written
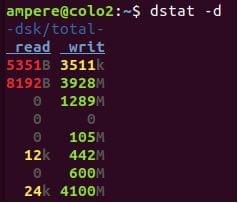
The dstat command is used to monitor the system resources, including CPU stats, Disk stats, Network stats, paging stats, and system stats. For monitoring the disk utilization use the -d option. The option will show the total number of read (read) and write (writ) operations on disks.
The image below demonstrates a write intensive workload.
9. Am I paying a NUMA penalty?
Non-uniform memory access (NUMA) is a computer memory design used in multiprocessing, where the memory access time depends on the memory location relative to the processor. Under NUMA, a processor can access its own local memory faster than non-local memory (memory local to another processor or memory shared between processors). The benefits of NUMA are limited to workloads, notably on servers where the data is often associated strongly with certain tasks or users.
On a NUMA system, the greater the distance between the processor and its memory bank, the slower the processor access to that memory bank is. For Performance-sensitive application the system OS should allocate memory from the closet possible memory bank. To monitor in real time the memory allocation of the system or a process, $numastat is a great tool to use.
The numastat command provides statistics for non-uniform memory access (NUMA) systems. These systems are typically systems with multiple CPU sockets.
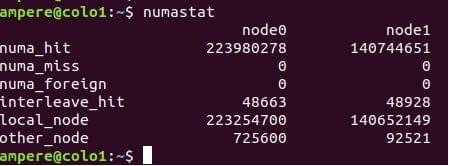
Linux OS tries to allocation memory on the nearest NUMA node, and $numastat shows the current statistics of the memory allocation.
- Numa_hit: Memory allocation on the intended NUMA node
- Numa_miss: Shows local allocation that should have been elsewhere
- Numa_foreign: shows remote allocation that should been local
- Other_node: Memory allocation on this node while the process is running elsewhere
Both numa_miss and Numa_foreign show memory allocations not on the preferred NUMA node. In an ideal situation the values of numa_miss and numa_foreign should be kept to the minimum, as higher values result and poor memory I/O performance.
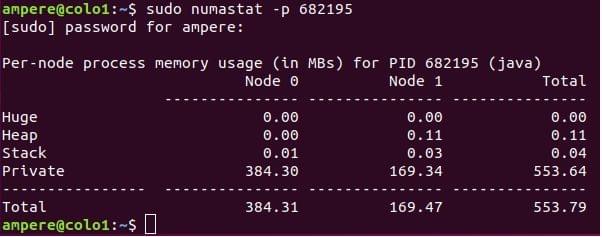
The $numastat -p <process -id> command can also be used to see the NUMA distribution of a process.
10. What is my CPU doing when I am running my application?
When running an application on your system/instance you would be interested in knowing what the application is doing and resources utilized by the application on your CPU. $pidstat is a command-line tool which can monitor every individual process running on the system.
pidstat will break down the top CPU consumers into user-time and system-time.
This Linux tool prints CPU usage by process or thread, including user and system time. This command can also report IO statics of a process (-d option).
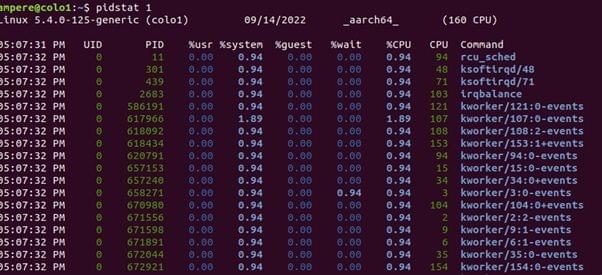
- UID: The real user identification number of the task being monitored
- PID: The identification number of the task being monitored
- %usr: Percentage of CPU used by the task while executing at the user level (application), without nice priority.
- %system: Percent of CPU used by the task while executing at the system level (kernel)
- %wait: Percent of CPU spent by the task while waiting to run
- %CPU: Total percentage of CPU time used by the task.
- CPU: Processor/core number to which the task is attached
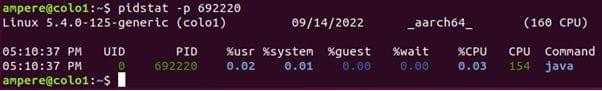
$pidstat -p can be also run to gather data on a particular process.
Talk to our expert sales team about partnerships or learn about access to Ampere Systems through our Developer Access Programs.

