PHP-level Performance Optimization with Blackfire

Key Takeaways
- Blackfire is a valuable tool for detecting and addressing application performance bottlenecks, particularly for projects using Homestead Improved.
- Key terms for understanding Blackfire graphs include: Reference Profile, Exclusive Time, Inclusive Time, and Hot Paths. These help identify the parts of the application that consume more memory, take more CPU time, or are most active during the profile.
- The article demonstrates how to use Blackfire to optimize a multi-image gallery blog application. The process includes identifying bottlenecks, such as PDOExecute, and implementing solutions, such as pagination, to improve performance.
- Regularly re-running performance tests with tools like Blackfire is crucial for any app’s development cycle. Integrating these tests into an app’s test pipeline, like a CD/CI flow, can be extremely productive. Blackfire’s premium subscription offers this feature built in.
This article is part of a series on building a sample application — a multi-image gallery blog — for performance benchmarking and optimizations. (View the repo here.)
Throughout the past few months, we’ve introduced Blackfire and ways in which it can be used to detect application performance bottlenecks. In this post, we’ll apply it to our freshly started project to try and find the low-points and low-hanging fruit which we can pick to improve our app’s performance.
If you’re using Homestead Improved (and you should be), Blackfire is already installed.
While it’s useful to be introduced to Blackfire before diving into this, applying the steps in this post won’t require any prior knowledge; we’ll start from zero.
Setup
The following are useful terms when evaluating graphs produced by Blackfire.
-
Reference Profile: We usually need to run our first profile as a reference profile. This profile will be the performance baseline of our application. We can compare any profile with the reference, to measure the performance achievements.
-
Exclusive Time: The amount of time spent on a function/method to be executed, without considering the time spent for its external calls.
-
Inclusive Time: The total time spent to execute a function including all the external calls.
-
Hot Paths: Hot Paths are the parts of our application that were most active during the profile. These could be the parts that consumed more memory or took more CPU time.
The first step is registering for an account at Blackfire. The account page will have the tokens and IDs which need to be placed into Homestead.yaml after cloning the project. There’s a placeholder for all those values at the bottom:
# blackfire:
#     - id: foo
#       token: bar
#       client-id: foo
#       client-token: bar
After uncommenting the rows and replacing the values, we need to install the Chrome companion.
The Chrome companion is useful only when needing to trigger profiling manually — which will be the majority of your use cases. There are other integrations available as well, a full list of which can be found here.
Optimization with Blackfire
We’ll test the home page: the landing page is arguably the most important part of any website, and if that takes too long to load, we’re guaranteed to lose our visitors. They’ll be gone before Google Analytics can kick in to register the bounce! We could test pages on which users add images, but read-only performance is far more important than write performance, so we’ll focus on the former.
This version of the app loads all the galleries and sorts them by age.
Testing is simple. We open the page we want to benchmark, click the extension’s button in the browser, and select “Profile!”.
Here’s the resulting graph:
In fact, we can see here that the execution time inclusive to exclusive is 100% on the PDO execution. Specifically, this means that the whole dark pink part is spent inside this function and that this function in particular is not waiting for any other function. This is the function being waited on. Other method calls might have light pink bars far bigger than PDO’s, but those light pink parts are a sum of all the smaller light pink parts of depending functions, which means that looked at individually, those functions aren’t the problem. The dark ones need to be handled first; they are the priority.
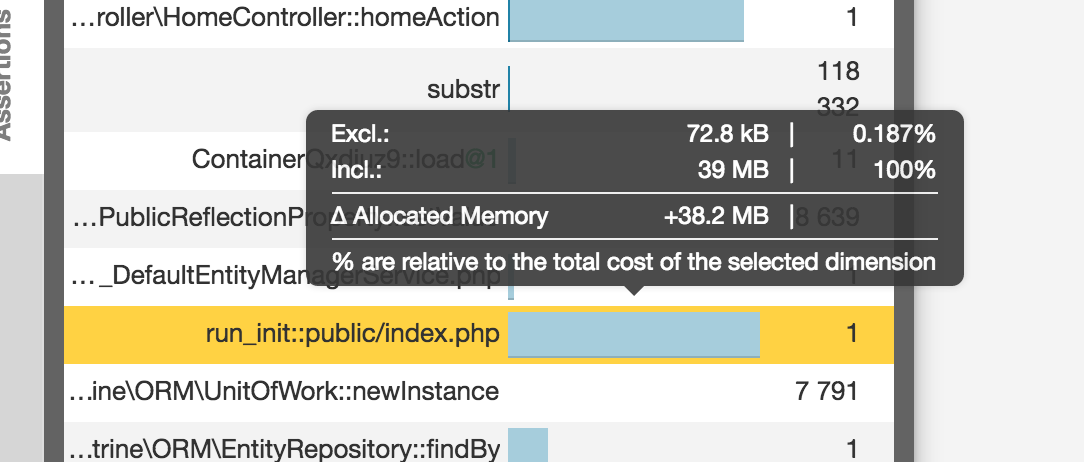
Also, switching to RAM mode reveals that while the whole call used almost a whopping 40MB of RAM, the vast majority is in the Twig rendering, which makes sense: it is showing a lot of data, after all.

In the diagram, hot paths have thick borders and generally indicate bottlenecks. Intensive nodes can be part of the hot path, but also be completely outside it. Intensive nodes are nodes a lot of time is spent in for some reason, and can be indicative of problems just as much.
By looking at the most problematic methods and clicking around on relevant nodes, we can identify that PDOExecute is the most problematic bottleneck, while unserialize uses the most RAM relative to other methods. If we apply some detective work and follow the flow of methods calling each other, we’ll notice that both of these problems are caused by the fact that we’re loading the whole set of galleries on the home page. PDOExecute takes forever in memory and wall time to find them and sort them, and Doctrine takes ages and endless CPU cycles to turn them into renderable entities with unserialize to loop through them in a twig template. The solution seems simple — add pagination to the home page!
By adding a PER_PAGE constant into the HomeController and setting it to something like 12, and then using that pagination constant in the fetching procedure, we block the first call to the newest 12 galleries:
$galleries = $this->em->getRepository(Gallery::class)->findBy([], ['createdAt' => 'DESC'], self::PER_PAGE);
We’ll trigger a lazy load when the user reaches the end of the page when scrolling, so we need to add some JS to the home view:
{% block javascripts %}
    {{ parent() }}

    <script>
        $(function () {
            var nextPage = 2;
            var $galleriesContainer = $('.home__galleries-container');
            var $lazyLoadCta = $('.home__lazy-load-cta');

            function onScroll() {
                var y = $(window).scrollTop() + $(window).outerHeight();
                if (y >= $('body').innerHeight() - 100) {
                    $(window).off('scroll.lazy-load');
                    $lazyLoadCta.click();
                }
            }

            $lazyLoadCta.on('click', function () {
                var url = "{{ url('home.lazy-load') }}";
                $.ajax({
                    url: url,
                    data: {page: nextPage},
                    success: function (data) {
                        if (data.success === true) {
                            $galleriesContainer.append(data.data);
                            nextPage++;
                            $(window).on('scroll.lazy-load', onScroll);
                        }
                    }
                });
            });

            $(window).on('scroll.lazy-load', onScroll);
        });
    </script>
{% endblock %}
Since annotations are being used for routes, it’s easy to just add a new method into the HomeController to lazily load our galleries when triggered:
/**
 * @Route("/galleries-lazy-load", name="home.lazy-load")
 */
public function homeGalleriesLazyLoadAction(Request $request)
{
    $page = $request->get('page', null);
    if (empty($page)) {
        return new JsonResponse([
            'success' => false,
            'msg'     => 'Page param is required',
        ]);
    }

    $offset = ($page - 1) * self::PER_PAGE;
    $galleries = $this->em->getRepository(Gallery::class)->findBy([], ['createdAt' => 'DESC'], 12, $offset);

    $view = $this->twig->render('partials/home-galleries-lazy-load.html.twig', [
        'galleries' => $galleries,
    ]);

    return new JsonResponse([
        'success' => true,
        'data'    => $view,
    ]);
}
Comparison
Let’s now compare our upgraded app with the previous version by re-running the profiler.
Sure enough, our site uses 10 times less memory and loads much faster — maybe not in CPU time, as indicated by the stopwatch in the graph, but in impression. Reloading is now almost instant.
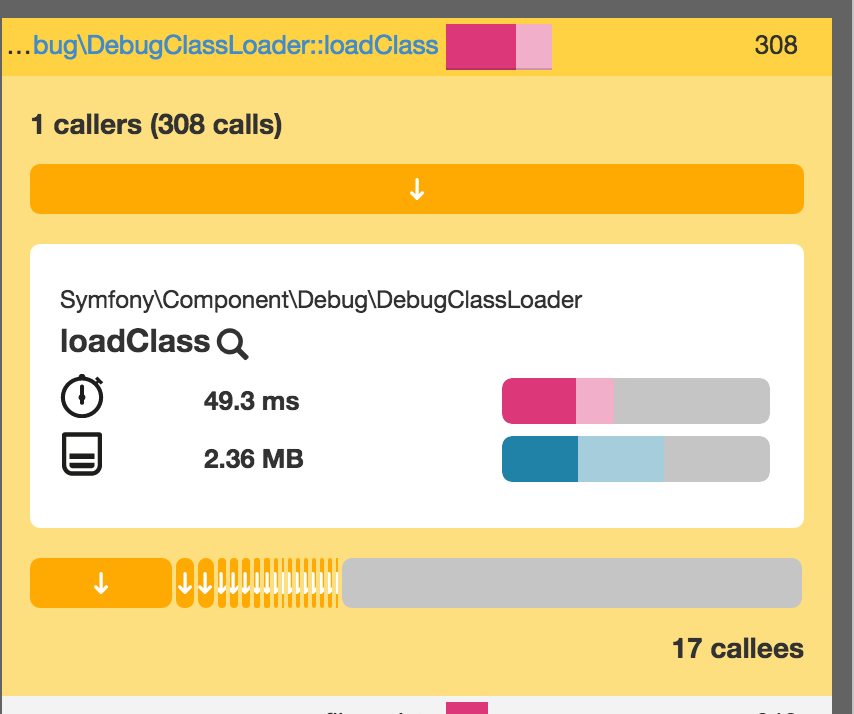
The graph now shows us that DebugClass is the most resource intensive method call.

This happens because we’re in dev mode, and this class loader is generally much slower than the production one because it doesn’t heavily cache the classes. This is necessary so that changes done in the code can be immediately tested without having to clear APC cache or any other cache being used.
If we switch to prod mode just for the purposes of this test, we’ll see a noticeable difference:
Conclusion
The speed of our app is now mind-boggling — a tiny 58ms to load the page, and no class loader in sight. Mind you, this is all happening in a VM with thousands of entries of dummy data. We can feel very optimistic about our app’s production state at this point: there’s little to no optimizations left on the home page; everything else can be classified as a micro-optimization.
Re-running these performance tests regularly is important for any app’s development cycle, and integrating them into an app’s test pipeline, like a CD/CI flow, can be extremely helpful and productive. We’ll look at that option a little later, but it’s important to note that Blackfire’s premium subscription actually offers this very thing built in. Check it out!
Right now, it’s important that we have Blackfire installed and available, and that it can serve us well in finding the bottlenecks and identifying new ones as we add more features into the mix. Welcome to the world of continuous performance testing!
Frequently Asked Questions about PHP Level Performance Optimization
What is PHP level performance optimization and why is it important?
PHP level performance optimization is the process of improving the efficiency and speed of PHP code execution. It involves techniques such as code refactoring, using efficient algorithms, and leveraging PHP’s built-in functions. This is important because optimized PHP code can significantly improve the performance of a website or application, leading to better user experience, lower server costs, and improved SEO rankings.
How can I monitor the performance of my PHP application?
There are several tools available for monitoring PHP performance, such as Blackfire, SolarWinds, and Zend. These tools provide insights into how your PHP code is running, helping you identify bottlenecks and areas for improvement. They can monitor various aspects of your application, including CPU usage, memory usage, and execution time.
What are some common PHP performance issues and how can I avoid them?
Common PHP performance issues include inefficient code, memory leaks, and database bottlenecks. These can be avoided by writing efficient code, regularly testing and profiling your application, and optimizing your database queries. Using a PHP performance monitoring tool can also help you identify and fix these issues.
How can I optimize my PHP code for better performance?
There are several ways to optimize your PHP code for better performance. This includes using efficient algorithms, leveraging PHP’s built-in functions, and avoiding unnecessary computations. You can also use a PHP compiler or opcode cache to improve execution speed.
What is Blackfire and how can it help with PHP performance optimization?
Blackfire is a PHP performance profiling tool. It provides detailed insights into how your PHP code is running, helping you identify bottlenecks and areas for improvement. With Blackfire, you can visualize your application’s performance, track changes over time, and even automate performance testing.
How can I optimize my PHP application for scalability?
Optimizing your PHP application for scalability involves designing your application to handle increased load efficiently. This can be achieved by using efficient algorithms, optimizing database queries, and leveraging caching and load balancing techniques.
What is the impact of PHP version on performance?
The version of PHP you’re using can have a significant impact on performance. Newer versions of PHP often include performance improvements and optimizations, so it’s generally recommended to use the latest stable version of PHP.
How can I optimize my PHP application for mobile devices?
Optimizing your PHP application for mobile devices involves ensuring your application is responsive, efficient, and fast. This can be achieved by optimizing images, leveraging caching, and minimizing server requests.
What are some best practices for PHP performance optimization?
Some best practices for PHP performance optimization include regularly profiling and testing your application, using efficient algorithms, leveraging PHP’s built-in functions, and keeping your PHP version up to date.
How can I automate PHP performance testing?
You can automate PHP performance testing using tools like Blackfire. These tools can automatically profile your application, track changes over time, and alert you to any performance regressions.
Bruno is a blockchain developer and technical educator at the Web3 Foundation, the foundation that's building the next generation of the free people's internet. He runs two newsletters you should subscribe to if you're interested in Web3.0: Dot Leap covers ecosystem and tech development of Web3, and NFT Review covers the evolution of the non-fungible token (digital collectibles) ecosystem inside this emerging new web. His current passion project is RMRK.app, the most advanced NFT system in the world, which allows NFTs to own other NFTs, NFTs to react to emotion, NFTs to be governed democratically, and NFTs to be multiple things at once.


