

Maps are great devices for telling stories.

Game of Thrones famously uses that animated map in the title sequence to help set the epic tone of their universe. Casablanca sets up its opening scenes with a map centered on Paris that traces a thick black line south to Morocco.
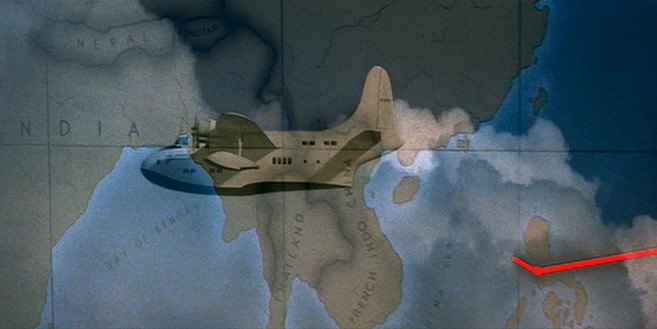
Forty year later Steven Spielberg was using a similar trick in ‘Raiders of the Lost Ark’, to help us track Indiana Jones’ Boeing seaplane from San Fransisco to Nepal. The red line became a trope of all the Indiana Jones movies.
More recently The Muppets played with the idea by having a ‘traveling by map’ button in their car.
Maps on the Web
Maps can be powerful on the web too, letting us tie important ideas and statistic to specific geographical areas. This could be anything including:
- Sales numbers
- Subscribers/viewers
- Paid-up Members
- Regional Offices
But where do you start when creating a new map? Screen capturing Google Earth or Open Street Maps isn’t going to cut it. You could draw a map from scratch, but coastlines are notoriously finicky, time-consuming things to create.
Using AMCharts to Make for SVG Maps
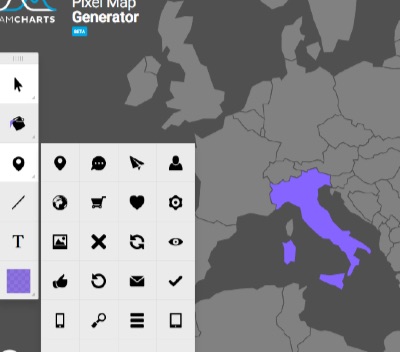
AMCharts.com offers a bunch of really cool JavaScript charting tools, including pie charts, line graphs and bar graphs. But they also have a less well known, but very nifty map creation tool in beta called Pixel Map Generator.
![]()
This tool is easy to get started with. Controls in the bottom panel of the web app allow you to zoom, position and frame the map to your liking. A separate dropdown lets you select individual countries. This panel also lets you set default land and ocean colors
A toolbar on the left lets you re-color map components, draw routes, and annotate and label your map. Pulling together the basic components of a useful map literally takes minutes.
I think the really cool part is the export options. PNG, HTML (& JS) or SVG. The PNG is a good fallback and the HTML/JS is nice to embed, but that last option is the one I like.
Typically SVG generated by graphics editors is very messy and unwieldy, but AMCharts seems to write very clean, well-structured SVG files. You can copy this SVG code, paste it into a new text file, save it as SVG and embed it straight into your next site/web app.
But you can also do more.
You could open this SVG map directly in Adobe Illustrator or Inkscape, but I would advise against it – the file will get instantly rewritten and you’d lose a lot of that natural elegance.
A more interesting idea is to copy the SVG code and paste it straight into a Codepen HTML panel. Even if you know zero about SVG markup, you’ll recognise it as a ‘HTML-like file’ that you can start manipulating and styling with CSS. Start hacking it!
Here’s one I prepared earlier: http://codepen.io/SitePoint/pen/dYGxPE
See the Pen dYGxPE by SitePoint (@SitePoint) on CodePen.
Like HTML, you can add classes and IDs to elements and then target those elements with CSS – even transforms, animations and transitions.
That’s a lot of design freedom to play with and AMCharts does all the hard map-drawing bits.
Frequently Asked Questions (FAQs) about Indiana Jones and the Lost SVG Map Editor
What is the Indiana Jones and the Lost SVG Map Editor?
The Indiana Jones and the Lost SVG Map Editor is a tool that allows you to create and edit SVG maps in a style reminiscent of the Indiana Jones movies. It’s a fun and creative way to visualize your travel routes or plan future adventures. The tool is user-friendly and doesn’t require any coding skills, making it accessible to everyone.
How can I use the SVG Map Editor to create my own Indiana Jones-style map?
To create your own map, you simply need to upload an SVG file of the world map or any specific region you’re interested in. You can then use the editor’s tools to draw routes, add markers, and customize the map’s appearance. Once you’re satisfied with your map, you can save it and share it with others.
Can I use the SVG Map Editor for professional purposes?
Absolutely! While the Indiana Jones-style maps are fun and engaging, the SVG Map Editor is a powerful tool that can be used for professional purposes as well. It’s a great way to visualize data, present travel plans, or create unique and interactive infographics.
Is the SVG Map Editor compatible with all browsers?
The SVG Map Editor is designed to work with all modern web browsers. However, for the best user experience, it’s recommended to use it with Google Chrome or Mozilla Firefox.
Can I use the SVG Map Editor on my mobile device?
The SVG Map Editor is primarily designed for use on desktop computers. While it may work on some mobile devices, the user experience may not be optimal due to the smaller screen size.
How can I share my maps created with the SVG Map Editor?
Once you’ve created your map, you can save it as an SVG file. This file can then be shared via email, social media, or any other method you prefer. You can also embed the map on your website or blog.
Can I add text or labels to my map?
Yes, the SVG Map Editor allows you to add text and labels to your map. This can be useful for providing additional information or context about the routes or locations on your map.
Can I customize the appearance of my map?
Absolutely! The SVG Map Editor offers a range of customization options. You can change the color and style of your routes, add custom markers, and even adjust the overall look and feel of the map to suit your preferences.
Do I need any special software to use the SVG Map Editor?
No, the SVG Map Editor is a web-based tool, so you don’t need to download or install any software. All you need is a modern web browser and an internet connection.
Is the SVG Map Editor free to use?
Yes, the SVG Map Editor is completely free to use. There are no hidden charges or subscription fees. You can create as many maps as you like without any cost.

