

Key Takeaways
- Blynk is a smartphone app that can create a quick and easy interface for an IoT ecosystem, integrating with systems like Arduino, Particle, ESP8266, Intel Edison, Intel Galileo, LightBlue Bean, Raspberry Pi, and more.
- Blynk allows you to display sensor values and trigger pin responses to turn components on and off, making it ideal for testing prototypes and creating simple dashboard controls for home IoT projects.
- To set up Blynk, you need a Particle Core or Photon, a breadboard, resistors and jumper wires, LEDs and analog sensors, and the Blynk app. You also need to know how to get code onto your Particle device.
- The Particle device can be set up to use Blynk through the Particle Build interface, which includes a pre-built library for Blynk integration. The code for the Particle device is then updated with an auth code emailed from Blynk.
Not everyone wants to code up a whole interface for their IoT ecosystem. Sometimes you need a quick and easy interface that’ll be easy to set up and run. Blynk is that interface! It is a smartphone app which can integrate with a range of systems including Arduino, Particle, ESP8266, Intel Edison, Intel Galileo, LightBlue Bean, Raspberry Pi and more. It allows you to display the values from your sensors and trigger pin responses to turn components on and off. It’s a very easy and quick way to test prototypes too. I couldn’t find a good overview of how to pair a Particle device with Blynk, so that’s what I’ll be covering in this article.
If you don’t have a Particle device but have an Arduino or other microcontroller, much of the Blynk process should be the same as I explain in this article, you’ll just need to put the Blynk code onto the device differently (for Arduino, upload this library).
What You’ll Need
- A Particle Core or Photon
- A breadboard, resistors and jumper wires
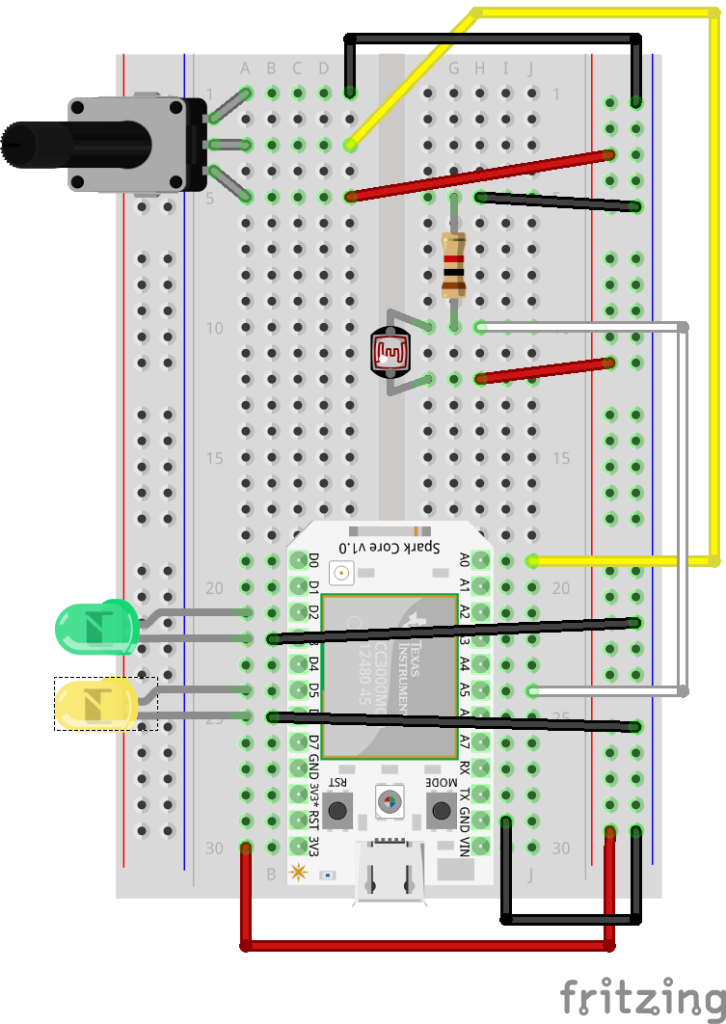
- Some LEDs and analog sensors – the Blynk app works with any analog and digital pin signals, so feel free to switch these to use your own components. I’ve used a potentiometer and a photo resistor.
- The Blynk app – You can find it on iOS and Android.
- Knowledge of how to get code onto your Particle device – see the connecting to the Photon article if you’re new to this or this official guide to Particle Core.
My Sketch
If you’d like to follow along with my exact set up (or close to it depending on which parts you have), here is the sketch:
Setting Up Blynk
To begin, open up Blynk on your smartphone (if you don’t have it yet, these are the links to the iOS download and Android download).
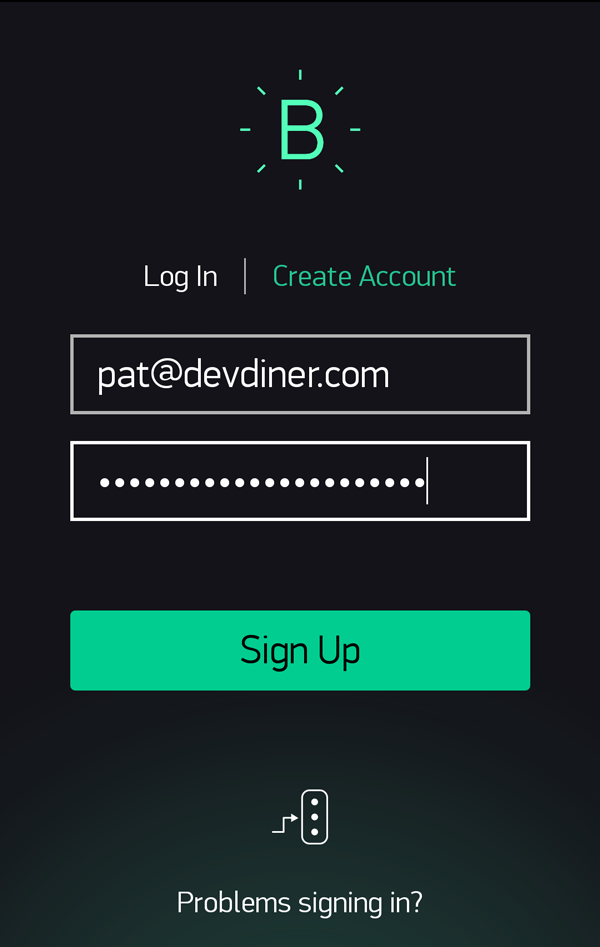
On first loading the app, you’ll need to create an account. That process is pretty simple, enter an email and password and click “Sign Up”:
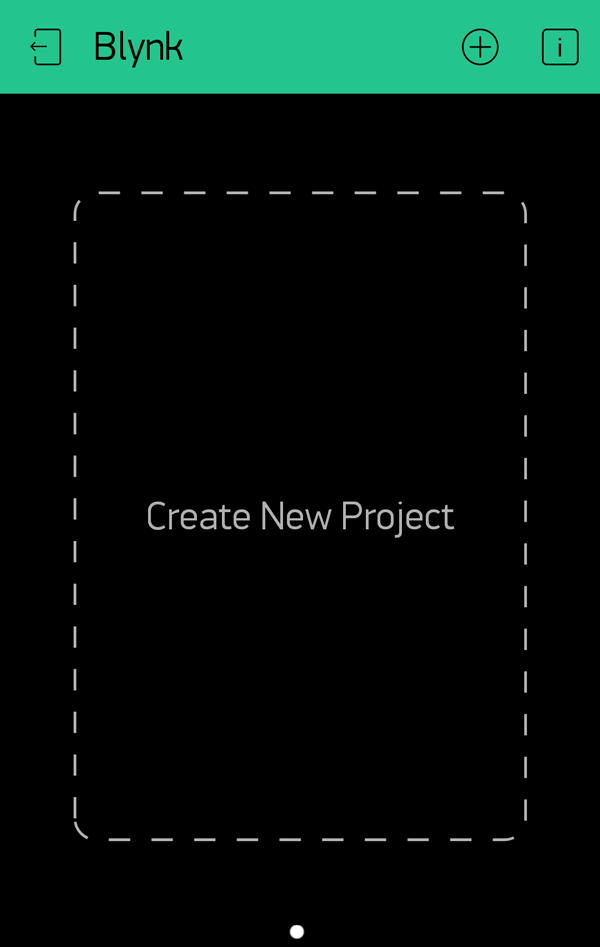
Once you have signed up, you will be greeted with the project screen. Click “Create New Project” to set up your first project:
In our new project’s settings, we give it a name and choose “Particle Core” as our hardware model (this is the one to choose if you are working with a Photon too). I’ve called my project “IoT Dashboard”, feel free to get more creative!
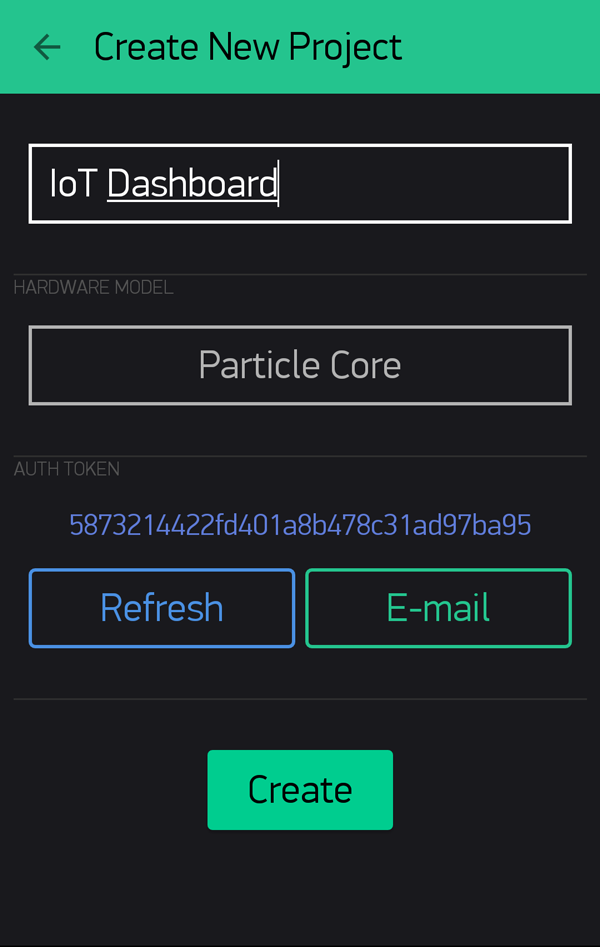
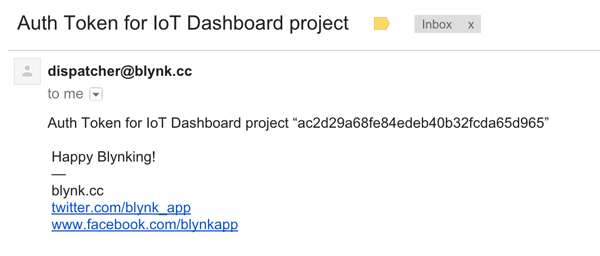
You’ll see an auth token there on that screen too. Rather than typing it all in or somehow memorizing the whole thing, click the “E-mail” button to have it emailed to you. This is a huge time saver! The email you receive will look like so:
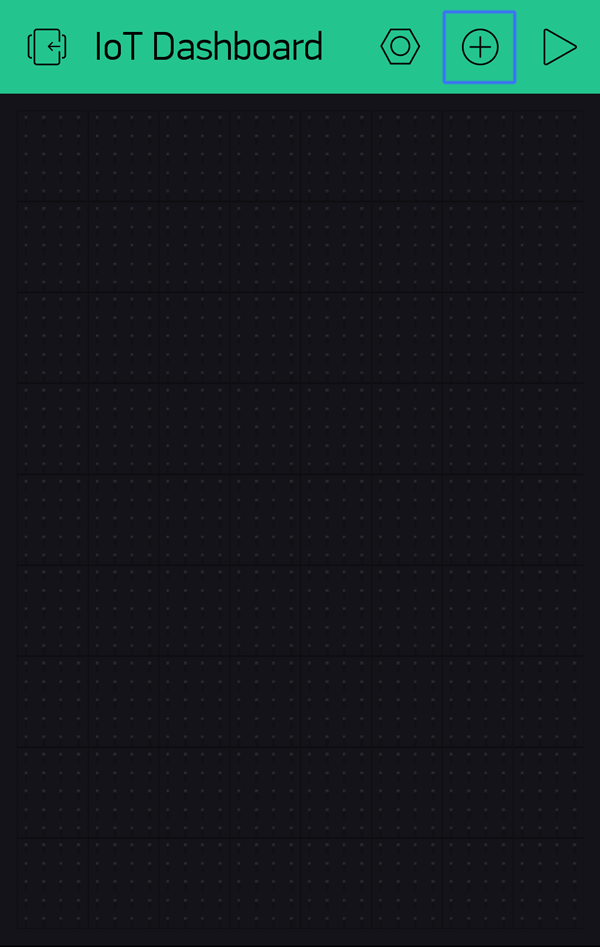
Click “Create” and you will end up at a rather black and empty looking screen. This is where you want to put in all your components. Click the icon with the plus at the top right corner to open up the “Widget Box”:
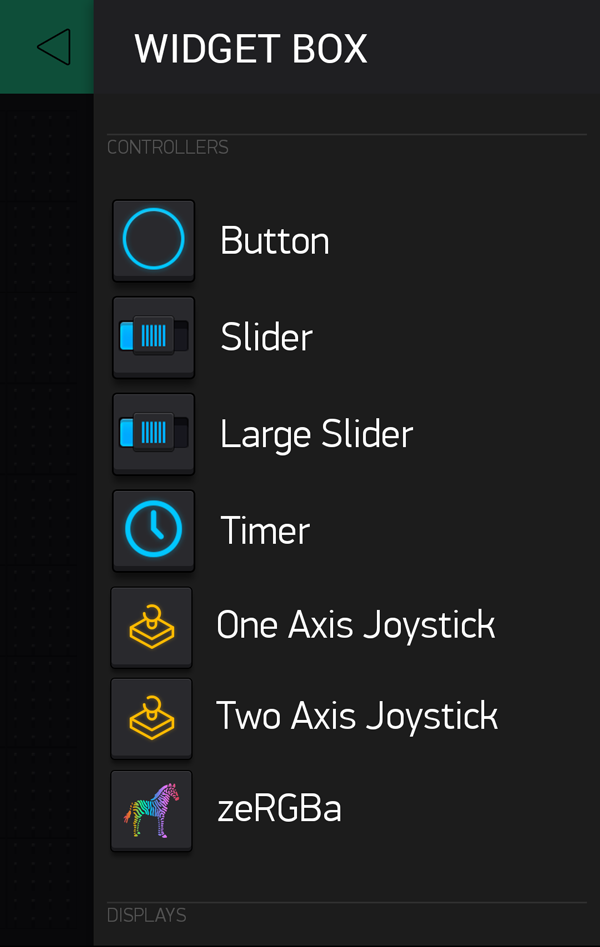
The “Widget Box” is a menu of plenty of different widgets you can add to your project to either control hardware components or read in data from sensors:
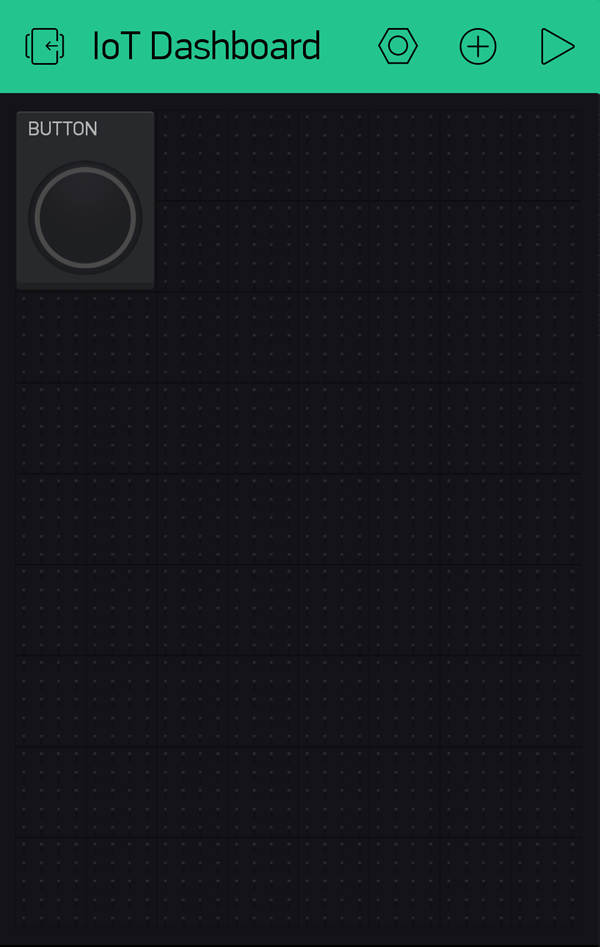
To start with, lets create a button that can turn on our LED. Click “Button”. This places a button widget onto our project:
Click that button widge to change its settings. I’ve titled my button component as “LED” as it is going to turn an LED on and off. I’ve set the pin to D2 and left the Mode to “Push”. This means the digital pin is on when the button is pressed down but is off the moment you let go of the button. “Switch” turns it into a toggle where the state stays on when you click it once and off when you click again. The colored circle lets you change the highlight color of the button when it is active.
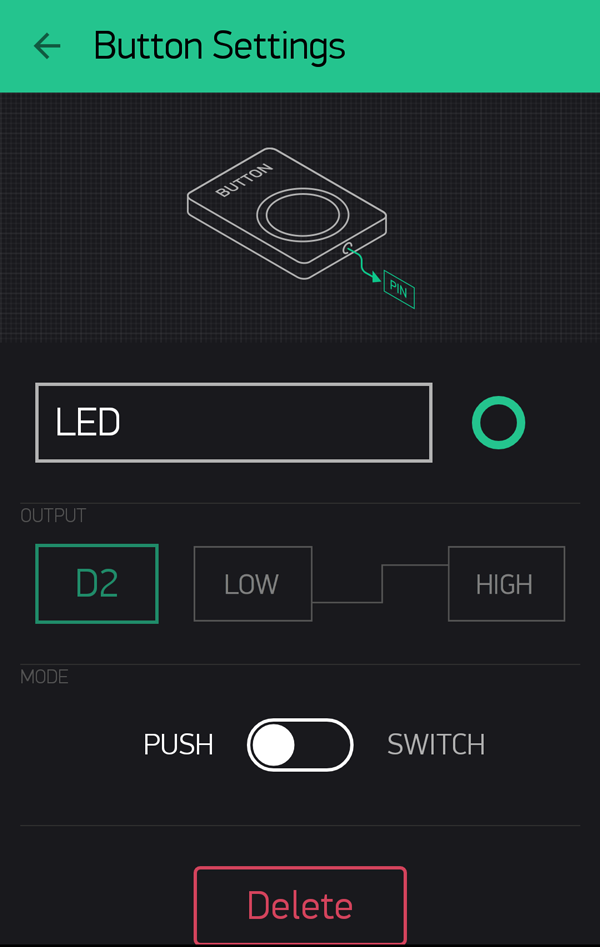
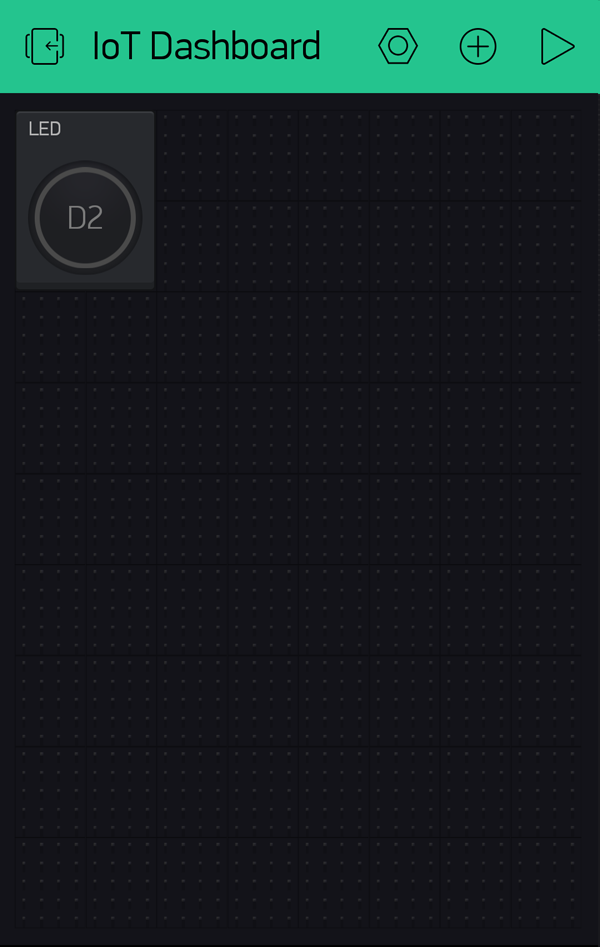
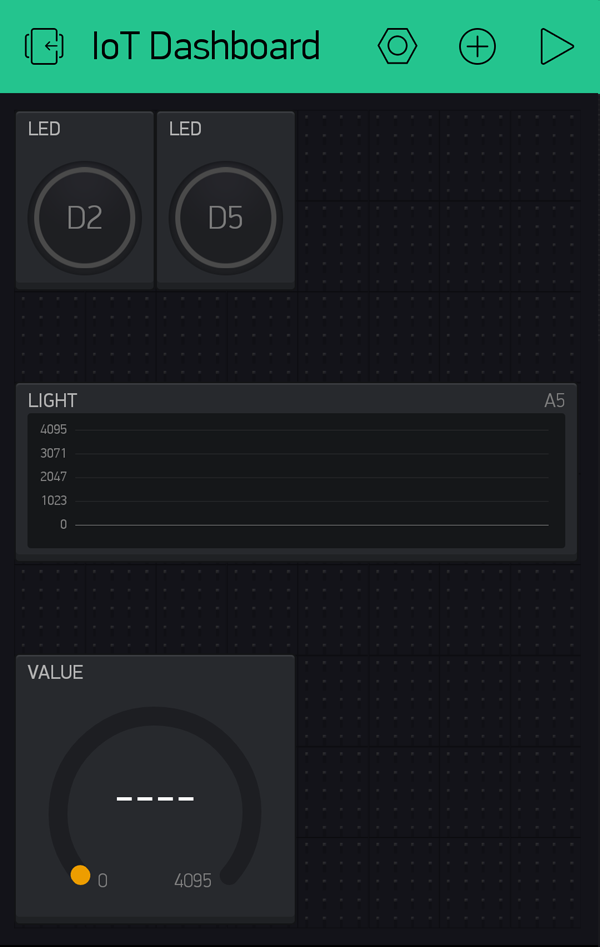
When you are happy with those settings, click the back arrow to return to the project’s screen. You’ll see the widget now shows the pin number:
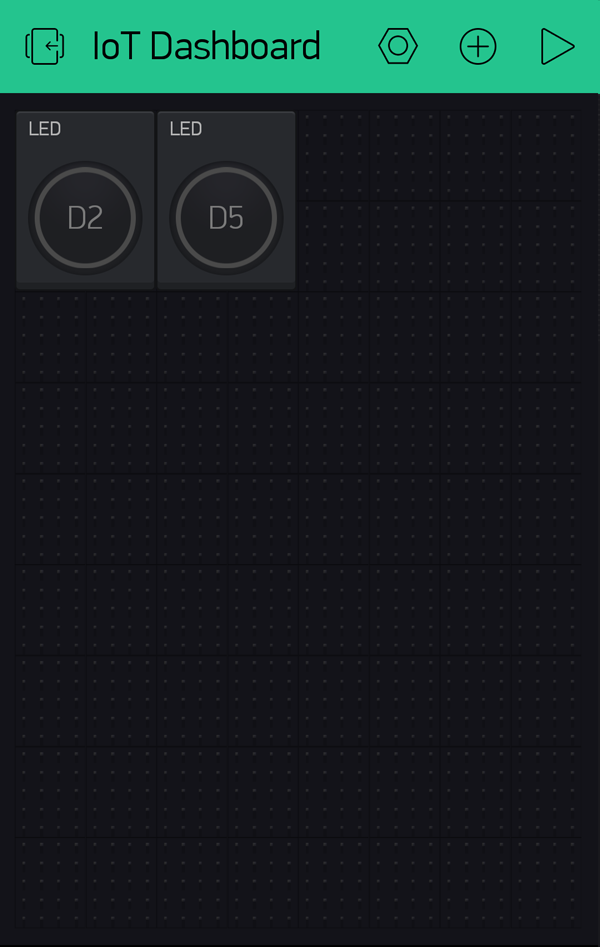
I’ve got two LEDs in my set up, so I added a second one, changing the color of the second one to orange.
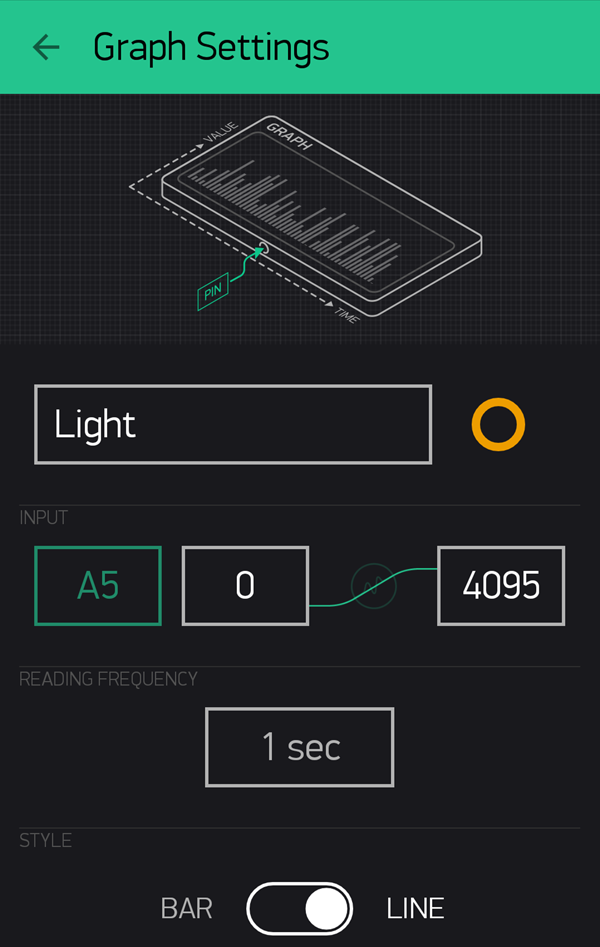
I also have a photosensor to detect light levels in the room attached to pin A5. To display the values from this sort of analog input, it can be quite nice to have a line graph showing the levels streaming in. For this, create a “Graph” widget. Click on it once again to open up the settings for it.
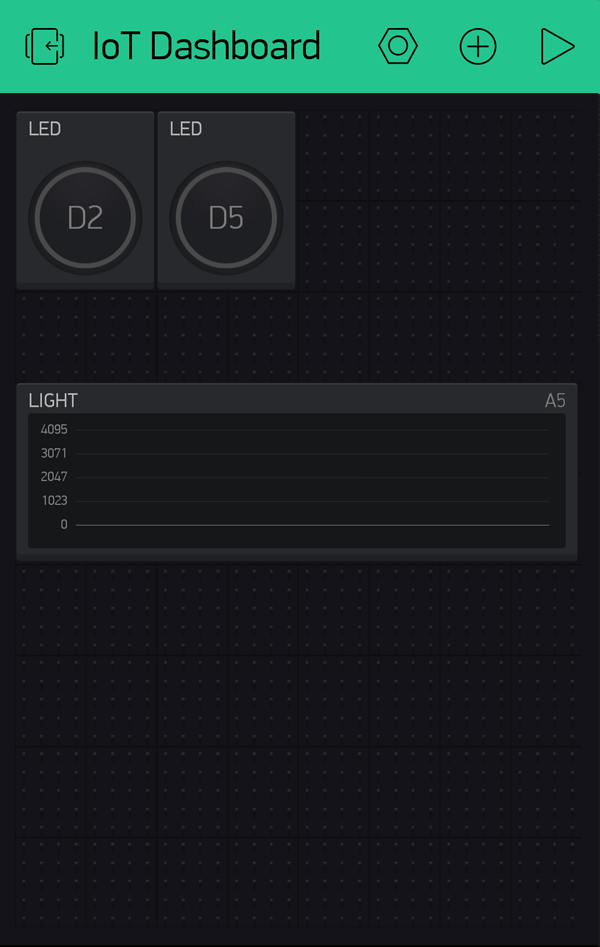
I’ve named mine “LIGHT”, set it to A5 and set the values from 0 to 4095 (your own analog set up might have a different range, feel free to change it to suit that). I left the reading frequency at “1 sec”, however you could request it to ping these values more or less frequently depending on your preferences. The bottom toggle sets whether the graph is a bar graph or a line graph. I liked the line graph more:
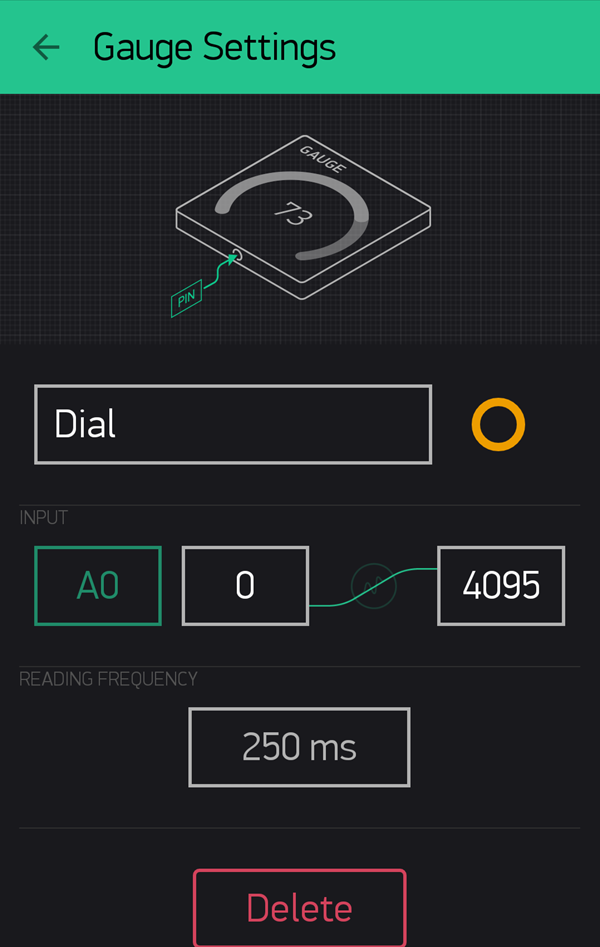
Another neat way of showing analog values is via a “Gauge” widget. I connected up a potentiometer to my breadboard to experiment with this one. You could attach it to any analog input. To try this out, add a “Gauge” widget:
Click the new widget to open the settings and adjust them to your component. I named my “Gauge” widget “Dial” and connected it to pin A0. I set the reading frequency to 250ms to get a nice and quick response time when twisting the potentiometer around:
Setting Up Your Particle Device
Setting up the Particle device to use Blynk isn’t too difficult. Luckily most of the grunt work is already done for you in a pre-built library!
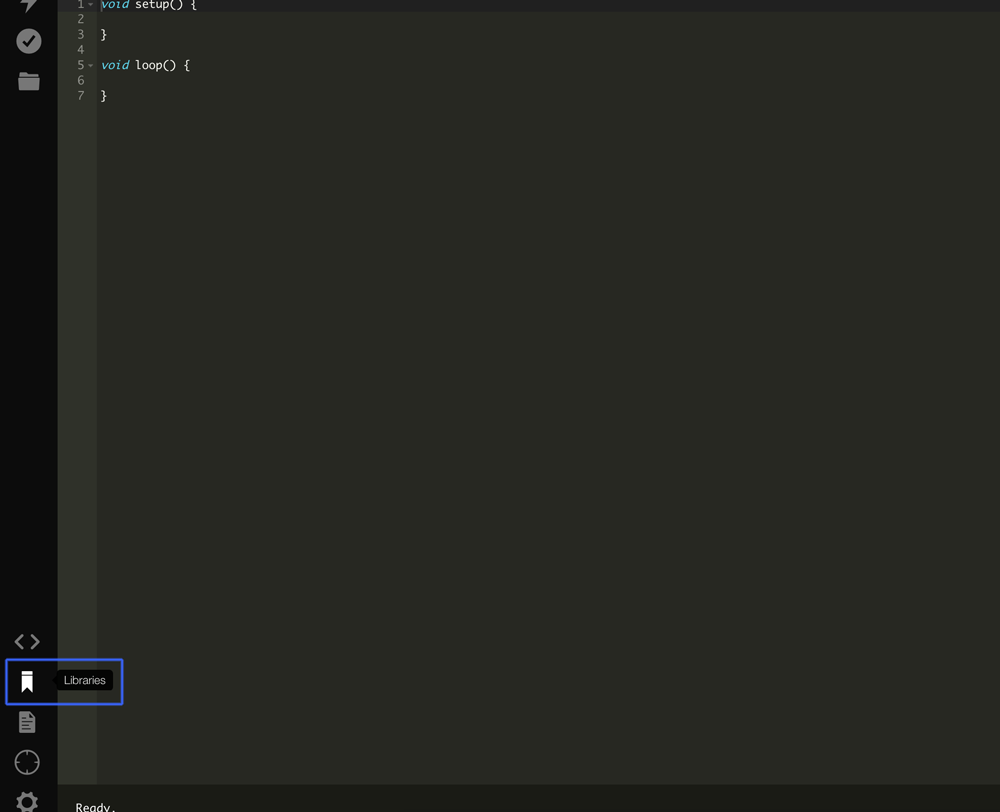
To start with, create a new project in the Particle Build interface. Call it whatever your heart desires. Mine was called a rather imaginative name. I called it “Blynk”.
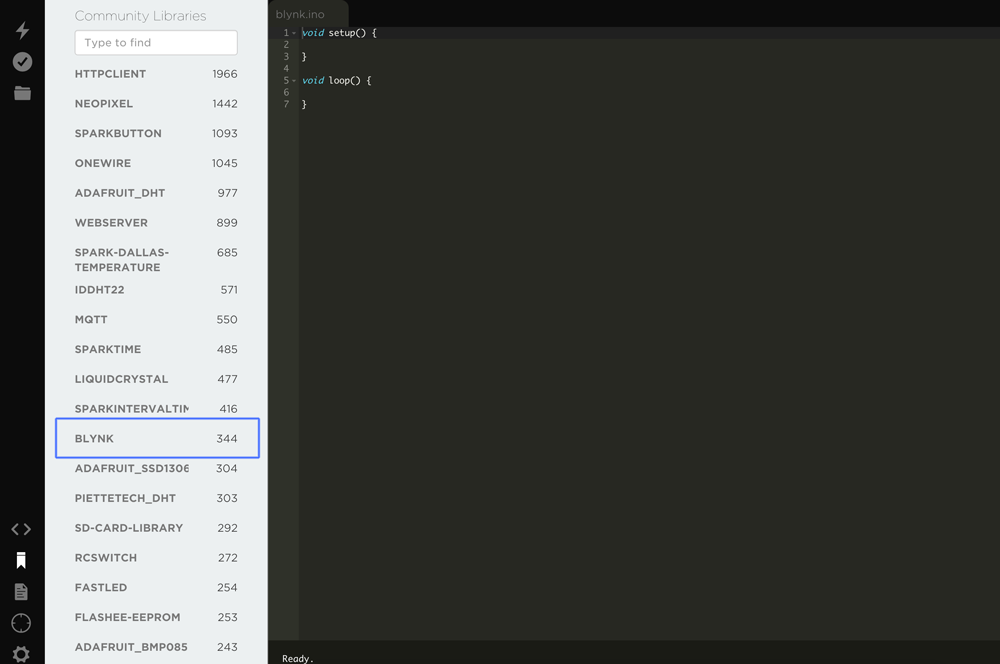
In your new project, click on the libraries icon on the bottom left:
You’ll see within the “Community Libraries” section, the “Blynk” library. Select that one:
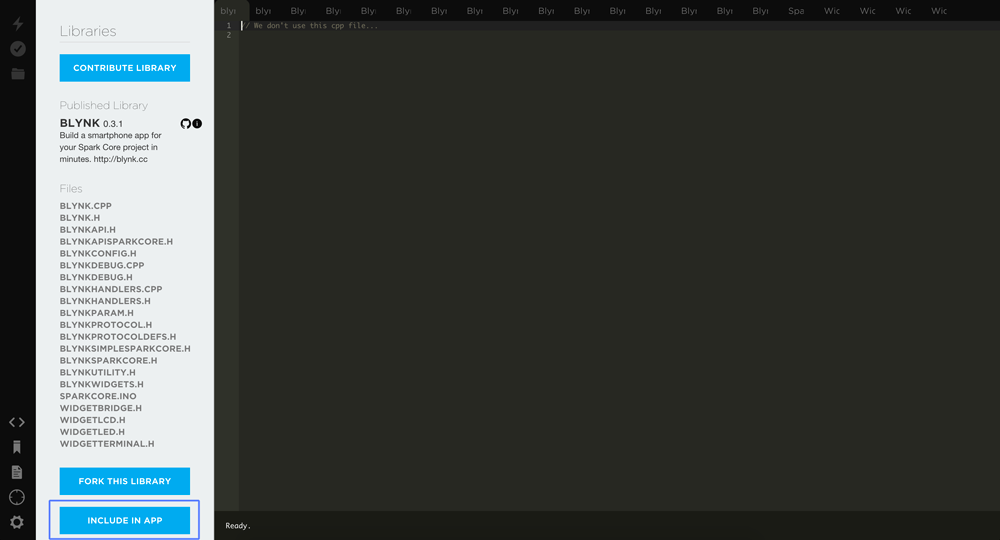
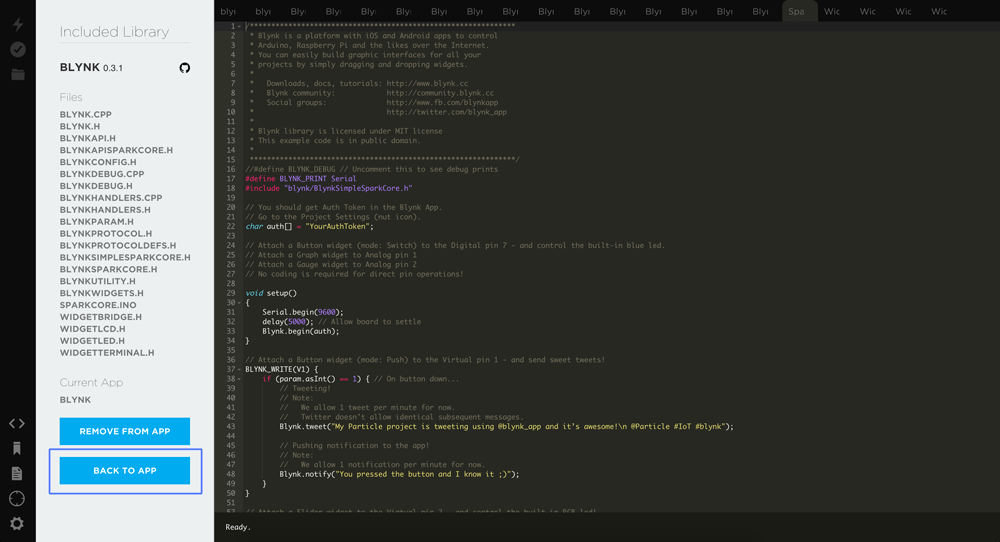
It will load the many files that make up the Blynk library. These are what will provide all our Blynk integration without us needing to hardcode it all from scratch. Click “Include in App”:
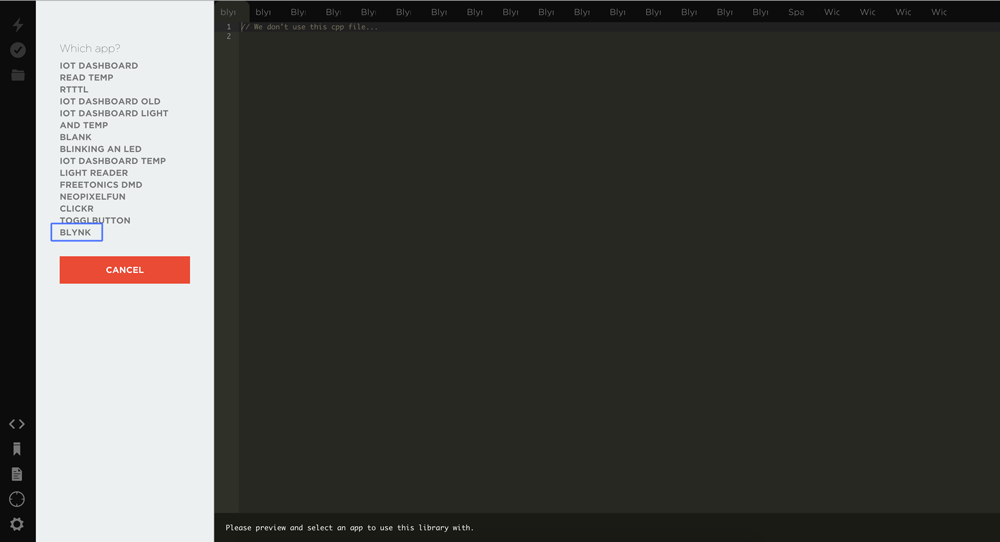
It will ask which app you’d like to add it to. Choose the new app you just created (mine was called “Blynk”):
Then click “Add to this app” to confirm:
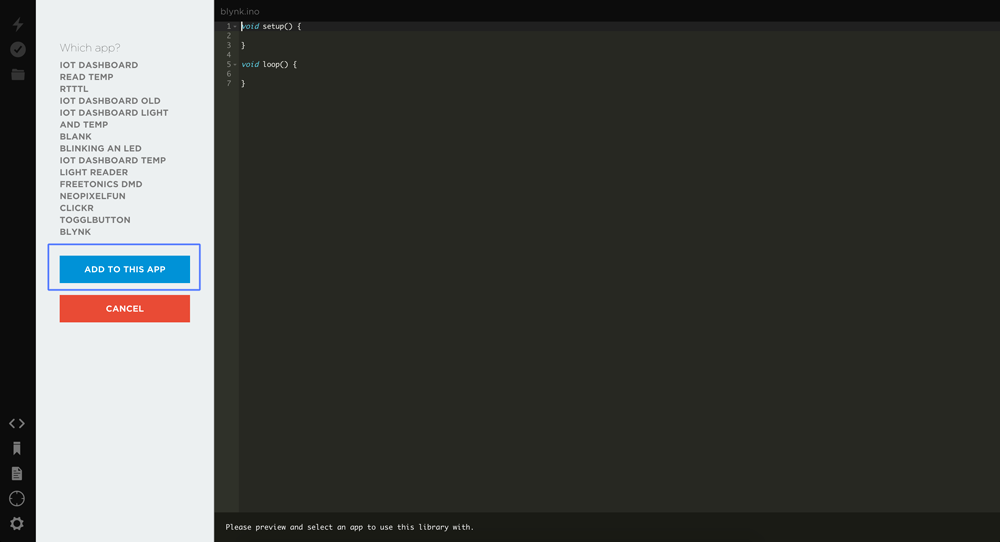
It will add this into your app. Click “Back to App” to get back to setting up the rest of your code:
The Particle Code
The code for the Particle device should now look like so:
// This #include statement was automatically added by the Particle IDE.

#include "blynk/blynk.h"
Update the code to look like so:
// This #include statement was automatically added by the Particle IDE.

#include "blynk/blynk.h"
char auth[] = "YOURAUTHCODE";
void setup()

{

  Serial.begin(9600);

  delay(5000);

  Blynk.begin(auth);

}
void loop()

{

  Blynk.run();

}
Change YOURAUTHCODE to the code you were emailed earlier.
The code itself is quite simple. Within our setup() function, we initialize the serial port on port 9600 then wait for five seconds to be sure the Particle device is ready:
Serial.begin(9600);

delay(5000);
Then we initialize our use of the Blynk library by passing in our auth code:
Blynk.begin(auth);
Then within our loop() function we run Blynk to check for any changes in our Particle device’s state or changes in requests from our Blynk app:
void loop()

{

  Blynk.run();

}
Flash that code onto your Particle device!
In Action
With your Particle device connected and with that code successfully running on the device, click the play button in the top right to start pulling in values. My one looks like this in action:
Here’s a video of it working for those more video inclined:
[youtube mThrK2iy1fY]
Conclusion
Blynk is a great tool for putting together a simple dashboard control for a home IoT project. It is also great for testing out whether a prototype is streaming the right values before delving into app development. Hopefully this has provided developers a new and rather useful tool to have in their IoT toolbelt!
If you have seen Blynk in use somewhere really interesting, or have used it in a neat way, please share it in the comments or get in touch with me on Twitter (@thatpatrickguy). I’d love to hear about it!
If you’re looking for other links and sample projects to guide you in your Particle development, I’ve got a set of curated links that might be perfect for you! Head over to Dev Diner and check out my Dev Diner Particle Developer Guide, full of both official links, other great SitePoint articles and more. If you’ve got other great resources I don’t have listed – please let me know too!
Frequently Asked Questions (FAQs) on Creating an Effective IoT Dashboard Without Coding
What are the key elements to consider when designing an IoT dashboard without coding?
When designing an IoT dashboard without coding, it’s crucial to focus on the user experience. This includes ensuring the dashboard is intuitive, easy to navigate, and visually appealing. The data should be presented in a clear and concise manner, using charts, graphs, and other visual aids where appropriate. It’s also important to consider the type of data you’ll be displaying and how often it will be updated. The dashboard should be designed in a way that allows for easy updates and changes as needed.
How can I ensure my IoT dashboard is user-friendly?
To ensure your IoT dashboard is user-friendly, you should focus on simplicity and functionality. The design should be clean and uncluttered, with a clear layout that makes it easy for users to find the information they need. The dashboard should also be responsive, meaning it should work well on a variety of devices and screen sizes. Additionally, consider including features such as search functionality and filters to help users quickly locate specific data.
Can I customize my IoT dashboard without coding?
Yes, many IoT dashboard platforms offer a range of customization options that don’t require any coding knowledge. This can include changing the layout, colors, and fonts, as well as adding or removing data fields. Some platforms also allow you to create custom widgets or modules to display specific types of data. However, the level of customization available can vary between different platforms, so it’s important to choose one that meets your specific needs.
How can I ensure my IoT dashboard is secure?
Ensuring the security of your IoT dashboard is crucial. This can be achieved by implementing strong authentication measures, such as two-factor authentication, and regularly updating and patching your system to protect against potential vulnerabilities. It’s also important to monitor your system for any unusual activity and to have a response plan in place in case of a security breach.
What are some of the best platforms for creating an IoT dashboard without coding?
There are several platforms available that allow you to create an IoT dashboard without coding. These include Thingsboard, Glide Apps, and Stacker. These platforms offer a range of features and customization options, and are designed to be user-friendly, even for those with no coding experience. However, the best platform for you will depend on your specific needs and requirements.
How can I integrate data from multiple sources into my IoT dashboard?
Most IoT dashboard platforms allow you to integrate data from multiple sources. This can be done by connecting your dashboard to the relevant data sources, such as databases, APIs, or IoT devices. Some platforms also offer built-in data integration tools, which can simplify the process and ensure your data is accurately and consistently displayed.
Can I share my IoT dashboard with others?
Yes, most IoT dashboard platforms allow you to share your dashboard with others. This can be done by generating a shareable link, or by adding users to your dashboard. Some platforms also offer more advanced sharing options, such as the ability to set user permissions or to create public dashboards.
How can I update my IoT dashboard?
Updating your IoT dashboard is typically a straightforward process. Most platforms allow you to make changes to your dashboard directly from the user interface, without the need for any coding. This can include adding or removing data fields, changing the layout or design, or updating the data source. Some platforms also offer automatic updates, which can ensure your dashboard is always up-to-date with the latest data.
Can I use my IoT dashboard to monitor real-time data?
Yes, many IoT dashboard platforms support real-time data monitoring. This means you can use your dashboard to track and visualize data as it’s being generated, allowing you to respond quickly to any changes or anomalies. However, the ability to monitor real-time data can depend on the specific platform and data source, so it’s important to check this before choosing a platform.
What are the costs associated with creating an IoT dashboard without coding?
The costs associated with creating an IoT dashboard without coding can vary depending on the platform you choose. Some platforms offer free plans, but these may have limitations in terms of features or data capacity. Other platforms charge a monthly or annual fee, which can vary depending on the level of functionality and support provided. It’s also worth considering any additional costs, such as data integration or security measures.

