
Key Takeaways
- Firebase is a platform for building mobile and web applications, offering services such as User Authentication, Realtime Database, and Static Hosting. Its Realtime Database service is a NoSQL JSON database with features like offline support, data validation, security rules, and realtime data synchronization.
- Firebase allows for graph modeling, which can be used to represent complex relationships between objects. Graphs comprise nodes (vertices) and edges (links). In Firebase, vertices can be stored in a child attribute value and edges in another one, each edge having a key for its starting and ending vertex.
- Firebase is suitable for creating responsive applications that require real-time, bi-directional communication between web clients. It can be integrated with other tools like Force Editor for graph visualization and Backbone.js for web app development.
- Firebase also offers hosting services over a secure connection by default. Developers can deploy all the static files of an application to the web using firebase-tools. The platform’s pricing model is based on the amount of data stored and transferred.
This article was peer reviewed by Thomas Greco and Edwin Reynoso. Thanks to all of SitePoint’s peer reviewers for making SitePoint content the best it can be!
In my previous article titled “Build a Web App with Backbone.js and Socket.io” I’ve explained how to use Backbone.js and Socket.IO to implement an asynchronous messaging paradigm to avoid coupling.
The idea behind the tutorial was to separate groups of code that are highly dependent on one another and the example I’ve shown was a graph visualization tool where data is beautifully synced cross users.
In this post, I’ll re-use my Backbone example to migrate the existing data storage to Firebase. Before deepening the topic, let’s take a quick look at some Firebase concepts, and then get started coding.
Firebase
Firebase is a platform for building mobile and web applications. It provides three services:
- User Authentication, which is a tool to authenticate users with only client-side code
- Realtime Database, a realtime JSON database for storing and sync data
- Static Hosting, a production-grade static asset hosting
These services take responsibility to handle complex things and do the hard work of backend for us. Besides, Firebase applications can be accessed directly from the client side.
The realtime database service is basically a NoSQL JSON database, like MongoDB. It has several features such as offline support, data validation, and security rules. Personally, I think that the most interesting feature is the realtime data synchronization. In case there is a database change, the data will be synced across all connected clients in realtime, all within milliseconds. This means we’re dealing with a great tool expecting an incredible low effort to create very responsive applications.
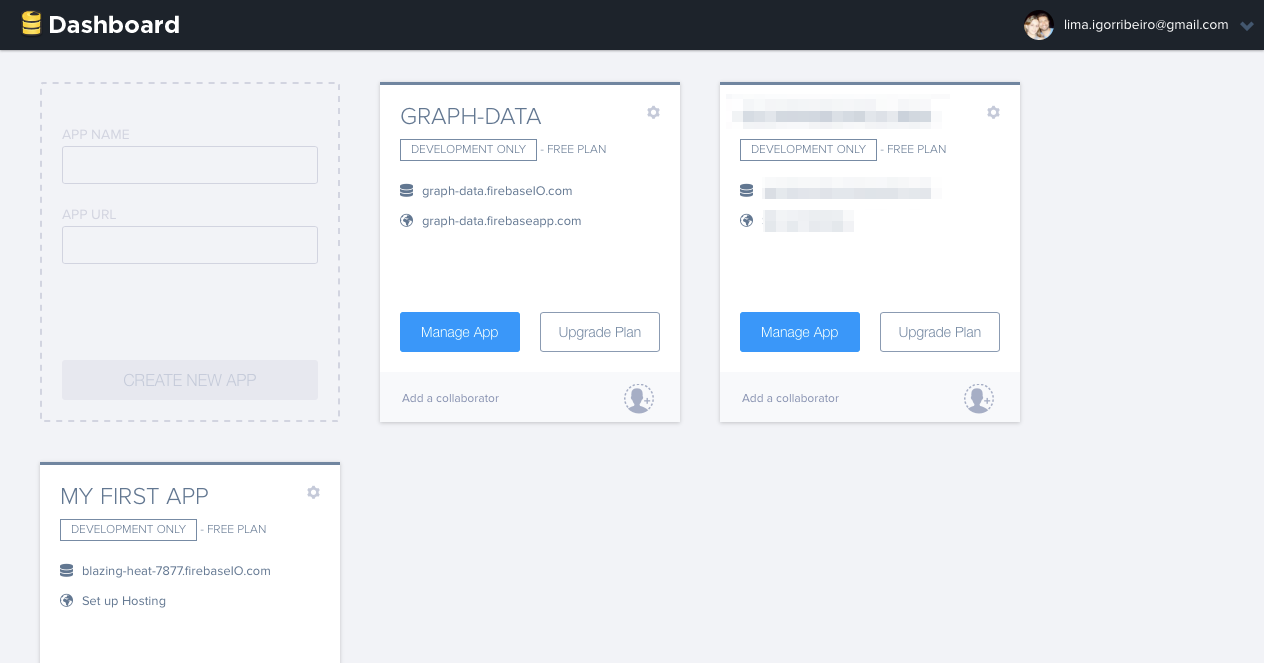
Getting Started with Firebase
The first thing to get started with Firebase is to sign up for a free account and create a new Firebase application. After creating the app, it should have its unique database URL ending with “firebaseio.com”. This is the URL that we’ll use to store and sync data.
To install and start using this new app, include the Firebase client library in your HTML file. Do it by adding a script tag at the end of the <body> section:
<script src="https://cdn.firebase.com/js/client/2.3.2/firebase.js"></script>
To read and write data to and from the database, it’s necessary to create a reference to the Firebase app. This is created by passing the Firebase app URL into the Firebase constructor:
var myFirebaseRef = new Firebase("https://.firebaseio.com/");
This reference does not create a connection to the server or begin downloading data. Firebase will not fetch data until invoking a read or write operation. Once retrieving it, it stays cached locally until the last event listener is removed.
Another interesting thing to know is that you have the chance to access directly child nodes in the data as well. To point to any child from an existing reference, simply use the child() API call:
var myFirebaseRef = new Firebase('https://graph-data.firebaseio.com');

var vertexRef = myFirebaseRef.child('vertex');
Once a reference has been created, any valid JSON object can be written to it using set().
var myFirebaseRef = new Firebase('https://graph-data.firebaseio.com');

var vertexRef = myFirebaseRef.child('vertex');

var firstNode = vertexRef.child('my first node');

firstNode.set({

  color: 'blue',

  label: 'I am blue'

});
For reading data from this reference, use the on() method. Attach a callback and handle the resulting events.
var myFirebaseRef = new Firebase('https://graph-data.firebaseio.com');

var vertexRef = myFirebaseRef.child('vertex');

var firstNode = vertexRef.child('my first node');

firstNode.on("value", function(snapshot) {

  console.log( snapshot.val() );

  // logs "Object {color: 'blue', label: 'I am blue'}"

});
Graph in Data Modeling
This section is about graph modeling using Firebase. If you’re unfamiliar with graph concepts, this would be an excellent occasion to go through it. On the other hand, those of you who already know what I’m talking about, won’t find any difficulties.
Graphs, quite simply, are a way to model complex relationships between many objects. A graph is a collection of nodes (also known as vertices) and edges (also known as links). A node is merely an abstract data point and it can represent anything such as a person, a computer, a building, or an intersection. An edge connects two nodes and can optionally be directional. Information only flows one way.
Here’s an example of a simple graph:
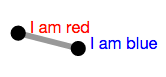
In this case, we have two nodes (Blue and Red) and one edge connecting the two. What does it look like in code? In a relational database, we would probably store the vertices of a graph in one table and the edges in a second one. Each edge would have a foreign key for its starting vertex and one for its ending vertex. To store a graph in such a database like Firebase we could, for example, store vertices in a child attribute value and store edges in another one. Each edge would have a key for its starting vertex and another one for its ending vertex.
Please note that I’m sharing my database URL. Feel free to use it while you’re learning. After that, use your own credential created on your Firebase account page.
var myFirebaseRef = new Firebase('https://graph-data.firebaseio.com');

var vertexRef = myFirebaseRef.child('vertex');

var edgeRef   = myFirebaseRef.child('edge');
var firstNode = vertexRef.child('my first node');

var secondNode = vertexRef.child('my second node');

var myLink = edgeRef.child('link from first node to second node');
firstNode.set({

  color: 'blue',

  label: 'I am blue'

});
secondNode.set({

  color: 'red',

  label: 'I am red'

});
myLink.set({

  sourceId: 'my first node',

  targetId: 'my second node'

});
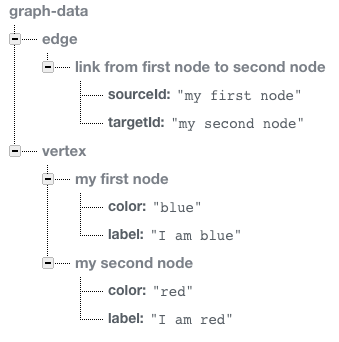
The data structure below shows how Firebase stores this data:
A Practical Example
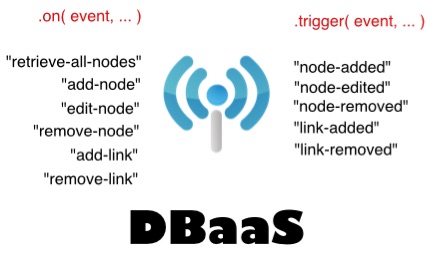
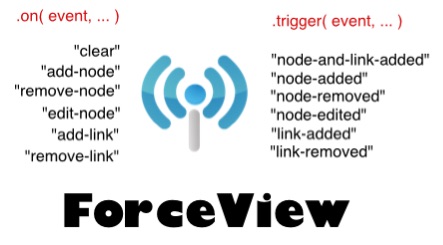
This example has two small pieces. One for drawing directed graphs and another for storing data. This first piece uses a graph visualization tool, named Force Editor, that is a graphing tool that enables the user to create a graph in a simple, intuitive, and pleasing way. The second piece uses Firebase to enable realtime, bi-directional communication between web clients.
These two small pieces communicate with each other via interfaces. Each one provides an interface that specifies which services another component can use and how they can do it. This interface is a signature that avoids knowing about the inner implementation. The goal is to avoid dependencies. Based on this, let’s take a look at the images below to see these interfaces:
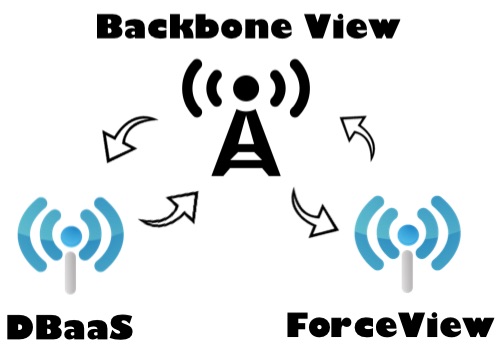
Having these two small pieces, we can easily gather them in a Backbone view. That view is a mediator between the ForceView and DBaaS.
Now we’re on the right path and we can make those small pieces work beautifully together. It deals with an encapsulated set of behaviors, with a well-known interface to access functionalities. The image below illustrates the interaction between the View and these two modules.
Running and Deploying the Example
The entire code is available on Github. You just have to clone the repository by running on the CLI:
git clone https://github.com/sitepoint-editors/graph-data-with-firebase.git
Alternatively, you can download the code as a zip file.
Then you have to execute the npm install command to install all the dependencies. Finally, execute node server.js to start the application. Once done, head to http://localhost:5000 to see it in action!
We no longer have to worry about hiring a web hosting for our application. We only need one command to initialize the app, another one for publishing changes and it’s done. Firebase hosts our application over a secure connection by default.
To deploy all the static files of the application (HTML, CSS, JavaScript, and so on) to the web, download firebase-tools via npm:
npm install -g firebase-tools
Then run the command firebase init into the project directory. By doing this, it creates a settings file in the root directory called firebase.json. Once done, we can be up and running with the command firebase deploy.
Conclusions
In this article we have deepened few topics about Firebase and taken a quick look at some of its main concepts. Then, we have re-used the Backbone example explained in a previous article to migrate the existing data storage to Firebase. I hope you enjoyed this tutorial and found it interesting and useful.
If you have questions or doubts, feel free to ask or comment in the section below.
Frequently Asked Questions (FAQs) about Graph Data with Firebase
How can I structure my data in Firebase for graphing purposes?
Structuring data in Firebase for graphing purposes requires a good understanding of how Firebase stores data. Firebase uses a NoSQL database, which means data is stored in a JSON-like format. This allows for flexibility in data structuring. However, it’s important to note that Firebase doesn’t support complex queries like SQL databases. Therefore, you should structure your data in a way that makes it easy to retrieve the specific data you need for your graphs. For instance, you can structure your data by categories or time periods. Remember, Firebase allows for nested data, but it’s recommended to flatten your data structure for efficiency.
Can Firebase support real-time graph data?
Yes, Firebase can support real-time graph data. Firebase’s real-time database allows for instant updates, which means you can create real-time graphs that update as your data changes. This is particularly useful for applications that require real-time data visualization, such as analytics dashboards or monitoring systems. To implement this, you would need to set up listeners in your application that respond to changes in your Firebase data and update your graphs accordingly.
How can I visualize my Firebase data with Chartbrew?
Chartbrew is a data visualization tool that can connect to your Firebase database and help you create interactive charts and graphs. To visualize your Firebase data with Chartbrew, you first need to connect Chartbrew to your Firebase database. This involves providing your Firebase project credentials to Chartbrew. Once connected, you can create new charts in Chartbrew and select your Firebase data as the data source. Chartbrew allows you to customize your charts with different styles and formats, and you can even create dashboards that include multiple charts.
What are the limitations of using Firebase for graph data?
While Firebase offers many benefits for graph data, such as real-time updates and flexible data structuring, it also has some limitations. One of the main limitations is that Firebase doesn’t support complex queries like SQL databases. This means that if you need to perform complex data analysis or aggregations, you may need to process your data in your application before graphing it. Additionally, Firebase’s pricing model is based on the amount of data stored and transferred, so large datasets can become costly.
How can I create a real-time graph from Firebase data using Flutter?
Creating a real-time graph from Firebase data using Flutter involves a few steps. First, you need to set up a connection between your Flutter application and your Firebase database. This involves installing the Firebase SDK and configuring your Firebase project in your Flutter application. Once connected, you can retrieve data from your Firebase database in your Flutter application. To create a real-time graph, you would need to set up listeners that respond to changes in your Firebase data and update your graph accordingly. There are several Flutter packages available for creating graphs, such as charts_flutter and fl_chart.