
Key Takeaways
- Snap.svg is a powerful tool for creating resolution-independent vector graphics, supporting advanced features like masking, clipping, and gradients, making it suitable for modern web browsers.
- The tutorial demonstrates building an infographic that represents the three layers of a web page (HTML, CSS, and JS) using Snap.svg, combining both static and interactive elements.
- Key steps include setting up the project environment, constructing various graphic elements like backgrounds, headers, and interactive components, and integrating these elements into a coherent infographic.
- Snap.svg facilitates intricate SVG manipulations such as adding filters, creating animations, and handling user interactions, enhancing the visual appeal and functionality of web graphics.
- Despite the capabilities of Snap.svg, creating complex SVG graphics from scratch requires careful planning and considerable effort, emphasizing the need for understanding both the tool and the underlying SVG concepts.

Snap SVG is the next generation and natural evolution of (Dmitry Baranovskiy‘s Raphael JS vector library.
Although there is nothing stopping you from writing raw SVG, frameworks like Snap, SVG.JS and Bonsai can help to smooth out some of the cross-platform and cross-browser issues.
In short, the Snap library wraps all the great functionality of the SVG technology, allowing us to create all kind of resolution-independent vector graphics – both static and interactive – in an easier and straightforward manner.
It is firmly orientated towards modern browsers so, in contrast to Raphael, it supports advanced features like masking, clipping, patterns, full gradients, groups, and more.
In this tutorial, we’re going to create an infographic from scratch by using much of the functionality that Snap provides.
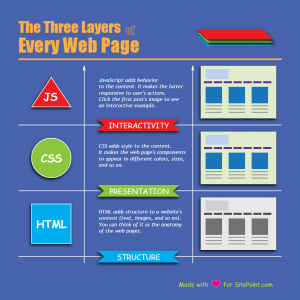
The topic that I’ve chosen is about the three layers that make up every web page (HTML, CSS, and JS). It will be mainly static infographic, but will include an animated and interactive component too.
You can see the final result in the following screenshot:
Getting Started
The first thing we need to do is to create new folder, called Snap Infographic, which will hold our project’s files.
Then, go to Snap’s home page and download the library. Open the .zip file, locate the snap.svg.js file inside the dist folder, and extract it in our project folder. Next, create new file, called infographic.html, in the same folder.
Open it, and add the following code:
<!DOCTYPE HTML>

<html>

<head>

    <meta charset="utf-8" />

    <title>Snap Infographic</title>

    <script src="snap.svg.js"></script>

</head>

<body>
<script type="text/javascript">
window.onload = function () {
    var snap = Snap(912,912);
};
</script>
</body>

</html>
Let’s see what we have here.
First, inside the head tag we add reference to the snap.svg.js file. Next, we have a script tag placed inside the body tag. Inside the script tag we create variable snap, which we’ll use as reference to the library.
This creates a SVG drawing surface with our specified dimensions.
Building the Infographic
To build the infographic we’ll proceed as follows: We’ll start by adding the first block of code after the snap variable, and then, every snippet that follows will be put below the previous.
I’m not going into too many details about every method and its parameters, because this can lead to boredom and needlessly long instructions. I’ll explain only these parts of code which are significant.
To find additional information about particular API method, consult the Snap’s documentation.
The Background
The first component which we’re going to add to our infographic is a background. For that purpose we’ll create a pattern, composed of two diagonally crossed lines, placed behind blue rectangle.
var p_line1 = snap.paper.line(0,0, 8,8).attr({stroke: '#00ADEF'});

var p_line2 = snap.paper.line(8,0, 0,8).attr({stroke: '#00ADEF'});

var p_rect = snap.paper.rect(0,0, 8,8).attr({fill: '#3A54A4', opacity: 0.9});
var pattern = snap.paper.g(p_line1, p_line2, p_rect).pattern(0,0, 8,8);
var background = snap.paper.rect(0,0, 912,912).attr({fill: pattern});
In the first three lines of code we create the elements needed for the pattern. p_line1 and p_line2 make two X-crossed lines. p_rect makes slightly transparent blue square. The next piece of code combines the pattern’s elements in a group, and creates the actual pattern from it.
Finally, we define the actual background by creating a rectangle element with the same dimensions like the drawing surface above, and fill it with the pattern we’ve just created.
The Header
Now we’re going to create the header’s section:
var headline = snap.paper.text(56,100, ['The Three Layers','of','Every Web Page']).attr({fill: '#FBAF3F', fontFamily: 'Impact'});
    headline.select('tspan:first-of-type').attr({fontSize: '2.8em'})

    headline.select('tspan:nth-of-type(2)').attr({fill: 'none', stroke: '#FBAF3F', fontSize: '2.2em', dx: '15px', dy: '5px'});

    headline.select('tspan:last-of-type').attr({fontSize: '3.6em', x: '56px', y: '160px'});
Here, the headline variable creates a text element. Usually the third parameter in the text() method is just one single string, but what we need here is an array of multiple text strings.
This is how Snap creates a separate tspan element for each string of the array.
By doing that, we gain the ability to style every text string independently. In the next three lines we use CSS selectors to select the first, second, and third parts of our headline, and to manipulate them separately.
We use dx and dy (delta x and delta y) attributes to offset the second string slightly to the right and to the bottom. The third string is positioned by using the absolute x and y attributes.
The next thing we’ll create is a set of rectangles representing the three layers of a web page.
var f_Shadow = snap.paper.filter(Snap.filter.shadow(-2, 4, 4));
var html_layer = snap.paper.rect(490,110, 200,30).attr({fill: '#00ADEF'}).transform('skewX(45)');

var css_layer = snap.paper.rect(500,100, 200,30).attr({fill: '#8CC63E', filter: f_Shadow}).transform('skewX(45)');

var js_layer = snap.paper.rect(510,90, 200,30).attr({fill: '#ED1C24', filter: f_Shadow}).transform('skewX(45)');
var underline = snap.paper.line(56,180, 856,180).attr({stroke: '#FBAF3F', strokeWidth: '5px'});
We’ll need a shadow filter to simulate cast shadow effect, so we create one in the first line of code. Next, we add three rectangles and transform them to appear as we want. Also, we put the shadow filter to the second and the third one, thus making the whole picture much more realistic.
Lastly, we add an underline to separate more clearly our header from the body’s section which we’ll create just now.
The Body
The first part of this section will be a grid which we’ll use as a container to place the main components of the infographic.
// Grid
var arrow = snap.paper.polygon([0,10, 4,10, 2,0, 0,10]).attr({fill: '#FFF'}).transform('r270');

var marker = arrow.marker(0,0, 10,10, 0,5);
var grid_hl1 = snap.paper.line(56,380, 856,380).attr({stroke: '#FFF', strokeWidth: '2px'});

var grid_hl2 = grid_hl1.clone().transform('t0,200');

var grid_hl3 = grid_hl1.clone().transform('t0,400');

var grid_vl1 = snap.paper.line(256,200, 256,800).attr({stroke: '#FFF', strokeWidth: '2px', markerStart: marker});

var grid_vl2 = grid_vl1.clone().transform('t330,0');
First we need to create a marker which we’ll need for two of the grid’s lines. We define the shape for the marker (a triangle arrow). Then, in the second line, we use it as source for the actual marker.
The next block of code creates the grid.
We add the first horizontal line, then clone it and translate its position two more times. This gives us three horizontal lines.
In the same manner we create the two vertical lines. Also, we add the marker for each one of them.
We want the marker to appear at the beginning of the lines, and for that reason we use markerStart attribute.
We put arrows to the vertical lines to serve as a cue that the infographic must be examined from the bottom to the top.
// Shapes
var html_square = snap.paper.rect(96,620, 120,120).attr({fill: '#00ADEF', stroke: '#FFF', strokeWidth: '2px', filter: f_Shadow});

var html_square_text = snap.paper.text(110,693, 'HTML').attr({fill: '#FFF', fontFamily: 'Comic Sans MS', fontSize: '2em', fontWeight: 'bold'});
var css_circle = snap.paper.circle(156,480, 60).attr({fill: '#8CC63E', stroke: '#FFF', strokeWidth: '2px', filter: f_Shadow});

var css_circle_text = snap.paper.text(124,493, 'CSS').attr({fill: '#FFF', fontFamily: 'Comic Sans MS', fontSize: '2em', fontWeight: 'bold'});
var js_triangle = snap.paper.polygon([96,325, 216,325, 156,235]).attr({fill: '#ED1C24', stroke: '#FFF', strokeWidth: '2px', filter: f_Shadow});

var js_triangle_text = snap.paper.text(132,306, 'JS').attr({fill: '#FFF', fontFamily: 'Comic Sans MS', fontSize: '2em', fontWeight: 'bold'});
Now we’ll start to populate the grid’s sells. We start with a square for our HTML layer. First, we create a square shape and add the shadow filter to it. Then, we create a text element and put it inside the shape. We finish the next shapes in the same manner.
// Ribbons & Text Areas
var html_ribbon = snap.paper.polygon([296,798, 546,798, 526,780, 546,762, 296,762, 316,780, 296,798]).attr({fill: '#00ADEF', filter: f_Shadow});

var css_ribbon = html_ribbon.clone().attr({fill: '#8CC63E'}).transform('t0,-200');

var js_ribbon = html_ribbon.clone().attr({fill: '#ED1C24'}).transform('t0,-400');
var html_ribbon_text = snap.paper.text(355,790, 'STRUCTURE').attr({fill: '#FFF', fontFamily: 'Comic Sans MS', fontSize: '1.4em'});

var css_ribbon_text = snap.paper.text(333,590, 'PRESENTATION').attr({fill: '#FFF', fontFamily: 'Comic Sans MS', fontSize: '1.4em'});

var js_ribbon_text = snap.paper.text(330,390, 'INTERACTIVITY').attr({fill: '#FFF', fontFamily: 'Comic Sans MS', fontSize: '1.4em'});
We move on to the second column. First, we create a ribbon by using the .polygon() method and add the shadow filter again.
Then, we clone the ribbon and translate it two more times, which results in three ribbons, one for each layer. Next we need to add titles to the ribbons. We do that by creating three text elements and positioning them at the right place.
var html_textarea = snap.paper.text(300,630, ['HTML adds structure to a website\'s', 'content (text, images, and so on).', 'You can think of it as the anatomy', 'of the web pages.']).attr({fill: '#FFF', fontFamily: 'Trebuchet MS', fontStyle: 'italic'});

var css_textarea = snap.paper.text(300,430, ['CSS adds style to the content.', 'It makes the web page\'s components', 'to appear in different colors, sizes,', 'and so on.']).attr({fill: '#FFF', fontFamily: 'Trebuchet MS', fontStyle: 'italic'});

var js_textarea = snap.paper.text(300,230, ['JavaScript adds behavior', 'to the content. It makes the latter', 'responsive to user\'s actions.', 'Click the first post\'s image to see', 'an interactive example.']).attr({fill: '#FFF', fontFamily: 'Trebuchet MS', fontStyle: 'italic'});
var textareas = [html_textarea, css_textarea, js_textarea];
for (var i = 0; i < textareas.length; i++) {
    textareas[i].selectAll('tspan').attr({x: '300px', dy: '1.2em'});
};
At this point we need to put an explanation about what each layer is responsible for and what it does.
So, we create three text elements with multiple strings. We need every string to appear at individual line.
For that reason we put the elements in an array and then use a for loop to iterate over them. What the loop does is to select all tspan elements from each text element and to make its x attribute equals to 300px, and also to offset each string vertically by 1.2em.
The net result is that all strings you put in a particular text element are properly positioned – all are left aligned, each one appears on individual line, and the space between lines is adjusted properly.
// Wireframes
var page = snap.paper.rect(610,400, 230,160).attr({fill: '#DFEDCC', filter: f_Shadow});

var logo = snap.paper.rect(625,410, 70,30).attr({fill: '#BDD1EC'});

var nav = snap.paper.line(620,450, 830,450).attr({stroke: '#652C90', strokeWidth: '6px', strokeDasharray: '25 5'});
var post_img = snap.paper.rect(625,464, 50,50).attr({fill: '#1B75BB'});

var post_txt = snap.paper.line(650,520, 650,550).attr({stroke: '#939597', strokeWidth: '50px', strokeDasharray: '3 7'});
var post = snap.paper.g(post_img, post_txt);

var post_2 = post.clone().transform('t70,0');

var post_3 = post.clone().transform('t140,0');
In the third column we’ll place miniature web page wireframes whose purpose is to illustrate the explanations in the second column.
First, we create a new rectangle for the web page and add the shadow filter to it. Then, we create another rectangle for the logo. For the navigation we use a thick dashed line.
Next, we create the elements needed for our posts (post_img and post_txt). Then, we create the first post by grouping the above elements. The other two posts we create by cloning the first one and translate it to the right.
Now we have the prototype necessary for our wireframes.
var f_Saturate = snap.paper.filter(Snap.filter.saturate(1));
var css_wireframe = snap.paper.g(page, logo, nav, post, post_2, post_3);

var html_wireframe = css_wireframe.clone().transform('t0,200').attr({filter: f_Saturate});

var js_wireframe = css_wireframe.clone().transform('t0,-200');
At this point we’ll need another filter, which we create in the first line. Then, we use the wireframe’s elements we’ve just created above to create the first wireframe.
Next, we create the second wireframe by cloning the first one, and add the saturate filter to it. The last desaturate the colors in order to show that HTML is only the structure without any styles. And finally, we create the third wireframe in similar manner.
var panel = snap.paper.rect(650,200, 150,100, 3,3).attr({fill: '#1C98BA'});
var circle = snap.paper.circle(800,200, 10).attr({fill: '#1B75BB', stroke: '#DFEDCC', strokeWidth: '2px'});

var close_icon = snap.paper.text(796,204, 'x').attr({fill: '#FFF', fontFamily: 'Verdana'});

var close_button = snap.paper.g(circle, close_icon);
var lightbox = snap.paper.g(panel, close_button).attr({opacity: 0}).insertBefore(js_wireframe);
What we want to create here is an image lightbox. So, we start with a rectangle with rounded corners. Then, we create a circle shape and a “X” text which we use to create a close button by grouping them.
Finally, we finish the lightbox by combining the panel and the close button in a group, and make it initially invisible. Also, we put it behind the js_wireframe because otherwise it will hinder people to click on the post.
var ipost = js_wireframe.select('g:first-of-type>rect').attr({fill: '#1B75BB'})

                        .mouseover(function(){

                            this.attr({fill: '#003EBA', cursor: 'pointer'});

                        })

                        .mouseout(function(){

                            this.attr({fill: '#1B75BB'});

                        });
ipost.click(function(){
    lightbox.animate({transform: 't0,30', opacity: 1}, 400)

            .insertAfter(js_wireframe);
});
It’s time to make things interactive. For that purpose we select the image (actually, the blue square) from the first post, and force it to change its color when is hovered.
Then, we add click event listener, which purpose is to show up the lightbox when the first post’s image is clicked.
close_button.mouseover(function(){
    this.attr({cursor: 'pointer'});
}).click(function(){
    lightbox.animate({transform: 't0,0', opacity: 0}, 400, function(){
        lightbox.insertBefore(js_wireframe);
    });
});
In the above code we make the cursor to appear like pointer when the close button is mouseovered; and when is clicked, the lightbox moves to its original position and fades out.
We also add a callback function to the animate() method which put the lightbox behind the js_wireframe after the animation ends.
The Footer
Our last task is to add some text in the footer. But first we need to add the following snippet below the script tag (I repeat: below the script tag):
<!-- SVG Heart Shape -->
<svg version="1.1" id="heart" xmlns="https://www.w3.org/2000/svg" xmlns:xlink="https://www.w3.org/1999/xlink" x="0px" y="0px"

     width="24px" height="24px" viewBox="0 0 24 24" enable-background="new 0 0 24 24" xml:space="preserve">

<path fill-rule="evenodd" clip-rule="evenodd" fill="none" d="M11.995,6.243C8.888-2.079,0.057-0.138-0.001,9.521

    c-0.032,5.305,4.205,7.288,7.026,9.408c2.736,2.057,4.683,4.87,4.988,6.068c0.261-1.173,2.43-4.066,4.962-6.125

    c2.769-2.251,7.059-4.104,7.026-9.408C23.943-0.219,14.958-1.748,11.995,6.243z"/>

</svg>
This is the code that I get from an SVG file created with Adobe Illustrator.
var footer_text = snap.paper.text(543,872, ['Made with','for SitePoint.com']).attr({fill: '#B5DD25', fontFamily: 'Comic Sans MS', fontSize: '1.2em'});

    footer_text.select('tspan:nth-child(2)').attr({dx: '45px'});
Snap.select('#heart').appendTo(snap);

Snap.select('path').attr({fill: '#EC008B', stroke: '#FFF'}).transform('t645,850').insertAfter(background);
Back inside the script tag, we create a text element which consists of two strings, and then offset the second string with 45px by using dx attribute.
As you may noticed already our infographic is slightly shifted at right because of the SVG code that we’ve just added.
Don’t worry. We’ll fix that in a minute.
First, we select the SVG fragment code by using its id attribute, and append it to the drawing surface. Then, we select the heart’s path, make its stroke white, and fill it with nice pink color.
Also we change its position in order to appear between the two strings, and insert it after the background to make it visible.
OK. Now everything should be fine.
Here is a working Codepen of our Snap Infographic in action.
See the Pen Snap.svg Example by SitePoint (@SitePoint) on CodePen.
Summary
As a summary, I have to say that, even with a powerful library like Snap, building an entire SVG graphic from scratch is not as easy as we may wish.
We still need lots of planning and math calculations to get the right result, which is a bit tedious and time consuming.
Of course, Snap allows us to use and manipulate an existing SVG document (created with Illustrator, or Inkscape), but this is out of the scope of this tutorial.
Regardless, I think that the final outcome definitely bears out our efforts.