I’m delighted to announce the release of Version 1.6 of CodeBurner — our popular reference tool for web developers. This new release is a major update to all five versions, and has something new or improved for everyone!
It’s taken a little longer than planned, and that’s mostly because of the extent of the changes required for Firefox 4; which in turn meant changes to Firebug, and all of that was rather time-consuming to implement [always excuses, eh!]
But we’ve waited until all five versions were ready, before releasing them, so that everyone would be on the same version and the same updates schedule. All users are encouraged to upgrade and take advantage of the many new features and improvements.
What’s New in Version 1.6
The most important change for all versions is updated browser-compatibility information, with the latest data from the SitePoint Reference. The results now include support for Google Chrome, as well as the latest common versions of Firefox, Safari, Opera and IE:
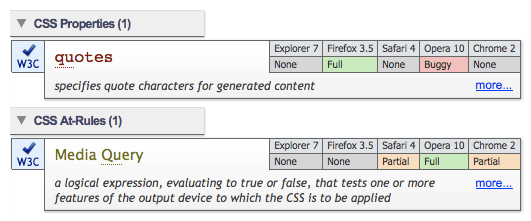
A sample of results from CodeBurner’s main search interface.
All the latest browsers
This version of CodeBurner also extends its own browser/environment support:
 For the Firebug extension
- to Firefox 4.0.x and Firebug 1.7.0
 For the Firefox add-on
- to Firefox 4.0.x or Flock 2.6.x
 For the Opera widget
- to Opera 11.x
 For the Mac OS X Dashboard widget
- to Mac OS X 10.6
 For the Adobe AIR application
- Adobe AIR 2.5
Better CSS inspection
Another new feature for all five versions is the addition of at-rules to special search. “Special search” gives you information about all the attributes, properties, selectors and now at-rules that apply to a selected element, when inspecting the DOM of a page (from the HTML panel in Firebug, or the DOM tab in other versions):
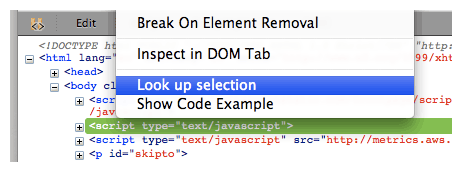
Special search for the selected-element in Firebug’s HTML panel.
For Opera, Dashboard and AIR, this is made possible by an update to the bundled version of CSSUtilties, which provides more comprehensive and accurate data in the CSS view. The CSSUtilities library is what powers the CSS view, displaying information about stylesheets, their rules and properties, and how they apply to the DOM view elements:
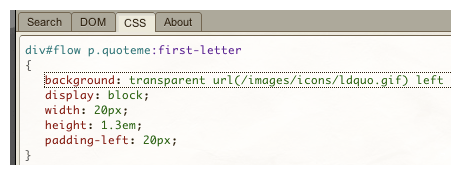
The CSS view in CodeBurner for Dashboard.
And a bunch of other stuff!
By popular request, for the Opera and Dashboard widgets, the widget window is now resizable and remember the size you set between sessions.
And finally, as you might expect, there’s a whole bunch of minor updates, bug-fixes and tweaks, for various platforms. Too many to list here, but to give a few examples:
- For the Firebug extension, fixed a layout bug when viewing the reference panel with the code-example side-panel closed, that would sometimes collapse the results-table beneath the search form → more
- For the Firefox add-on, fixed a bug in special search, where selectors from the system stylesheet were included in the list of “selectors that apply to this element” → more
- For the Opera widget, fixed a rendering glitch with search-area checkboxes in Windows, so you can see more clearly whether they’re checked or not → more
- For the Mac OS X Dashboard widget, improvements to the layout of the results tables, eg. the titles and summaries have more space and are easier to read → more
- For the Adobe AIR application, improvements to the layout of the “About” pane, eg. you can see at a glance which version of the application you’re running → more
What do you think?
Here at CodeBurner HQ we’re keen to hear your feedback! Are there any new features you’d like to see? Are there existing features you could do without, or that you’d like more control over? We want to make CodeBurner the best possible reference tool it can be — so please do let us know what we can do to improve it.
Frequently Asked Questions about CodeBurner and Web Development Tools
What is CodeBurner and how does it differ from other web development tools?
CodeBurner is a unique web development tool that provides a searchable reference for HTML and CSS, integrated with a range of tools like a DOM Inspector and JavaScript command line. Unlike other tools, CodeBurner focuses on providing a comprehensive reference guide, making it a valuable resource for both beginners and experienced developers.
How can I install CodeBurner on my browser?
CodeBurner is available as an extension for Firefox and as a plug-in for Firebug. You can download it from the official website or from the browser’s extension store. Follow the prompts to install it and restart your browser to start using CodeBurner.
Can I use CodeBurner with Firebug?
Yes, CodeBurner can be used as a standalone tool or in conjunction with Firebug. When used with Firebug, it provides an integrated development environment, enhancing the functionality of both tools.
What features does CodeBurner offer?
CodeBurner offers a range of features including a searchable HTML and CSS reference, a DOM Inspector, a JavaScript command line, and a resource panel. These features are designed to help developers write, debug, and optimize their code.
How does CodeBurner compare to Firebug?
While both CodeBurner and Firebug are powerful web development tools, they serve different purposes. Firebug is primarily a debugging tool, while CodeBurner is a reference tool. However, when used together, they provide a comprehensive development environment.
Is CodeBurner compatible with other browsers?
Currently, CodeBurner is only available for Firefox. However, the developers are working on versions for other browsers. Stay tuned for updates.
How can I use the DOM Inspector in CodeBurner?
The DOM Inspector in CodeBurner allows you to inspect and modify the DOM in real-time. Simply select an element in the DOM panel to view its properties and modify them as needed.
Can I use CodeBurner for JavaScript development?
Yes, CodeBurner includes a JavaScript command line that allows you to execute JavaScript commands in real-time. This is a powerful tool for testing and debugging your JavaScript code.
How can I access the HTML and CSS reference in CodeBurner?
The HTML and CSS reference in CodeBurner is accessible from the main panel. You can search for specific elements or properties, or browse the reference to learn more about HTML and CSS.
Is CodeBurner a free tool?
Yes, CodeBurner is a free tool. It is developed and maintained by a community of developers who are passionate about making web development easier and more accessible for everyone.
James is a freelance web developer based in the UK, specialising in JavaScript application development and building accessible websites. With more than a decade's professional experience, he is a published author, a frequent blogger and speaker, and an outspoken advocate of standards-based development.