
Sass is a very powerful tool and many of us are still examining it’s limits. What can we do with it and how far can we push it?
After throwing ideas at Hugo Giraudel, I got myself very excited about one idea; a 2D graphics engine. This may be confusing, because CSS and thus Sass is already part of the realm of graphics. Instead of styling content, I wanted to (ab)use Sass to render an image, pixel by pixel. The output can be drawn as a box-shadow value on a 1×1 pixel element.
Key Takeaways
- Sass can be used to create a 2D graphics engine, rendering an image pixel by pixel, which can be drawn as a box-shadow value on a 1×1 pixel element. This is achieved by defining a path, creating a bounding box of the path, iterating over the y-axis of the bounding box, getting intersections of all lines within the path, sorting intersections by x coordinate, iterating through intersections, drawing until the next for every odd intersection, and outputting the result.
- Although this method of rendering vector paths in Sass is not very performant and can take several minutes to render basic objects, it demonstrates the power and flexibility of Sass. For more efficient rendering of vector paths, it’s recommended to stick to SVG, the Canvas element, or even WebGL, which do the rasterizing for you and offer better performance.
- Sass provides several benefits when working with vector graphics. It allows for the use of variables to define and manipulate properties of graphics, supports nesting to simplify code, and includes built-in functions for manipulating colors and other values. However, for truly complex graphics, a dedicated vector graphics tool or library may be needed.
Examining strategies
One way is to iterate through a grid and a list of objects, and check if a pixel should be drawn. Sass would have to process n x width x height iterations, where n is the amount of objects. That is a lot of work so not very performant, especially considering loops in Sass aren’t fast. Instead of rendering the entire grid, it is possible to render only parts that may contain an object by getting a so called bounding box. Check out the demo.
A better option is to use paths.
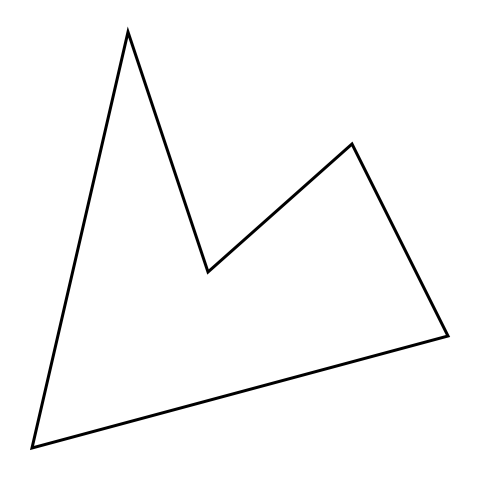
Paths may sound familiar to you. It is a common term in graphics software like Adobe Illustrator and Adobe Photoshop, but the term occurs in web technologies like SVG and HTML5 too. A path is a list of coordinates that are connected in sequence. All I need to define a shape is a couple of coordinates. If you are familiar with paths, you probably know you can make curved paths as well. For now, I will stick to straight lines.
The process of converting a vector path to pixels – or in our case a vector path to a box-shadow – is called rasterizing.
Scanline algorithm
Paths are often rendered using the scanline algorithm. Personally, whenever I hear the word “algorithm” I panic and execute whatever exit strategy I have at hand. This algorithm however is surprisingly comprehensible, so don’t be scared just yet!
We iterate through the vertical pixels. For every row, we store the intersections of all lines of that path. After iterating through all lines, we sort and iterate through the intersections from left to right. At every intersection, we toggle drawing.
Sass implementation
Before rendering anything, it is useful to know what to render. We have to define a path. I think a list of coordinates is a pretty good set-up:
$square: (

  (0, 0), (64, 0),

  (64, 64), (0, 64)

);
These can easily be scaled and translated (moved):
@function scale($path, $scale) {

  @for $n from 1 through length($path) {

    $coords: nth($path, $n);
    $path: set-nth($path, $n, (

      nth($coords, 1) * $scale,

      nth($coords, 2) * $scale

    ));

  }
  @return $path;

}
@function translate($path, $x, $y) {

  @for $n from 1 through length($path) {

    $coords: nth($path, $n);
    $path: set-nth($path, $n, (

      nth($coords, 1) + $x,

      nth($coords, 2) + $y

    ));

  }
  @return $path;

}
To render a specific color, we may want to pass a color to the function that will output a list of box-shadows, like so:
$shadows: ();
// Append more shadows

$shadows: render($shadows, $square, #f00);
In our render() function, we have to list new shadows and return them. This is the outline of render():
@function render($list, $path, $color) {

  // List to store shadows

  $shadows: ();
  // Do a lot of thinking
  @if length($shadows) > 0 {

    @return append($list, $shadows, comma);

  }
  @return $shadows;

}
To calculate the area we have to draw, we can iterate through all coordinates in the path, and store the minimum and maximum value on the y-axis. This way we know where to start and stop drawing on the y-axis. Knowing what to render on the x-axis will be calculated using the lines of the path, which will be covered shortly.
// Initial values

$top: null;

$bottom: null;
@each $coord in $path {

    $y: nth($coord, 2);
    // @if $top is still null, let's set current value

    // @else get the smaller value between previous y and current y

    @if $top == null { $top: $y; }

    @else { $top: min($y, $top); }
    // Same thing for the bottom, but get the largest value instead

    @if $bottom == null { $bottom: $y; }

    @else { $bottom: max($y, $bottom); }

}
Knowing the vertical boundary of a path, we can iterate through the rows, and use this to calculate intersections of the lines of the path. The intersections are then sorted to make sure the drawing is done right. We will go over the drawing logic later.
// If there is something to draw at all

@if $bottom - $top > 0 {

  // Iterate through rows

  @for $y from $top through $bottom {

    // Get intersections

    $intersections: intersections($path, $y);
    @if type-of($intersections) == 'list' and length($intersections) > 0 {

        $intersections: quick-sort($intersections, 'compare');
        // Drawing logic

      }

    }

  }

}
The function intersections($path, $y) is the function used to get the intersections of a path at a specific y coordinate. The outline is fairly simple. We iterate through the path, and for every line we search intersections. Finally, we return a list of those intersections.
@function intersections($path, $y) {

  $intersections: ();

  $length: length($path);
  // Iterate through path

  @for $n from 1 through $length {

    // Intersection algorithm here

  }
  @return $intersections;

}
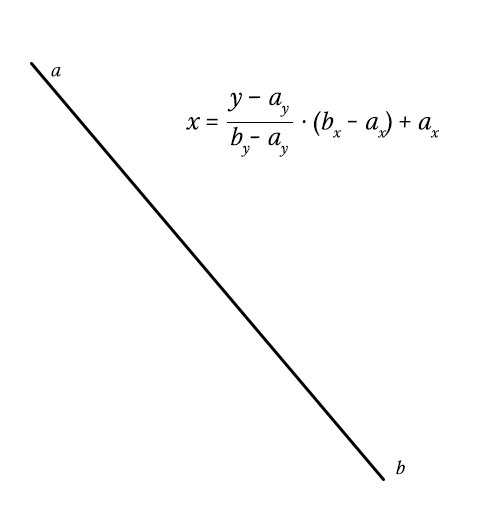
Time for a Sass-pause. Getting the intersection of a line is tricky. By getting the height of the line (by – ay), we can determine the progress of y over the height (y – ay / height). This should be a number between or equal to 0 and 1. If not, y does not intersect with the line at all.
Because the lines are linear, we can multiply this number with the line’s width (bx – ax), so we get the x coordinate relative of the line’s position. All that is left is add the horizontal position of the line (… + ax), and we have our final x coordinate!
Back to Sass. Let’s implement the above:
// Get current and next point in this path, which makes a line

$a: nth($path, $n);

$b: nth($path, ($n % $length) + 1);
// Get boundaries of this line

$top: min(nth($a, 2), nth($b, 2));

$bottom: max(nth($a, 2), nth($b, 2));
// Get size of the line

$height: nth($b, 2) - nth($a, 2);

$width: nth($b, 1) - nth($a, 1);
// Is line within boundaries?

@if $y >= $top and $y <= $bottom and $height != 0 {

  // Get intersection at $y and add it to the list

  $x: ($y - nth($a, 2)) / $height * $width + nth($a, 1);

  $intersections: append($intersections, $x);

}
As for the drawing logic, we can look at the first animation that demonstrates the scanline algorithm. As you can see, it draws intersection 1 to 2, 3 to 4, etc.
For every intersection, we toggle drawing. Then, we simply fill the pixels into $shadows.
// Boolean to decide whether to draw or not

$draw: false;
// Iterate through intersections

@for $n from 1 through length($intersections) {

  // To draw or not to draw?

  $draw: not $draw;
  // Should we draw?

  @if $draw {

    // Get current and next intersection

    $current: nth($intersections, $n);

    $next: nth($intersections, $n + 1);
    // Get x coordinates of our intersections

    $from: round($current);

    $to: round($next);
    // Draw the line between the x coordinates

    @for $x from $from through $to {

      $value: ($x + 0px) ($y + 0px) $color;

      $shadows: append($shadows, $value, comma);

    }

  }

}
Conclusion
Let’s glimpse back at what the hell just happened:
- Define a path
- Create bounding box of path
- Iterate over y-axis of bounding box
- Get intersections of all lines within a path
- Sort intersections by x coordinate
- Iterate through intersections
- For every odd intersection, draw until the next
- Output magic
See the demo (and complete code)
So, is any of this useful? Not remotely. Performance is really, really bad. Drawing some basic objects takes several minutes to render. LibSass however makes it less painful, perhaps even bearable. But who are we kidding, right? If you intend to render vector paths, stick to SVG or the Canvas element or even WebGL. All of these do the rasterizing for you, and you get much more options and way better performance.
What this does prove however, is that Sass is pretty powerful, and we can do crazy funky things with it. Any application that can be written in Sass, will eventually be written in Sass.
Frequently Asked Questions about Vector Graphics with SASS
What are the benefits of using SASS for vector graphics?
SASS, or Syntactically Awesome Style Sheets, is a powerful tool for managing CSS in a more efficient and organized manner. When it comes to vector graphics, SASS provides several benefits. Firstly, it allows for the use of variables, which can be used to define and manipulate colors, sizes, and other properties of your graphics. Secondly, SASS supports nesting, which can simplify your code and make it easier to read and maintain. Lastly, SASS includes built-in functions for manipulating colors and other values, which can be incredibly useful when working with complex graphics.
How can I create a basic shape using SASS?
Creating a basic shape using SASS involves defining the shape’s properties in your SASS file. For example, to create a square, you might use the following code:.square {
width: 100px;
height: 100px;
background-color: blue;}
This code defines a class called “square” with a width and height of 100 pixels and a background color of blue. You can then apply this class to any element in your HTML to create a blue square.
How can I use variables in SASS to manipulate my vector graphics?
Variables in SASS are defined using the `= symbol, followed by the variable name and value. For example, you might define a variable for a color like so:$blue: #0000FF;
You can then use this variable anywhere in your SASS file where you would normally use a color value. This can be incredibly useful for maintaining consistency across your graphics, as you can change the color in one place and have it update everywhere.
What is nesting in SASS and how can it be used with vector graphics?
Nesting in SASS allows you to define styles in a hierarchical manner, similar to how HTML is structured. This can make your code easier to read and maintain, as it clearly shows the relationship between different elements. When working with vector graphics, nesting can be used to define styles for different parts of the graphic. For example, you might define styles for the outer edge and inner fill of a shape separately, but nest them within the same parent style to show their relationship.
How can I use SASS functions to manipulate colors in my vector graphics?
SASS includes a number of built-in functions for manipulating colors. These include lighten(), darken(), saturate(), and desaturate(), among others. These functions take a color value and a percentage as arguments, and return a new color value. For example, to lighten a color by 20%, you might use the following code:$light-blue: lighten($blue, 20%);
This code takes the color stored in the $blue variable, lightens it by 20%, and stores the result in a new variable called $light-blue. You can then use this variable anywhere in your SASS file where you would normally use a color value.
Can I use SASS to create complex shapes and patterns?
Yes, SASS can be used to create complex shapes and patterns by combining basic shapes and using variables and functions to manipulate their properties. However, keep in mind that SASS is a preprocessor for CSS, and is subject to the same limitations. For truly complex graphics, you may need to use a dedicated vector graphics tool or library.
How can I animate my vector graphics using SASS?
SASS supports all the same animation properties as CSS, so you can use it to create animations for your vector graphics. This involves defining keyframes for your animation, and then applying the animation to your graphic using the animation property. You can also use variables and functions to manipulate the properties of your animation, just like with static graphics.
Can I use SASS with SVG files?
Yes, you can use SASS to style SVG files, just like any other HTML element. This involves linking your SASS file to your HTML file, and then using selectors to target the SVG elements you want to style. You can then use all the same properties, variables, and functions as with regular CSS.
How can I use SASS to create responsive vector graphics?
Creating responsive vector graphics with SASS involves using media queries to adjust the properties of your graphics based on the size of the viewport. You can use variables to define breakpoints for your media queries, and then use these variables in your media query definitions. This allows you to maintain consistency across your responsive styles, and makes it easier to update your breakpoints in the future.
What are some best practices for using SASS with vector graphics?
Some best practices for using SASS with vector graphics include: using variables to maintain consistency across your graphics; using nesting to clearly show the relationship between different elements; using functions to manipulate colors and other values; keeping your code DRY (Don’t Repeat Yourself) by reusing styles and properties wherever possible; and organizing your code in a logical and readable manner.