

Although SVG has been around for a while, its adoption as part of HTML5 has given it new life. To celebrate that fact, this series of walkthroughs has explored what would happen if the dead got new life as well, by building a Zombie Apocalypse Survival Predictor created almost entirely from SVG and JavaScript.
In Part 3 of this series, the screaming human at the center of this predictor was surrounded by danger on all sides. JavaScript was used for the first time to manipulate both Core DOM and SVG DOM, adding dozens of new zombies and then flipping them using the “transform” attribute.
In this, the final part of the series, JavaScript will again be used, this time to throw the human a tether of hope in the form of shopping malls and rednecks. Will it be enough? Stay tuned until the end, when JavaScript is also used to calculate the human’s odds of survival and then to set the prediction meter by sniffing the browser’s actual SVG capabilities and acting accordingly.
Note: This walkthrough builds on the completed code of Part 3 of this series, which can be found as the source behind http://justinwhitney.com/zombies/zombies_part3.htm.
Key Takeaways
- Dynamic SVG Integration: Emphasizes the revitalized use of SVG in web design through HTML5, enhancing interactive and dynamic graphical content.
- JavaScript Manipulation: Highlights the use of JavaScript to dynamically control SVG elements, demonstrating advanced techniques like creating and manipulating zombies, malls, and rednecks within a fictional survival scenario.
- Interactive Control Panel: Describes the development of an interactive control panel that allows users to modify the SVG environment, impacting the survival odds against a zombie apocalypse.
- Odds Calculation: Introduces a JavaScript function to calculate survival odds based on various dynamic factors such as the number of zombies, rednecks, and malls within the environment.
- Animation Techniques: Explores SVG path animation and the use of JavaScript to animate elements like the survival odds pointer, enhancing user interaction and visual feedback.
- Cross-Browser Compatibility: Discusses the importance of testing SVG features across different browsers to ensure consistent functionality, using tools like BrowserStack for effective cross-browser testing.
Adding More SVG Elements
Part 3 of this series showed how to animate one out of six of the increment/decrement controls of the Control Panel canvas: the More Zombies control. That won’t do at all. The Population control needs Less Zombies as well. But before we do that, the other SVG images need to be added. The human needs some protection.
Start with the shopping malls. For simplicity, assume this city has a maximum of four malls, which will be placed in the four corners. Because the mall count needs to be tracked, add a global array for malls at the top of the <script> section:
<script>
var malls = new Array();
…
The newMall code will set the x,y coordinates for the new SVG element based on the number of malls in the array, adjusting for 100×100 dimensions of the mall image itself. The rest of the code is essentially the same as the newZombie code with the addition that the new SVG element will be pushed to the array for tracking purposes:
function newMall(){
  if (malls.length < 4) {
    var svg = document.createElementNS("https://www.w3.org/2000/svg","image");
    svg.setAttributeNS('https://www.w3.org/1999/xlink','href','building.svg');
    svg.setAttribute('width','471');
    svg.setAttribute('height','303');
    var scale = .21;
    var x = 0;
    var y = 0;
    var thisMall = malls.length;
    if (thisMall == 0 || thisMall == 2) {
      x = 20;
    } else {
      x = 480;
    }
    if (thisMall == 0 || thisMall == 1) {
      y = 10;
    } else {
      y = 300;
    }
    malls.push(svg);
    svg.setAttribute('transform','translate(' + (x) + ', ' + (y) + ') scale(' + scale + ', ' + scale + ')');
    document.getElementById('cityBox').appendChild(svg);
  }
}
Finally, add the mouse event to the mall increment button, which is the <path> element with the ID “mallMore”:
<path id="mallMore" d="M 300 150 l -50 -25 l 0 50 l 50 -25" stroke="black" stroke-width="1" fill="red" onmouseup="newMall();" />The result, with malls maxed out (and no zombies), should look like Figure 1.
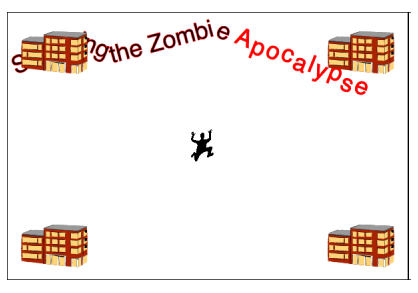
Figure 1. Dynamically Added SVG Mall <image> Elements
While zombie rednecks are the worst (especially pain-cult zombie redneck families), a healthy redneck, armed with bow and arrow, can help one survive a veritable onslaught of the walking, or running, dead. Dynamically adding them to the city looks just like adding zombies or malls. But in this case, the rednecks will be placed inside the safe zone. For an added bonus, they’ll be flipped to face outward.
function newRedneck(){
  var svg = document.createElementNS("https://www.w3.org/2000/svg","image");
  svg.setAttributeNS('https://www.w3.org/1999/xlink','href','redneck.svg');
  svg.setAttribute('width','375');
  svg.setAttribute('height','950');
  scale = .07;
  var cityWidth = 600;
  var cityHeight = 400;
  var safezoneWidth = 200;
  var safezoneHeight = 200;
  var safezoneX = Math.round((cityWidth - safezoneWidth) / 2, 0);
  var safezoneY = Math.round((cityHeight - safezoneHeight) / 2, 0);
  var x = Math.floor(Math.random()*(safezoneWidth)) + safezoneX;
  var y = Math.floor(Math.random()*(safezoneHeight-100)) + safezoneY;


  flip = (x > (cityWidth / 2)) ? 1 : -1; //flip rednecks left of center
  svg.setAttribute('transform','translate(' + (x) + ', ' + (y) + ') scale(' + (flip * scale) + ', ' + scale + ')');
  document.getElementById('cityBox').appendChild(svg);
}
Add the call to this function to the <path> element with the ID “redneckMore”:
<path id="redneckMore" d="M 300 250 l -50 -25 l 0 50 l 50 -25" stroke="black" stroke-width="1" fill="red" onmouseup="newRedneck();" />A quick test should produce a screamy human safely nestled within a raft of rednecks, as shown in Figure 2.
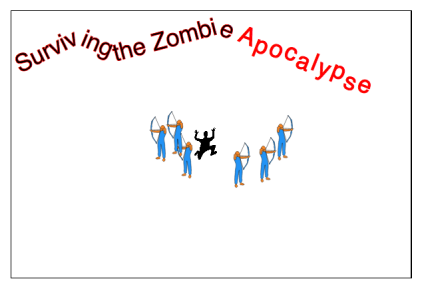
Figure 2. Dynamically Added Zombie Defense Team
With all three elements in play, the city (Figure 3) has now come to life, or not.
Figure 3. Vision of the Future, Courtesy of JavaScript and SVG
Finishing Out the Control Panel
So far, so good. But to complete the Control Panel, three things need to happen:
- Decrement buttons should be enabled
- Text should be updated
- Parameters should have upper and lower limits
The best way to accomplish all three objectives at once is to add a fourth function to handle all button responses and calls to the three creation functions. This script will be called tickSVG.
The newMall routine was a step in the right direction in terms of controlling the SVG population, so use that as a model. First, add global arrays for zombies and rednecks as well:
<script>
  var zombies = new Array();
  var malls = new Array();
  var rednecks = new Array();
…
Next, rather than adding elements to the DOM directly, each of the creation functions needs to return the new SVG element. So for each of the three functions, end with:
//document.getElementById('cityBox').appendChild(svg);
return svg;
Also, in newMall, remove the following line:
malls.push(svg);The tickSVG function itself will manage the SVG <image> population based on parameters that are passed by the buttons. First the function updates the relevant <text> element with the new total. Second, based on max and min limits and current array size, tickSVG either creates a new <image> element or grabs the top element off an array stack, depending on which button was pushed. Last, it either pushes the new <image> element onto the array and adds it to the DOM, as was originally done in the newMall routine, or it pops it off the array and removes it from the DOM (note the use of the removeChild method).
function tickSVG(textName, increment, min, max) {
  var textElement = document.getElementById(textName);
  var currentValue = parseInt(textElement.textContent);
  currentValue += increment;
  if ( (currentValue <= max) && (currentValue >= min) ) {
    textElement.textContent = currentValue;
    isMore = (increment == Math.abs(increment));
    switch (textName) {
      case 'zombieText':
        var svgArray = zombies;
        var newSVG = (isMore ? newZombie() : svgArray[svgArray.length - 1]);
        break;
      case 'redneckText':
        var svgArray = rednecks;
        var newSVG = (isMore ? newRedneck() : svgArray[svgArray.length - 1]);
        break;
      case 'mallText':
        var svgArray = malls;
        var newSVG = (isMore ? newMall() : svgArray[svgArray.length - 1]);
        break;
    }
    if (isMore) {
      svgArray.push(newSVG);
      document.getElementById('cityBox').appendChild(newSVG);
    } else {
      document.getElementById('cityBox').removeChild(newSVG);
      svgArray.pop(svgArray.length - 1);
    }
  }
}
As a last thing, all the buttons need new onmouseup calls. Find each of the following paths and either replace the existing onmouseup call or add the new one. These calls to tickSVG include references to the <text> elements created in earlier steps, as well as somewhat arbitrary max and min values, with the exception of the malls, which were designed for a maximum of four.
<path id="zombieLess" d="M 50 50 l 50 -25 l 0 50 l -50 -25" stroke="black" stroke-width="1" fill="red" onmouseup="tickSVG('zombieText',-100,0,3000);" />
<path id="zombieMore" d="M 300 50 l -50 -25 l 0 50 l 50 -25" stroke="black" stroke-width="1" fill="red" onmouseup="tickSVG('zombieText',100,0,3000);" />
<path id="mallLess" d="M 50 150 l 50 -25 l 0 50 l -50 -25" stroke="black" stroke-width="1" fill="red" onmouseup="tickSVG('mallText',-1,0,4);" />
<path id="mallMore" d="M 300 150 l -50 -25 l 0 50 l 50 -25" stroke="black" stroke-width="1" fill="red" onmouseup="tickSVG('mallText',1,0,4);" />
<path id="redneckLess" d="M 50 250 l 50 -25 l 0 50 l -50 -25" stroke="black" stroke-width="1" fill="red" onmouseup="tickSVG('redneckText',-1,0,10);" />
<path id="redneckMore" d="M 300 250 l -50 -25 l 0 50 l 50 -25" stroke="black" stroke-width="1" fill="red" onmouseup="tickSVG('redneckText',1,0,10);" />
The fully revised code is linked at the end of this walkthrough. If it works correctly, the page should look something like Figure 4.
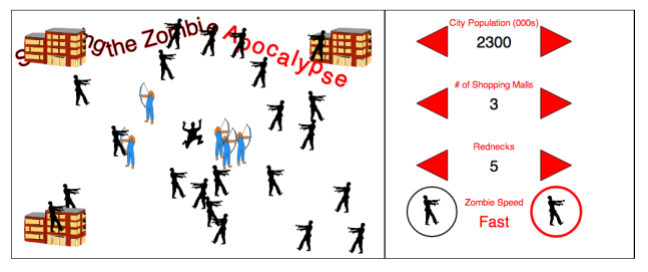
Figure 4. Fully Implemented Control Panel, aka The Apocalypse Is Nigh
What Are the Odds?
The Zombie Apocalypse Survival Predictor needs one more piece to be complete. That Odds calculator needs to move. At the very least, it needs some DOM-manipulating JavaScript to update the 0% at the top and the position of the arrow. But for compliant browsers, JavaScript can add some extra special sauce to one of the animation techniques introduced in Part 2 of this series by making the arrow move along a dynamically generated path.
But first, some calculations. Add a new global variable at the top of the <script> section called currentOdds and set it to 0:
<script>
  var zombies = new Array();
  var malls = new Array();
  var rednecks = new Array();
  var currentOdds = 0;
…
Next, create a new function called calcOdds. After exhaustive research using rigorous methodology, the following formula has been carefully crafted to predict one’s survival during a zombie apocalypse:
function calcOdds() {
  var zombieCount = parseInt(document.getElementById('zombieText').textContent);
  if (zombieCount == 0) {
    currentOdds = 100;
  } else {
    var redneckCount = parseInt(document.getElementById('redneckText').textContent);
    var mallCount = parseInt(document.getElementById('mallText').textContent);
    var speed = document.getElementById('speedText').textContent;
    var threat = Math.round((zombieCount * (speed == 'Slow' ? 2 : 18)) / 180);
    var protection = Math.round(((mallCount * 10) + (redneckCount * 5)) / 60 * 100);
    currentOdds = Math.round((100 + protection - threat) / 2);
  }
  if (currentOdds > 100) currentOdds = 100;
  if (currentOdds < 0) currentOdds = 0;
}
Note that, as with the <text> element at the beginning of this walkthrough, the text value of the element can be reached by accessing its textContent property. Other than that distinction, the DOM looks the same as it does for HTML. To test the calculation, find the group (<g>) element with the ID “oddsButton”. As explained in Part 1, the button is made up of two distinct elements, a <rect> and a <text> element. Fortunately, by grouping them, the parent <g> element allows styling and mouse events to be associated with the button as a whole. For now, temporarily add an onmouseup event to test calcOdds:
<g id="oddsButton" style="cursor: pointer;" onmouseup="calcOdds(); alert(currentOdds);">If this works, it’s time for the next step: moving the pointer. Create a new function called movePointer:
function movePointer() {
  calcOdds();
  document.getElementById('oddsText').textContent = currentOdds + '%';
  var newY = -2 * currentOdds; //relative Y coordinate
  newY += 300; //actual Y coordinate
  document.getElementById('oddsPointer').setAttribute('points',
    "150," + newY + " 100," + (newY - 25) + " 100," + (newY + 25));
}
Yes, the newY calculation can be done in a single step. It was split up for a reason, which will be revealed soon. The noteworthy line here is the last one, the setAttribute function. Remember that oddsPointer was created as a <polygon> element, which works by defining a “points” attribute using absolute coordinates. Like most other attributes, points can be accessed via the DOM by grabbing the element and using setAttribute, and then specifying which attribute (“points”) and the new value. In this case, the new value is a text string consisting of three pairs of coordinates. The pointer is hard-coded in this example to be a right-pointing triangle in a 50×50 space. The Y coordinate of its center can range from 300 at the bottom of the gauge to 100 at the top, corresponding to odds of 0 to 100, respectively. The formula “newY = 300 – (2 * currentOdds)”, broken up here, should place the right tip of the triangle precisely along the scale marked by the tics created in Part 2 of this series.
To watch it in action, replace the oddsButton onmouseup event with a call to the new function:
<g id="oddsButton" style="cursor: pointer;" onmouseup="movePointer();">Populate the city with a few zombies, malls, and rednecks, maybe even toggle to fast zombies, and then click Calculate Odds. The pointer should jump to an extremely accurate prediction of one’s survival during an apocalypse, as demonstrated in Figure 5.
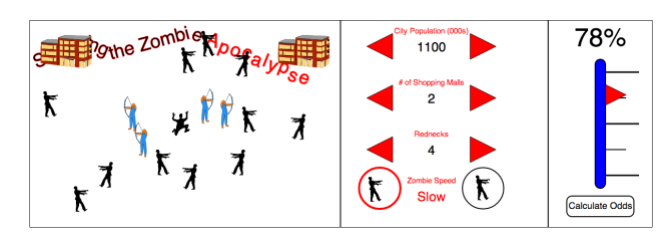
Figure 5. The Finished Product : A Life-Saving Tool
Bonus Feature: Dynamic Path Animation
Because this walkthrough is focused on JavaScript and DOM, here’s one more nice trick to add some animation to the pointer movement. As described back in Part 2, SVG can be animated (in compliant browsers) by adding an <animateMotion> element to an SVG element and then referencing a path.
Taking it one step further, JavaScript can change the coordinates of that path dynamically, enabling movement anywhere at any time for any element on the screen.
To put words into action, find the oddsPointer polygon. Two changes need to be made. First, define a simple path with the ID “oddsPath”. Then reference that path within an <animateMotion> element, which itself is nested within oddsPointer. Note that the <polygon> element is going from self-closing to verbose, so be sure to double-check syntax.
<g id="oddsMeter" stroke="#000000" stroke-width="2">
  <path d="M100 100 h75 m-75 100 h75 m-75 100 h75" stroke-width="3" />
  <path d="M100 150 h50 m-50 100 h50" />
  <path id="oddsPath" d="M 0 0 L 0 -200" />
  <polygon id="oddsPointer" points="150,300 100,275 100,325" fill="#FF0000" stroke-width="1">
    <animateMotion dur="2s" begin="oddsButton.click">
      <mpath xlink:href="#oddsPath" />
    </animateMotion>
  </polygon>
  <rect x="90" y="75" rx="15" ry="10" width="20" height="250" fill="#0000FF" />
</g>
The gotcha here is with the <path> element. Remember, an animation path doesn’t define actual coordinates but rather the relative motion of the animation. If this <path> were to be drawn on the screen, it would start at the left, top corner of the canvas and go straight up. But what it’s telling the pointer to do is to start from its current location (M 0 0) and go up 200px from there (L 0 -200).
Note that the animation is set to start when oddsButton is clicked, as set in the “begin” attribute. But if the button were to get clicked right now, the pointer would just jump to its correct position and then float upward. Unlike previous animation examples, a distinction needs to be made here between browsers that do and don’t recognize SVG animation. In general, it’s best to use document.implementation.hasFeature to check for feature implementation in a browser. In this case, the feature to look for is Animation in the SVG 1.1 spec. Add a function called supportsAnimation():
function supportsAnimation() {
  return document.implementation.hasFeature("https://www.w3.org/TR/SVG11/feature#Animation", "1.1");
}
This is one of several available feature strings that can be found at https://www.w3.org/TR/SVG11/feature.
Next, add one more global variable, this one to track the “L” value of the path so that the pointer always starts where it previously left off rather than resetting to its original position.
<script>
  var zombies = new Array();
  var malls = new Array();
  var rednecks = new Array();
  var currentOdds = 0;
  var previousL = 0;
This may be a little confusing given the prior description of how the animation path works. But keep in mind that the JavaScript will be changing the attribute of the <path>, not the <polygon>. And movement does not change the points attribute of the <polygon> either, so those points will remain constant using this method. Therefore, if the <path> always starts at M 0 0, then the <polygon> will always return to that coordinate before moving, causing an unsightly jump before animating. For that reason, the “M” value of the path needs to be changed every time so that the motion remains relative.
Go back to the movePointer function and add the sniffer. Now the mystery of the messy “newY” becomes clear. Based on browser capabilities, either the “d” attribute of the animation path will be changed in time for the animation to begin, or the points attribute of the polygon will be set:
function movePointer() {
  calcOdds();
  document.getElementById('oddsText').textContent = currentOdds + '%';
  var newY = -2 * currentOdds; //relative Y coordinate
  if (supportsAnimation()) {
    document.getElementById('oddsPath').setAttribute('d','M 0 ' + previousL + ' L 0 ' + newY);
      previousL = newY;
  } else {
    newY += 300; //actual Y coordinate
    document.getElementById('oddsPointer').setAttribute('points',
     "150," + newY + " 100," + (newY - 25) + " 100," + (newY + 25));
  }
}
With that, this Zombie Apocalypse Survival Predictor is now complete! Try it out now at http://justinwhitney.com/zombies/zombies_part4.htm or look at the page’s source code for the final version of this walkthrough. All assets used on this page (courtesy of http://openclipart.org) can be found at http://justinwhitney.com/zombies/zombiesAssets.zip.
Wrapping Up
While the chances of surviving a zombie apocalypse may vary, the chances of being caught in one are fairly low. But as the CDC knows (http://www.cdc.gov/phpr/zombies.htm), companies that prepare for zombies are prepared for a lot of other things as well. I hope this series of walkthroughs has illustrated how to use SVG for visually dynamic, scalable Web apps.
The skills learned here can be used for many, many other applications. Like preparing for asteroids.
Because an asteroid apocalypse is definitely going to happen.
This article is part of the HTML5 tech series from the Internet Explorer team. Try-out the concepts in this article with three months of free BrowserStack cross-browser testing @ http://modern.IE
Frequently Asked Questions on Dynamic SVG and Path Animation
What is SVG and why is it important in web design?
SVG stands for Scalable Vector Graphics. It is a type of graphic format, based on XML, used to display a variety of graphics on the web and other environments. Since SVGs are scalable, they can be resized without losing any quality. This makes them ideal for responsive web design, as they can adjust to different screen sizes and resolutions. SVGs are also important because they can be animated and interacted with using CSS and JavaScript. This opens up a world of possibilities for creating dynamic, interactive graphics and animations.
How does SVG animation work?
SVG animation works by changing the properties of SVG elements over time. This can be done using CSS, JavaScript, or SMIL (Synchronized Multimedia Integration Language). With CSS and JavaScript, you can change the properties of SVG elements such as their position, size, rotation, color, and more. With SMIL, you can create more complex animations that involve motion along a path, morphing shapes, and synchronizing multiple animations.
What is path animation in SVG?
Path animation in SVG involves moving an object along a predefined path. This is done using the animateMotion element in SVG. The path can be defined using the d attribute of the path element. The object will then follow this path over a specified duration. This can create a variety of effects, such as an object moving along a complex curve, or an object following a random path.
How can I animate an SVG using CSS?
To animate an SVG using CSS, you can use keyframes and the animation property. First, define a set of keyframes that describe the animation. Each keyframe specifies the state of the SVG at a certain point in time. Then, apply these keyframes to the SVG using the animation property. You can control the duration, timing function, and other aspects of the animation using this property.
How can I animate an SVG using JavaScript?
To animate an SVG using JavaScript, you can use the requestAnimationFrame function. This function allows you to create smooth animations by calling a specified function before the next repaint. Inside this function, you can change the properties of SVG elements to create the animation. You can also use libraries like GSAP or anime.js to make the process easier.
What is the difference between SVG and Canvas?
SVG and Canvas are both technologies for creating graphics on the web, but they work in different ways. SVG is a vector-based method, which means it uses mathematical equations to create shapes. This makes it resolution-independent and able to create crisp, scalable graphics. Canvas, on the other hand, is pixel-based. It works more like a traditional painting, where you manipulate individual pixels. This makes it more suitable for creating bitmap images and complex animations.
Can I use SVG animation in all browsers?
SVG animation is widely supported in all modern browsers, including Chrome, Firefox, Safari, and Edge. However, it may not work in older browsers or certain mobile browsers. It’s always a good idea to test your animations in multiple browsers to ensure compatibility.
How can I optimize my SVGs for better performance?
There are several ways to optimize your SVGs for better performance. One way is to minimize the size of your SVG files by removing unnecessary data and simplifying complex paths. You can also use CSS and JavaScript to control the rendering of your SVGs, such as by hiding offscreen elements or reducing the number of updates. Additionally, using hardware acceleration can improve the performance of SVG animations.
Can I use SVGs in responsive web design?
Yes, SVGs are ideal for responsive web design. Because they are vector-based, they can be scaled to any size without losing quality. This means they can adjust to different screen sizes and resolutions, making them a great choice for responsive design.
How can I learn more about SVG and path animation?
There are many resources available for learning more about SVG and path animation. Websites like MDN Web Docs, CSS-Tricks, and SitePoint offer tutorials and guides on these topics. You can also find many online courses on platforms like Coursera, Udemy, and Khan Academy. Additionally, experimenting with SVG and path animation on your own can be a great way to learn.

