
Key Takeaways
- Online graph and chart creation tools should offer a range of diagram types, real-time collaboration features, an easy-to-use interface, integration with other applications, social networking capabilities, export and import facilities, and revision history. They should also support various languages and offer fast performance.
- The article reviews five online diagram tools: Lucid Chart, Draw.io, ProcessOn, Gliffy, and Creately. Each tool has unique features and benefits, such as Lucid Chart’s integration with Google Drive and Google Apps, Draw.io’s 100% uptime claim, ProcessOn’s real-time collaboration feature, Gliffy’s ability to import Visio documents, and Creately’s user-friendly interface.
- Online graphs and charts can be used to represent various types of data and can be customized, shared, saved, and used for professional purposes. Some tools also allow for data importation from other sources, the creation of interactive charts, and offer help resources for users.
Most of us — even techies, marketers and other ‘non-designers’ — at some time need to produce a diagram to help explain our views and ideas. For the purposes of this article, I’m going to characterize a ‘diagram’ simply as a geometrical symbolic representation of information.
You can separate most diagrams into two broad categories:
- Graph based diagrams: This includes Tree Diagrams, Network Diagram, Flowchart, Venn diagram, Existential graph etc.
- Chart like diagrams: This includes histograms, population density maps, exploded view, three dimensional diagrams etc.
Currently there is a growing selection of tools which focus on drawing charts. Gabrielle has already given us her views on the 5 best online tools for creating amazing charts.
In this article, I’ll be discussing some tools with the flexibility to cover both categories. But first let’s consider the parameters we should keep in mind while selecting a tool.
Flexibility
First, be sure to consider a tool which provides a wide range of diagram – all at one place. The range should include all of these diagrams:
- UML
- Flowchart
- Venn Diagram
- Org chart
- Wireframe
- Business Process Modelling
- Network Diagram
- SWOT Analysis
- ERD
- Structural
- Class Diagram
- Database Design
Real-Time Collaboration / Team building
As data is often owned by more than one master, collaboration with colleagues in real-time is a useful feature. Through this, you can invite your colleagues and clients for online chatting to discuss and contribute to diagrams in real-time. This kind of active participation by everyone to improve the diagram further.
Easy-to-use Interface
The tool should be easy-to-use. The canvas should be clearly visible with scroll up-down options. Drag-and-drop shapes and point-click features are covered under every online diagram tool.
Integration With Other Application
A common feature provided by online tools is integration with Google Drive, Google Apps, JIRA, Confluence, Jive, and Box.
The Social Network
The tool should be like a social network where team members and individual users can share their suggestions and thoughts regarding diagram development. This feature comes with a valuable restriction of creating diagrams privately or sharing it with others for promotion or suggestions.
Export and Import Facilities
The tool should provide with a feature to export and import diagrams. Some of them also provides with inserting images from computer, internet and cloud. The output can be in the form of image/file/document formats like jpg, bmp, pdf, csv, etc.
Revision History
Perhaps you’ve seen the CSS revision history feature in WordPress while updating child themes? A similar history feature is provided by some online tools which helps users in tracking and reverting changes in diagram development.
Novice to Expert
Sometimes it is important to look for a tool which helps novice users in becoming an expert. This is done by referring to help files and learning more about the features provided by the tool. Becoming an expert will help is easing with diagram development.
Multi-lingual Support
A high quality online application should provide support for various other native languages besides English.
Performance
The tool needs be fast to both load and use. Drag and drop functionality should not slow the whole process. Recovery options can also be provided in case of accidental corruptions or deletions.
Here, I have listed some professional online diagram tools:
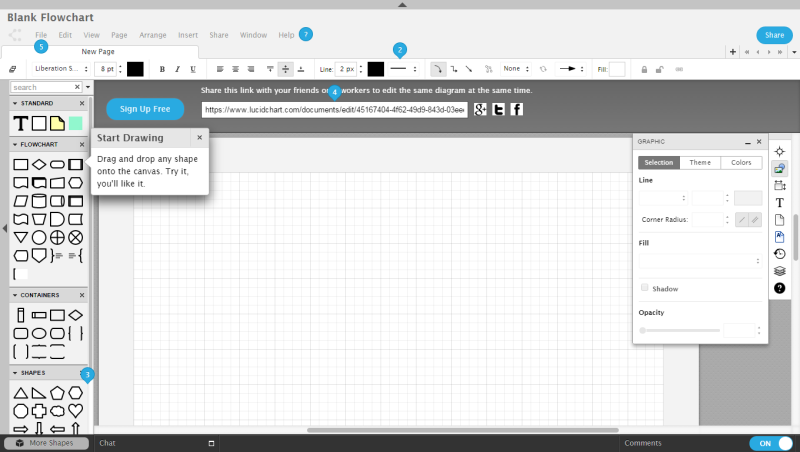
Lucid Chart
Web-based diagramming software built on open web standards. Its features include:
- Compatible as it’s built on open web standards.
- Create the following using Lucid Chart:
- Flowcharts
- UML
- Network Diagrams
- Business Process Models
- Org Charts
- ERD
- Wireframing / Mockups
- Mind Maps
- Integrated with Google Drive, Google Apps, Jira etc.
- You can try the demo without signing.
- Exporting the diagram to different formats like JPEG, PNG, PDF is simple.
- Real-time collaboration with the team.
- Provides revision history of the diagrams created.
- Easy to share diagrams online.
- They’ve provided with hundreds of templates and examples.
It’s an excellent tool to create diagrams online, go through LucidChart’s overview given on the home page of the website.
Draw.io
Free online software which the diagrams stored doesn’t go through draw.io servers. Instead, the user communicates directly with Google Drive or Dropbox. Other features include:
- There is a plug-in provided for JIRA.
- They claim to have an uptime of 100%.
- Revision control is done in users Google Drive.
- Translation is provided in more than 25 languages besides English.
- Wire framing and mock-ups are part of free plans.
- Create the following using Draw.io:
- UML
- Flowchart
- Entity Relation
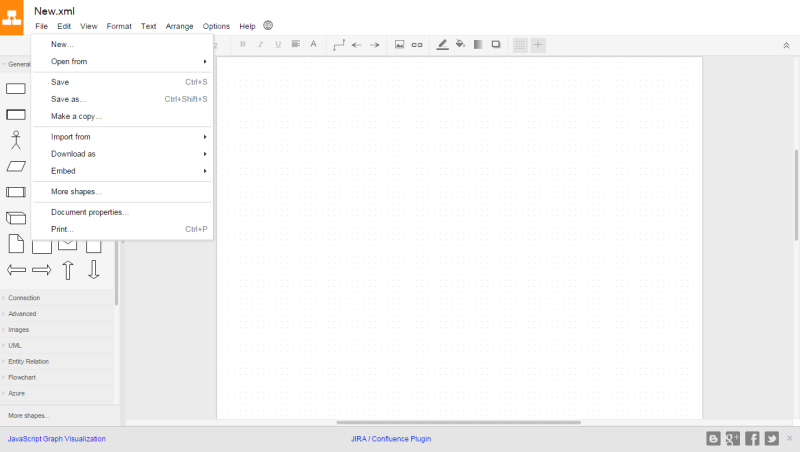
Some of its features differ from others like 100% uptime, JIRA plug-in, translations etc. They’ve also provided some differences on their official blog which makes them one-step ahead Lucid Chart.
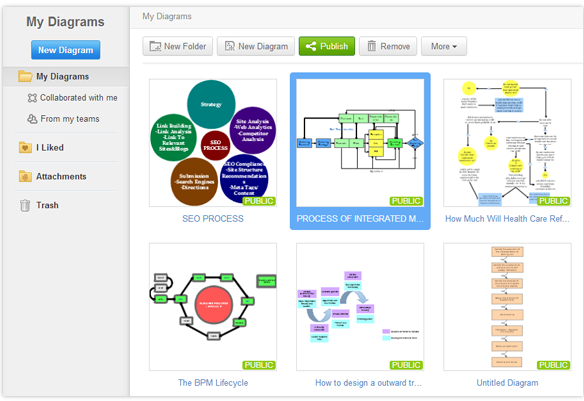
ProcessOn
With ProcessOn you can create different kinds of charts, such as: flow charts, organizational charts, EPC, and many others. It has the following features:
- Real-time collaboration is possible through which all team members actively participate in modifying and improving the diagrams.
- Files can be easily created and edited with easy to share features.
- The diagrams can be exported in different formats.
- Users can create a network of team by joining groups and inviting colleagues. This makes the process simpler.
- Translation of the application is provided for 3-4 languages and rest is in process.
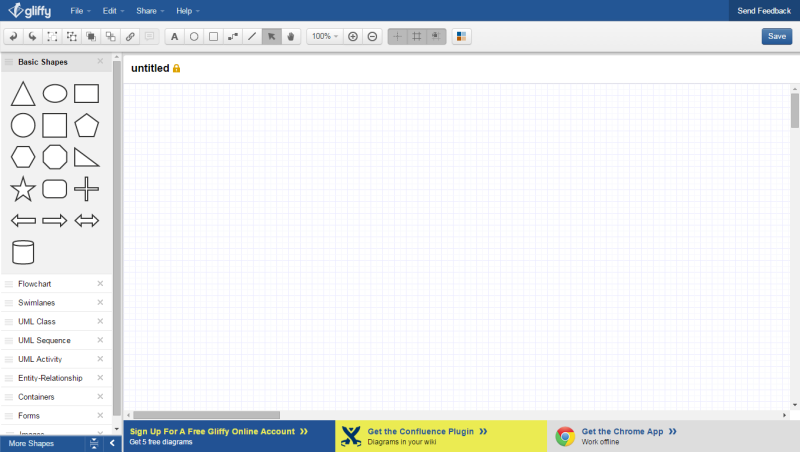
Gliffy
It is the world’s first net-native business graphics application. Features include:
- They’ve provided various themes and templates.
- It’s easy to publish and share diagrams.
- Revision control automatically stores each version which leads to ease in tracking changes.
- Google Drive integration is provided.
- Visio documents can be imported.
- Create the following using Gliffy:
- UML
- Flowchart
- Venn Diagram
- Org chart
- Wireframe
- Business Process Modelling
- Network Diagram
- SWOT Analysis
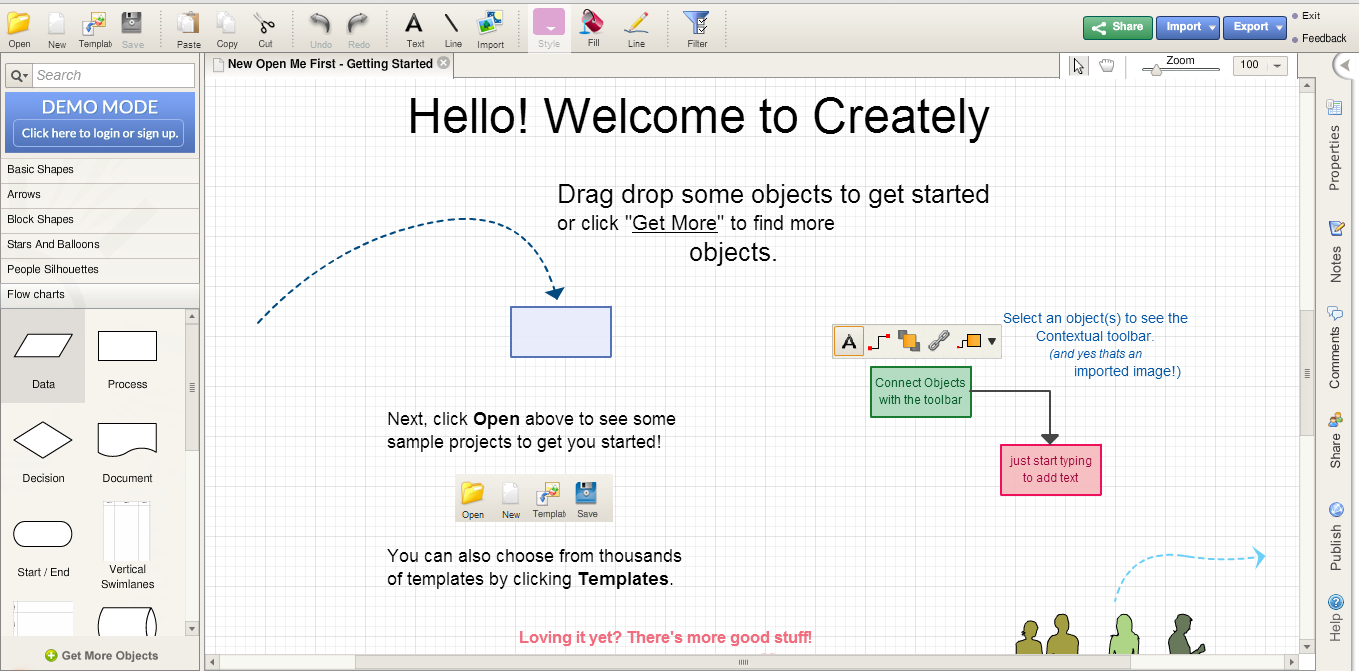
Creately
This is a perfect tool for saving your time while developing an online diagram. Some of its features are listed below:
- 1-click create feature for drawing faster. With a single click and drag user can add the next shape and the line connecting it.
- Importing SVG vector images is possible. Users can add 100 of shapes to the diagram.
- Real-time collaboration.
- Easy connectors.
- Arranging, aligning and fixing heights are easy through its user-friendly interface.
- Different preset color themes for shapes styling to customize lines and even gradients.
- Inline comments and discussion thread.
- They’ve provided with full revision history.
- 100,000+ diagram examples are also provided for referring.
- Secure View only or Edit enabled links to send to colleagues over email.
Summary
In this article I’ve covered 5 professional online tools for creating diagrams with parameters to be considering while selecting one. Some are fast while some secure for sharing. Use them accordingly as given below:
| Lucid Chart | Try its demo without signing up. They report that their Chrome Extension and Firefox plug-in have more than 2 million users. Trusted by Ford, Harvard University and many others. |
| Draw.io | Translation of the application in more than 25 languages. Try its demo without SigningUp Claims 100% uptime and provides JIRA plugin. Amazing positive reviews on its chrome app. |
| ProcessOn | Users can create a network of team/events by joining groups and inviting colleagues just like a discussion forum. Also provided translation of application in various languages. |
| Gliffy | The world’s first net-native business graphics application. Provides easier approach for tracking changes. Trusted by CISCO, Samsung, IBM, Adobe and many others. |
| Creately | Secure sharing with user-friendly amazing interface. Thousands of examples and libraries for users. Trusted by Paypal, Amazon and many others. |
Frequently Asked Questions about Online Graphs and Charts
What are the different types of online graphs and charts I can create?
There are several types of online graphs and charts you can create. These include bar graphs, line graphs, pie charts, scatter plots, area charts, and more. Each type of graph or chart is best suited to represent different types of data. For example, bar graphs are great for comparing quantities across different categories, while line graphs are ideal for showing trends over time.
How can I customize my online graphs and charts?
Most online graph and chart creators offer a variety of customization options. You can usually change the colors, fonts, and sizes of your graphs. Some tools also allow you to add labels, legends, and other annotations to your graphs to make them more informative and easier to understand.
Can I share my online graphs and charts with others?
Yes, most online graph and chart creators allow you to share your creations with others. You can usually do this by generating a link to your graph or chart, which you can then send to others. Some tools also allow you to embed your graphs and charts on websites or in presentations.
Can I save my online graphs and charts for later use?
Yes, most online graph and chart creators allow you to save your creations for later use. This can be very useful if you need to update your graphs or charts with new data in the future.
Can I use online graphs and charts for professional purposes?
Absolutely! Online graphs and charts are a great way to present data in a clear and visually appealing way. They can be used in presentations, reports, websites, and other professional contexts.
Do I need any special software to create online graphs and charts?
No, you don’t need any special software to create online graphs and charts. All you need is a web browser and an internet connection. Some online graph and chart creators may require you to sign up for an account, but many are free to use.
Can I import data from other sources to create my online graphs and charts?
Yes, many online graph and chart creators allow you to import data from other sources. This can be a huge time-saver if you already have your data in a spreadsheet or other format.
Are there any limitations to what I can do with online graphs and charts?
While online graph and chart creators are very powerful tools, they do have some limitations. For example, they may not be able to handle extremely large datasets, and they may not offer the same level of customization as more advanced graphing software. However, for most users, these limitations are unlikely to be a problem.
Can I create interactive online graphs and charts?
Yes, some online graph and chart creators allow you to create interactive graphs and charts. These can be a great way to engage your audience and allow them to explore your data in more depth.
What should I do if I need help creating my online graphs and charts?
If you need help creating your online graphs and charts, don’t worry! Most online graph and chart creators offer tutorials and other resources to help you get started. You can also reach out to their customer support team for assistance.