

Key Takeaways
- Heroku, a Platform-as-a-Service (PaaS) offering, has a metrics dashboard that provides insights on an application’s performance at the infrastructure level, such as CPU, Memory, and IO utilization.
- Heroku’s metrics dashboard provides data on memory usage, dyno load, events and errors, response time, and throughput. However, it is only available for applications on the paid tier.
- The tutorial demonstrates how to optimize a Rails application based on Heroku metrics. This includes understanding error codes, creating a sample application, and making adjustments based on the insights from the metrics dashboard.
- The author emphasizes that before adding more resources to improve load issues, it’s beneficial to check the metrics to see if the application is actually utilizing the available resources effectively. The right balance between resource usage, throughput, and response time can be achieved by tweaking the worker and thread count.

Today, we are going to talk about performance related items on Rails and Heroku. I’d like to introduce the Heroku metrics dashboard and how to make performance optimizations to our application based on that.
Heroku is a Platform-as-a-Service (PaaS) offering for hosting web applications and is one of the easiest services for getting your application online quickly. Though it’s built on top of AWS, it has many features wrapped around it that make it easy and appealing over other cloud-computing services. One such feature is it’s metrics dashboard which provides insights on how an application is performing at the infrastructure level.
In this tutorial we’ll see how to make use of this to optimize our Rails application.
Note that Heroku metrics only helps on the resource utilization side, like CPU, Memory, and IO, but it wouldn’t help us much on our application performance. There are many tools for application monitoring, such as New Relic and Skylight. I would definitely recommend using such services alongside Heroku metrics.
In this tutorial, we will first see an overview of the metrics dashboard, what kind of insights it has to offer, and a few important error codes you should know. Then, we will build a sample Rails application with a couple of tables and host it on Heroku.
Once hosted, we will overload our server and see the Heroku metrics showing us the problem. Based on that, we’ll explore some best practices to fine tune things and see the result of our fixes in action.
Let’s get started.
Heroku Metrics Overview
As we have seen above, Heroku metrics provides insights on your application performance. The metrics dashboard would only be enabled and accessible for applications on the paid tier. You can access your application’s metrics dashboard from your application page in Heroku.
Dashboard
First, let’s see the metrics that Heroku’s dashboard offers. By default, Heroku gathers the following metrics for your dynos.
Memory Usage
This provides insight on the memory usage of your application for a process type. This metric provides you the Total Memory usage, Swap usage, and Memory Quota. All of these metrics are collected on the dyno level. There’s also RSS, which is the total amount of memory that is on all dynos on the selected process type.
Dyno Load
The Dyno load represents the load your dynos are incurring. This is the number of CPU tasks that are in the queue awaiting a free dyno.
Events
This represents the events and errors occurring in n the application. Events like deployment, restart, and scaling are all recorded here. Also, it captures the errors that have occurred. We’ll look at some of the important errors you tend to see often below.
While these are captured for all dynos, there are couple of metrics that are only captured for web dynos.
Response time
This shows the average response time of our application and the 95th percentile. The 95th percentile indicates that 95% of the application requests were served faster than the indicated time.
Throughput
This gives us insights on the number of requests our application has received in a minute. It shows the number of requests that have been successfully handled and number of requests that have not.
Errors
Now, let’s look at few important error codes that you may encounter on the dashboard.
R14 & R15
The infamous R14 error code represents a memory overflow issue. Meaning, your application is using more memory than available on your dyno. When your application’s memory requirement exceeds the quota, Heroku starts providing swap memory, which is the memory that is stored on disk. But, this can directly affect your application’s response time.
This can occur for many reasons, but more common cases are for memory leaks. If you see a continuous climbing graph on your memory usage, it’s a good indication that your application might be leaking memory.
The R15 is the error code follows R14 if your application simply hasn’t stopped consuming more memory. When this error occurs, Heroku will automatically restart the application. The quota for each of the dyno plans can be found here.
H10
This is an error code that you should be kept aware of and, when this occurs, you better fix it immediately. H10 represents an application crash. Most web servers have configuration around the number of workers and silent restarting of crashed workers. If it isn’t configured for your application or if yours is a single threaded/single worker application, this error code means your application is down.
H12 & H13
These error codes are related to the request/response time. H12 is triggered every time a request times out, meaning, it takes more than 30 seconds to return a response. The 30-second limit is at the Heroku router level.
H13 is also kind of request timeout, but when it happens within the application. When your web server has a lower threshold for request timeout, say 10 seconds, and a request takes 15 seconds to process, the connection will be closed by your web server. When this happens, Heroku triggers an H13.
The errors covered above are some that are more common than others. The full list of error codes their explanation could be found here.
With the basic overview of the Heroku dashboard, I want to show you a sample application’s optimization based on what we have discussed above.
Sample Application
Our sample application is going to be quite small and trivial. You can generate it with the following commands:
rails new heroku-metrics-example -d postgresql
rake db:create && rake db:migrate
rails g scaffold post title body:text
railg g scaffold comment body post:references
rake db:migrate
I’ve just created a Rails application with two scaffolds: posts and comments. Now, we’ll add a seed file to generate sample data for testing. This step is optional, but it’s just to put some processing time into each request. I’m using the faker gem to generate the seed data. Below is the content of the seed file.
100.times do |t|
    post = Post.create(title: Faker::Lorem.word, body: Faker::Lorem.paragraphs(3).join(' '))
    puts("Created Post - #{post.id}")
    rand(10..50).times do |c|
        comment = Comment.create(body: Faker::Lorem.paragraph, post: post)
        puts("Created Comment - #{comment.id} for Post #{post.id}")
    end
end
Now, let’s initialize git repository and deploy to Heroku:
git init
git add .
git commit -m "Initial commit"
heroku apps:create
git push heroku master
heroku run rake db:migrate
heroku run rake db:seed
The Rails application is now successfully deployed to Heroku. Let’s begin to put load into our application to generate some metrics.
For this tutorial, I’m using Heroku’s hobby dyno which comes with 512 MB of RAM. There is more information about dyno types here
Request Timeouts
I’m using siege to stress the server. Below is the current settings of my load test.
siege -t 5M -c 30 https://rocky-coast-29518.herokuapp.com/posts -v
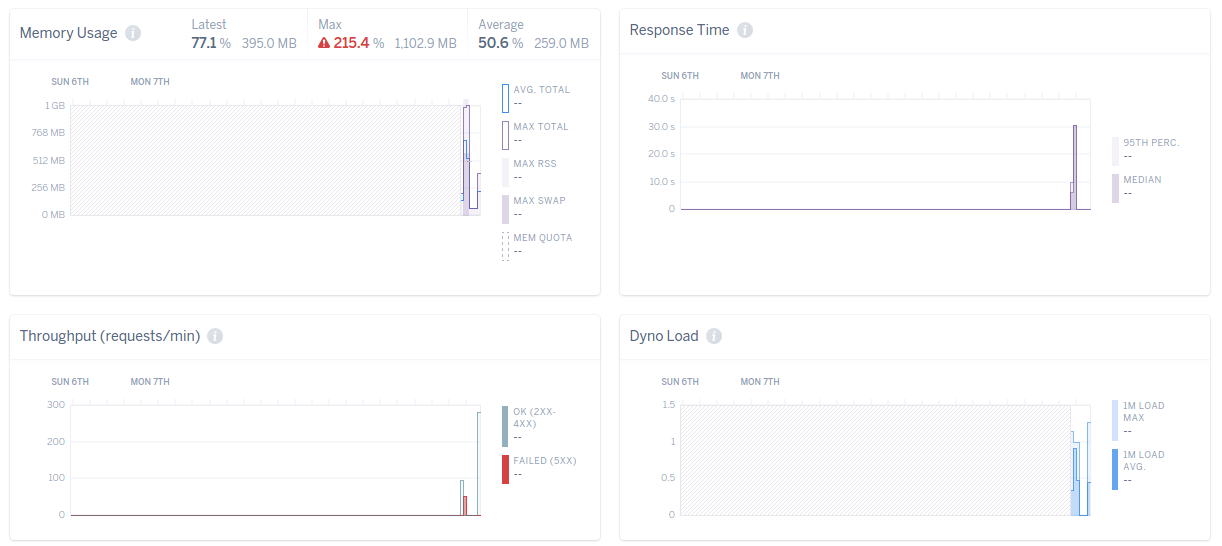
Here I’m generating 30 concurrent users for 5 minutes continuously to the posts endpoint. After the run, you can see the impact it had on the application using Heroku metrics:

As you can see, the requests started to timeout quickly. Why?
The first and foremost reason for this is our web server. Rails, by default comes with WEBrick, which is a simple HTTP server for Ruby. It is and should be, mainly used for development purposes. WEBrick is a single threaded web server with no concurrency support, so only one request is processed at a time. To fix this, let’s configure a different web server.
We are going to use Puma, which is the web server Heroku recommends.
Adding the web server is quite simple. Just add the gem "puma" to your Gemfile and do bundle install.
Once installed, create the puma configuration file under config/puma.rb and add the below lines to it.
workers Integer(ENV['WORKERS'] || 4)
threads_count = Integer(ENV['THREADS'] || 5)
threads threads_count, threads_count

preload_app!

rackup      DefaultRackup
port        ENV['PORT']     || 3000
environment ENV['RACK_ENV'] || 'development'

on_worker_boot do
  ActiveRecord::Base.establish_connection
end
I’m passing the worker count from an environment variable to the workers method, defaulting it to 4. Then on line 3, I’m passing the minimum threads and maximum threads both as 5. On the final block, when a worker starts I’m establishing an Active Record connection.
After the configuration, create a file called Procfile in the root of your application and add the below line to it and deploy the application to Heroku.
web: bundle exec puma -C config/puma.rb
Once deployed, I started the load test with the same specifications. Immediately, I start seeing the improved result. The response time went down significantly, as does the memory footage. We can also see an increase in the throughput:
After updating our web server, we see a tremendous improvement in the performance of the application.
Memory Overload
Our performance is fine, but we can still get more out of our resource. Looking at the graphs, you can see we are only using half the available memory available.
Let’s update the workers count to 5 and threads count to 10 on Heroku. Let’s run the load test again, this time with more concurrent users. Below is the updated load test configuration.
siege -t 5M -c 200 https://rocky-coast-29518.herokuapp.com/posts -v
I have just updated the concurrent users from 30 to 200! No, as you might’ve expected, the application didn’t come crashing down. But we did start over using our resources. There was an increase in throughput, but we started seeing many failed requests and memory overload.
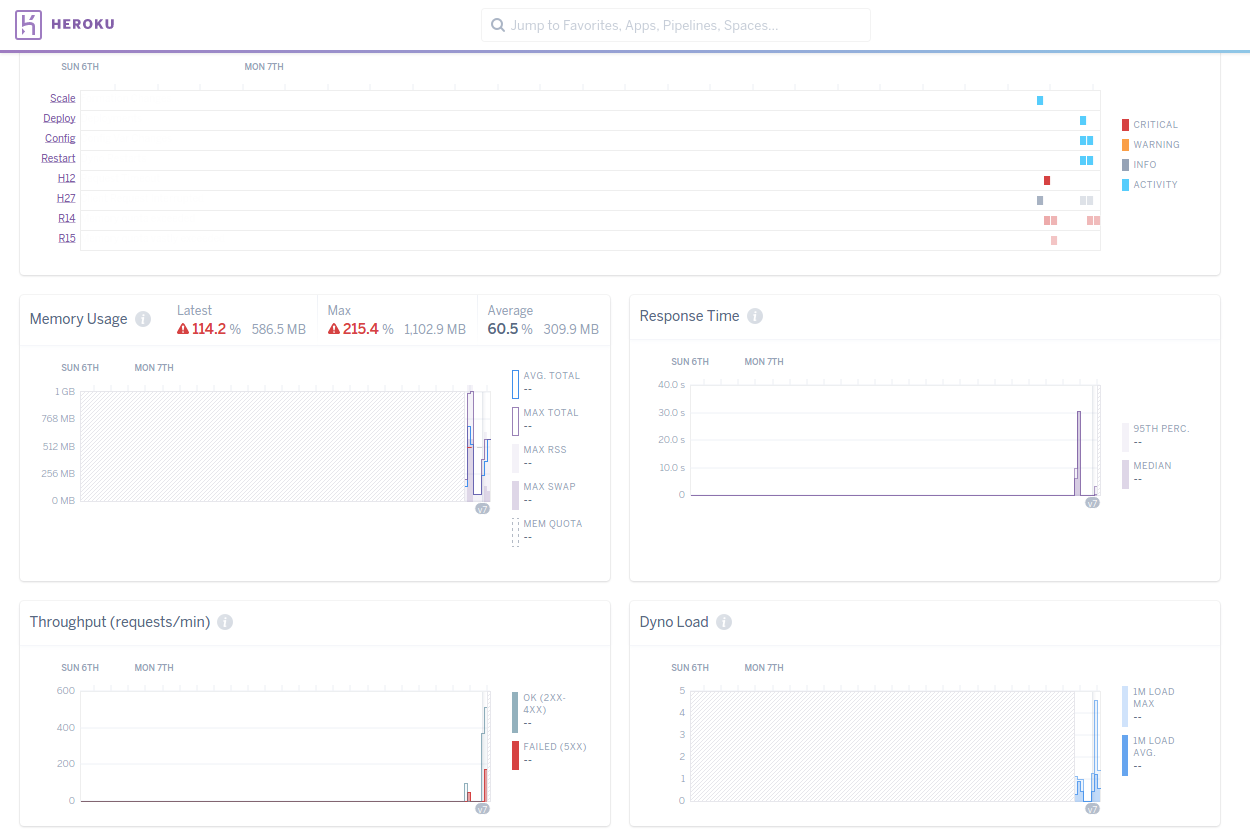
There are couple of reasons this happened:
-
Our worker and thread setup is not quite correct. We’re using 5 workers and 10 threads each. But the DB plan used in this example only has 20 connections max. So, some threads didn’t get a DB connection and failed at that stage.
-
Because our worker count is more for the memory size and since the workers use memory we started seeing R14s.
To fix this, I have updated the worker count to 3 and thread count to 8. When I re-ran the test, there were no request timeouts or memory overload.
As a side effect of the load we are putting on the app, the response time increased and throughput reduced a little bit. But, slow requests are better than failed requests at any time.
There are also a couple of things that can be fixed on the application level too. For example, the /posts endpoint is loading the entire posts table which is quite bad and could be fixed by adding pagination or lazy loading. But, we are focused here on optimizing the resources available to us. You could learn more about Rails performance optimization here.
Conclusion
As we’ve seen, Heroku’s application metrics are quite handy and helpful for optimizing our Rails application. A few configuration tweaks can result in some big improvements.
The most common method for fixing load issues is provisioning more resources, which is fine. But, I’d still suggest taking a look at the metrics to see if the application is actually making use of the resources available before pouring more resources into it.
In the steps discussed above, there is no one standard value to set for workers or threads count, since it’s relative to the application, dyno size, and service (eg: DB) constraints. I would suggest tweaking it until you could find a balance between the resource usage and your throughput and response time.
The sample application used here is available on github.
Thanks for reading!
Frequently Asked Questions (FAQs) about Leveraging Heroku’s Metrics for Better App Performance
What are the key metrics to monitor in Heroku for better app performance?
The key metrics to monitor in Heroku for better app performance include response time, throughput, dyno load, memory usage, and database activity. Response time is the time it takes for your app to respond to a request. Throughput is the number of requests your app can handle per second. Dyno load is the amount of work your dynos are doing. Memory usage is the amount of memory your app is using. Database activity is the number of queries your app is making to the database and how long those queries are taking.
How can I use Heroku’s metrics to improve my app’s performance?
You can use Heroku’s metrics to identify bottlenecks in your app’s performance and make necessary adjustments. For example, if your app’s response time is high, you might need to optimize your code or add more dynos. If your app’s memory usage is high, you might need to optimize your code to use less memory or upgrade to a larger dyno size.
What are dynos in Heroku and how do they affect app performance?
Dynos are isolated, virtualized Linux containers that are designed to execute code based on a user-specified command. They are the building blocks of a Heroku app. The type and number of dynos you use can significantly affect your app’s performance. For example, using more dynos can increase your app’s capacity to handle more traffic.
How can I monitor my Heroku Postgres database performance?
You can monitor your Heroku Postgres database performance using the Heroku Postgres Data Clips feature. This feature allows you to create SQL queries that run against your database and return a set of results. You can use these results to analyze your database performance and identify any potential issues.
What are the different types of dynos in Heroku and how do they affect app performance?
Heroku offers three types of dynos: free, hobby, and professional (standard and performance). Free and hobby dynos are subject to sleep, which means they become inactive after 30 minutes of inactivity. This can affect your app’s performance if it receives infrequent traffic. Professional dynos, on the other hand, do not sleep and can handle more traffic, making them suitable for production apps.
How can I optimize my app’s performance in Heroku?
You can optimize your app’s performance in Heroku by monitoring your app’s metrics, optimizing your code, using the right type and number of dynos, and optimizing your database queries. You can also use Heroku’s add-ons to further enhance your app’s performance.
What is the role of Heroku’s metrics in app development?
Heroku’s metrics play a crucial role in app development by providing insights into your app’s performance. They help you identify bottlenecks, optimize your app’s performance, and make informed decisions about resource allocation.
How can I use Heroku’s metrics to troubleshoot performance issues?
You can use Heroku’s metrics to troubleshoot performance issues by identifying the metrics that are not performing as expected and investigating the cause. For example, if your app’s response time is high, you might need to check your code for any inefficiencies or add more dynos to handle the load.
How can I scale my app in Heroku for better performance?
You can scale your app in Heroku for better performance by adding more dynos or using larger dyno sizes. You can also use Heroku’s autoscaling feature, which automatically adds or removes dynos based on your app’s throughput.
What are the best practices for monitoring app performance in Heroku?
The best practices for monitoring app performance in Heroku include regularly checking your app’s metrics, setting up alerts for any significant changes in your metrics, optimizing your code and database queries, and using the right type and number of dynos.