
The web gurus over at Google headquarters recently made an announcement that should give mobile web development a much appreciated shot in the arm. Released in a Chrome Beta update earlier this month, Chrome DevTools for Mobile aims to make mobile web development as easy as its desktop counterpart.
Stealthily bundled with the built-in developer tools, anyone with an updated version of the Chrome browser (beta channel) can quickly navigate to Menu > Tools > Developer tools to enable the
DevTools window and take the new mobile features for a spin.
Screen sharing for easier debugging
Those of you with Android handsets can take advantage of Chrome’s new “Screencast” technology to use your mobile device as a more authentic testbed. Simply connect your Android device via USB and enable “USB Debugging” within the device settings. No need to hassle with adb command lines or obtuse configurations. Chrome will take care of the rest by autodiscovering your handset and integrating it within the developer tools options.
Once connected, you can begin screencasting by clicking the dedicated button in the developer tools window which then presents your device’s screen in a new panel. Your Android device can then receive direct input from your desktop screen.
This feature presents an opportunity for improved productivity as much as anything else. When boiled right down, you essentially trim the time it takes to switch between desktop and mobile displays for debugging. You can also rest in the fact that by screencasting you’re actually looking at the performance of a site on the physical hardware itself, not an emulation.
All of this, by the way, can be configured by visiting chrome://inspect in your Chrome browser:
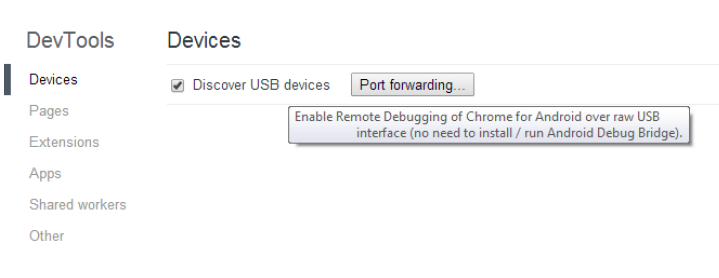
As a side note, the “Port forwarding…” button pictured above grants a touch of flexibility for those that might not have their screen and development machine on the same network. In this scenario, you can create a listening TCP port on your mobile device and map it to a given TCP port on your development machine. All forwarded traffic travels over USB, bypassing the mobile device’s network configuration. Certainly a handy feature in some cases.
Mobile emulation
Where Chrome’s screencast allows you to view the authentic Android performance of your site within the comfy confines of your desktop screen, the new mobile emulation feature grants access to a wider range of devices for debugging.
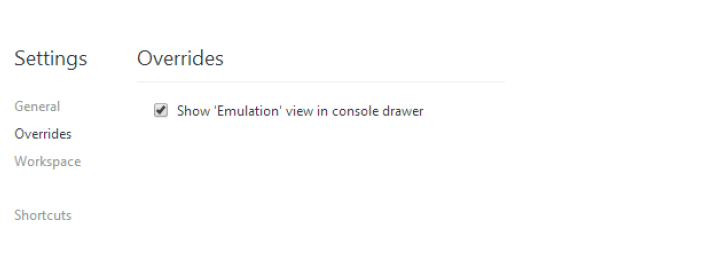
Enabling the emulation view is as easy as checking the correct box in the developer tools settings menu:
Inside the emulation view (which resides within the console drawer), properties about the viewport can be set. These include User Agent, Screen Resolution, and Pixel Ratio along with preset templates for popular devices.
By clicking the “Emulate” button, the current page is shrunk down to the emulated screen parameters according to the set properties. This emulated display can be manipulated using the mouse in the same way as you would use your finger on a physical device.
Utilizing this feature of Chrome DevTools for Mobile allows for faster, more thorough debugging on a wide range of mobile devices. Pinch zooming, finger scrolling, and even multi touch events can all be simulated in this view.

Taking the legwork out of mobile debugging
In the end, these new set of mobile developer tools for Chrome remove some of the common headaches associated with developing mobile sites on nonmobile devices. With the continued growth of mobile browsing and the need for responsive web design that comes with it, utilities like Chrome’s DevTools for Mobile that make it easier to develop for the mobile population are always welcome.
By granting an easy yet comprehensive way to integrate your Android device into the debugging process as well as providing useful tools for emulating a plethora of popular mobile devices on the same screen, Google’s new set of DevTools warrants a download of Chrome Beta.
Oh, and did I mention it’s all completely free?
Frequently Asked Questions (FAQs) about Chrome DevTools for Mobile
How can I access Chrome DevTools on my mobile device?
To access Chrome DevTools on your mobile device, you need to connect your device to your computer and enable USB debugging. After that, you can open Chrome on your computer, go to the ‘More tools’ option, and select ‘Remote devices’. From there, you can select your device and inspect the open tabs on your mobile browser.
Can I use Chrome DevTools to debug JavaScript on my mobile device?
Yes, you can use Chrome DevTools to debug JavaScript on your mobile device. You can set breakpoints, step through code, and inspect variables just like you would on a desktop. This can be extremely helpful for testing and debugging mobile-specific issues.
What is remote debugging with Chrome DevTools?
Remote debugging is a feature of Chrome DevTools that allows you to debug a webpage on a mobile device from your desktop. This can be particularly useful for testing mobile-specific features or debugging issues that only occur on mobile devices.
How can I simulate a mobile device with Chrome DevTools?
Chrome DevTools provides a device mode that allows you to simulate a variety of mobile devices. You can access this mode by clicking on the ‘Toggle device toolbar’ button in the DevTools toolbar. From there, you can select a specific device, adjust the screen size, and even simulate network conditions.
Can I use Chrome DevTools to test the performance of my website on mobile devices?
Yes, Chrome DevTools includes a performance panel that allows you to record and analyze the runtime performance of your website. This can be particularly useful for identifying performance bottlenecks and optimizing your site for mobile devices.
How can I use Chrome DevTools to inspect elements on a mobile webpage?
You can use the ‘Inspect’ feature of Chrome DevTools to inspect elements on a mobile webpage. Simply select the element you want to inspect, and DevTools will highlight it in the Elements panel. From there, you can view and edit the element’s HTML and CSS.
Can I use Chrome DevTools to monitor network activity on my mobile device?
Yes, Chrome DevTools includes a network panel that allows you to monitor network activity on your mobile device. This can be particularly useful for identifying network issues or optimizing your site’s network performance.
What is the ‘Console’ tab in Chrome DevTools for mobile?
The ‘Console’ tab in Chrome DevTools for mobile is a powerful tool that allows you to interact with the JavaScript on your webpage. You can use it to log diagnostic information, run JavaScript code snippets, and interact with the Document Object Model (DOM).
Can I use Chrome DevTools to emulate different geolocations on my mobile device?
Yes, Chrome DevTools includes a geolocation emulation feature that allows you to test how your website behaves in different geographical locations. This can be particularly useful for testing location-based features or localizing your website.
How can I use Chrome DevTools to optimize my website for mobile devices?
Chrome DevTools provides a variety of tools and features that can help you optimize your website for mobile devices. These include a responsive design mode, performance profiling tools, network throttling, and more. By using these tools, you can ensure that your website provides a smooth and responsive user experience on all devices.