
In my last post, we created quadratic curves on HTML5 canvas elements using a few lines of code. If you examined the JavaScript on the quadratic curves demonstration page, you may have noticed several references to béziers — its curvier cousin.
What are bézier curves?
You’ve possibly seen bézier curves used in desktop publishing and graphics packages. So let’s take another trip to WolframMathWorld to look at the equations.
I’m sure you understood that but I’m feeling a little nauseous.

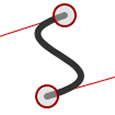
In the last post, we saw how quadratic curves have a start point (P0), end point (P2) and a single control point (P1) which determines the curvature. In the case of canvas, a bézier curve has a start (P0), end (P3) and two control points — one for each end of the line (P1 and P2). Thanks again to Wikipedia for a great illustration.
 Béziers give far more control over the shape. Because the initial part of the curve follows its control path, we can generate curves which reverse direction or wrap on themselves. They are ideal for creating a Visio-like flow diagram where you need to join two shapes by a connector.
On to the code!
Like before, we require a few lines of JavaScript to get the canvas context and set the default widths and colors:
canvas = document.getElementById("canvas");
ctx = canvas.getContext("2d")
ctx.lineWidth = 6;
ctx.strokeStyle = "#333";
We now define the starting point for our curve (P0):
ctx.beginPath();
ctx.moveTo(100, 250);
The bezierCurveTo() method is then used to draw the curve. It requires six arguments:
- the x co-ordinate of the curve start control point (P1)
- the y co-ordinate of the curve start control point (P1)
- the x co-ordinate of the curve end control point (P2)
- the y co-ordinate of the curve end control point (P2)
- the x co-ordinate of the end point (P3)
- the y co-ordinate of the end point (P3)
Finally, we call the stroke() method to complete our curve:
ctx.bezierCurveTo(150, 100, 350, 100, 400, 250);
ctx.stroke();
The interactive canvas bézier curve demonstration page allows you to drag all the points and generate the code (sorry IE fans — you’ll need to wait for IE9).
I hope you found this series useful. Are you using canvas curves for any interesting projects?
Frequently Asked Questions (FAQs) about HTML5 Canvas and Bezier Curves
What is the significance of control points in a Bezier curve?
Control points are crucial in defining the shape and direction of a Bezier curve. In a cubic Bezier curve, there are two control points. The first control point determines the direction and degree of the curve’s start, while the second control point influences the direction and degree of the curve’s end. By manipulating these control points, you can create a wide variety of curve shapes.
How can I draw a quadratic Bezier curve on HTML5 Canvas?
Drawing a quadratic Bezier curve involves using the quadraticCurveTo(cp1x, cp1y, x, y) method. Here, cp1x and cp1y are the coordinates of the control point, while x and y are the coordinates of the end point. This method adds a point to the current path by using the specified control points that represent a quadratic Bezier curve.
Can I draw a Bezier curve with more than two control points?
HTML5 Canvas natively supports only quadratic and cubic Bezier curves, which have one and two control points respectively. However, you can create a Bezier curve with more control points by chaining multiple cubic or quadratic Bezier curves together. This involves setting the start point of the next Bezier curve as the end point of the previous one.
How can I fill the area under a Bezier curve?
To fill the area under a Bezier curve, you need to create a path that includes the curve and the area beneath it. After defining the path, use the fill() method to fill the area. The fill color can be specified using the fillStyle property.
How can I animate a Bezier curve on HTML5 Canvas?
Animating a Bezier curve involves changing the position of the curve over time. This can be achieved by using the requestAnimationFrame() method to create a loop, and then incrementing or decrementing the values of the control points or end points within this loop.
Can I draw a Bezier curve with a gradient color?
Yes, you can draw a Bezier curve with a gradient color by using the createLinearGradient() or createRadialGradient() method to define a gradient, and then setting this gradient as the stroke style before drawing the curve.
How can I determine the length of a Bezier curve?
Calculating the exact length of a Bezier curve can be complex due to its mathematical nature. However, you can approximate the length by dividing the curve into smaller segments and summing the lengths of these segments.
Can I interact with a Bezier curve drawn on HTML5 Canvas?
While HTML5 Canvas does not provide built-in interaction capabilities, you can add interactivity by using JavaScript to track mouse events and manipulate the control points or end points of the Bezier curve based on these events.
How can I erase or remove a Bezier curve from the canvas?
To erase a Bezier curve, you can use the clearRect(x, y, width, height) method to clear the area of the canvas where the curve is drawn. Alternatively, you can redraw the entire canvas without the curve.
Can I save a Bezier curve drawn on HTML5 Canvas as an image?
Yes, you can save the current state of the canvas, including any Bezier curves drawn on it, as an image by using the toDataURL() method. This method returns a data URL representing the image in a format such as PNG or JPEG.