How to Create a Mall Map with Real-time Data Using WRLD

This article was created in partnership with WRLD. Thank you for supporting the partners who make SitePoint possible.
As a web developer, you sometimes find yourself in a position where you are required to implement a map. Your first choice is to use Google Maps, right?
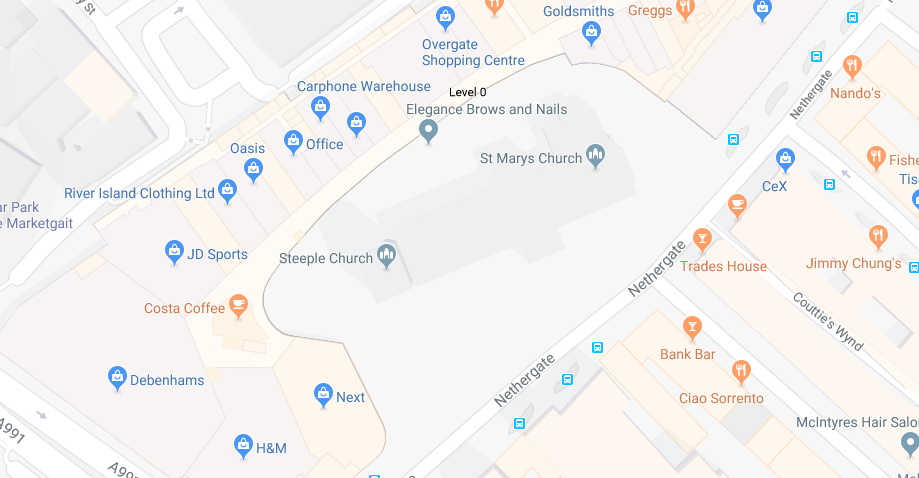
This looks okay. However, you may be required to overlay additional information over the map with the help of markers. You can use this method, or you can find a better solution that allows you to create markers inside an indoor 3D map! How cool is that? With indoor markers, you can provide unique experiences for users where they will be able to access information and interact with UIs right inside the map.
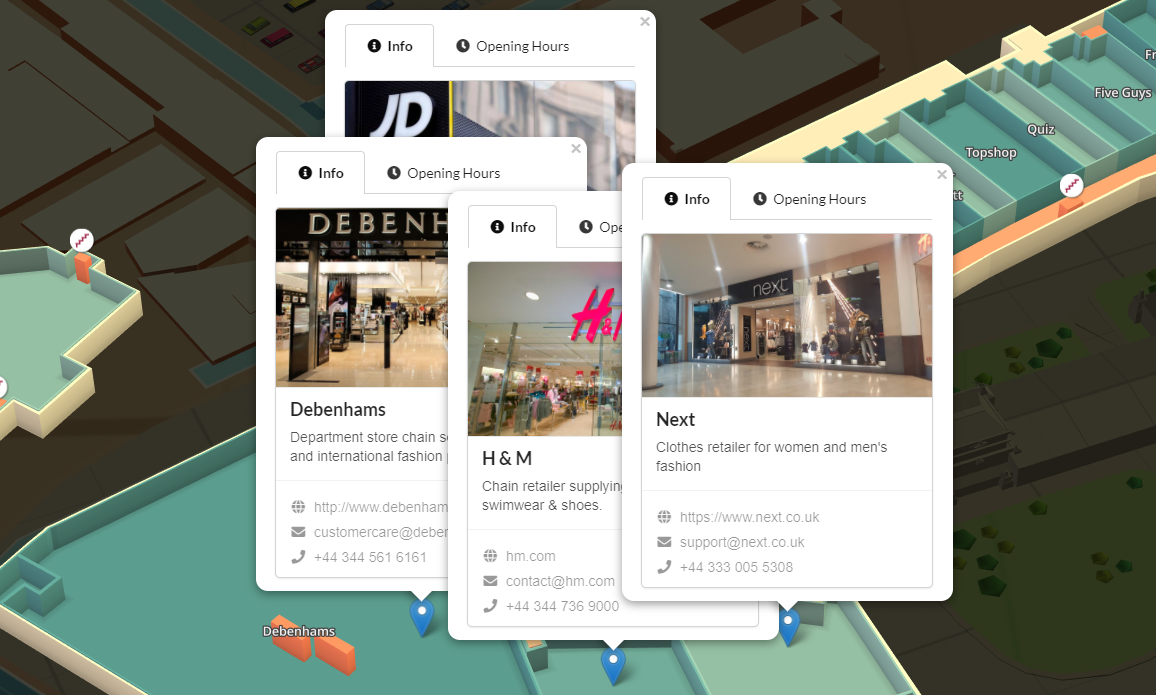
In this tutorial, we’ll create two demos illustrating the power of WRLD maps. You’ll learn how to create custom apps that can overlay real-time information over a 3D map. In the first demo, we’ll add interactive markers to an existing indoor map of a mall. In the second demo, we’ll place colored polygons over parking areas, indicating capacity.
You can find the completed project for both demos in this GitHub repository.
Key Takeaways
- Utilize WRLD to create interactive and real-time 3D mall maps, enhancing user experience with dynamic store information and navigation features.
- Begin by setting up the project environment, including acquiring an API key from WRLD and preparing your development tools.
- Choose between using WRLD’s built-in tools for a code-free setup or develop custom applications for greater flexibility and feature integration.
- Implement indoor map controls to facilitate easy navigation between different floors and areas within the mall.
- Automatically enter indoor views on map load to streamline user interactions and improve accessibility.
- Develop custom store cards using real-time data to display detailed information about each store, including promotions and availability.
- Highlight parking availability using colored polygons to indicate different occupancy levels, providing a valuable tool for visitors.
Prerequisites
For this article, you only need to have a fundamental understanding of the following topics:
I’ll assume this is your first time using WRLD maps. However, I do recommend you at least have a quick read of the article:
You’ll also need a recent version of Node.js and npm installed on your system (at the time of writing, 8.10 LTS is the latest stable version). For Windows users, I highly recommend you use Git Bash or any other terminal capable of handling basic Linux commands.
This tutorial will use yarn for package installation. If you prefer to use npm, please refer to this guide if you are unfamiliar with yarn commands.
Acquire an API Key
Before you get started, you’ll need to create a free account on WRLD. Once you’ve logged in and verified your email address, you’ll need to acquire an API key. For detailed instructions on how to acquire one, please check out the Getting Started section on Building Dynamic 3D Maps where it’s well documented.
Approach to Building the Map
The creation of WRLD maps is a major technological achievement with great potential benefits for many industries. There are two main ways of expanding the platform’s capabilities:
- Using built-in tools, e.g. Map Designer and Places Designer
- Building a custom app
Let me break down how each method can be used to achieve the desired results.
1. Using Map Designer and Places Designer
For our first demo, we can use Places Designer to create Store Cards. This will require us to create a Collection Set where all Point of Interest markers will be held. This set can be accessed both within the WRLD ecosystem, and externally via the API key. We can pass this data to a custom map created using the Map Designer. With this tool, we can share the map with others using its generated link. If you would like to learn more about the process, please watch the video tutorials on this YouTube playlist.
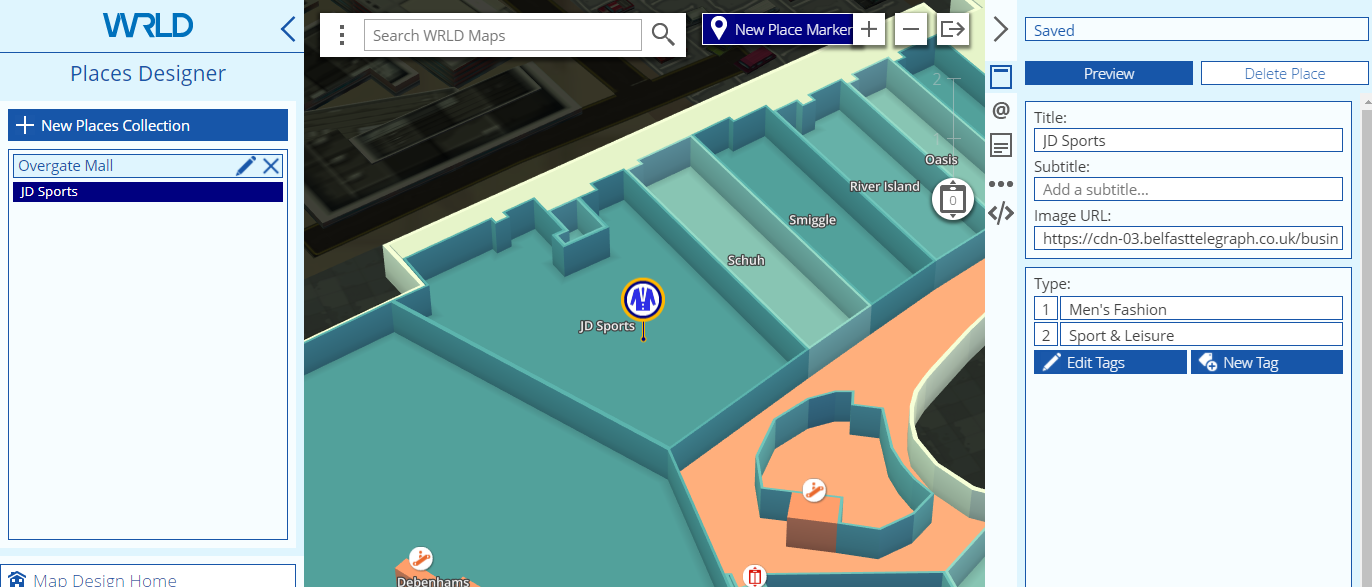
The beauty of this method is that no coding is required. However, in our case, it does have limitations:
- Restrictive UI design – we can only use the UI that comes with Places Designer
- Restrictive data set – we can’t display additional information beyond what is provided
In order to overcome these limitations, we need to approach our mall map challenge using the second method.
2. Building a Custom App
Building custom apps is the most flexible option. Although it takes some coding effort, it does allow us to comprehensively tap into the wealth of potential provided by the WRLD platform. By building a custom app, we can create our own UI, add more fields and access external databases in real-time. This is the method that we’ll use for this tutorial.
Building the App
Let’s first create a basic map, to which we’ll add more functionality later. Head over to your workspace directory and create a new folder for your project. Let’s call it mall-map.
Open the mall-map folder in your code editor. If you have VSCode, access the terminal using Ctrl + ` and execute the following commands inside the project directory:
# Initialize package.json
npm init -f

# Create project directories
mkdir src
mkdir src/js src/css

# Create project files
touch src/index.html
touch src/js/app.js
touch src/css/app.css
touch env.js
This is how your project structure should look:
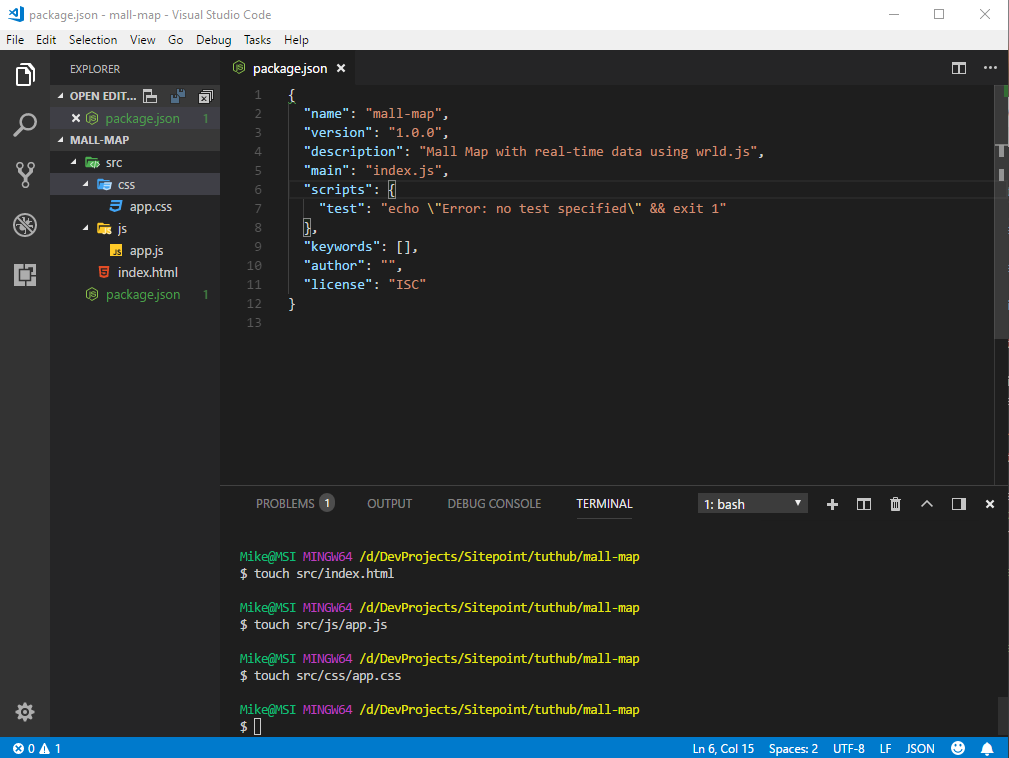
Now that we have our project structure in place, we can begin writing code. We’ll start with index.html. Insert this code:
<!DOCTYPE html>
<html lang="en">
<head>
  <meta charset="UTF-8">
  <meta name="viewport" content="width=device-width, initial-scale=1.0">
  <meta http-equiv="X-UA-Compatible" content="ie=edge">
  <link rel="stylesheet" href="./css/app.css" />
  <title>Shopping Mall</title>
</head>
<body>
  <div id="map"></div>
  <script src="js/app.js"></script>
</body>
</html>
Next, let’s work on css/app.css. I’m providing the complete styling for the entire project so that we don’t have to revisit this file again. In due time you’ll understand the contents as you progress with the tutorial.
@import "https://cdnjs.cloudflare.com/ajax/libs/leaflet/1.0.1/leaflet.css";
@import "https://cdn-webgl.wrld3d.com/wrldjs/addons/resources/latest/css/wrld.css";
@import "https://cdnjs.cloudflare.com/ajax/libs/semantic-ui/2.3.0/semantic.min.css";

html,
body {
  margin: 0;
  padding: 0;
  width: 100%;
  height: 100%;
}

#map {
  width: 100%;
  height: 100%;
  background-color: #000000;
}

/* -------- POPUP CONTENT -------- */
.main-wrapper > .segment {
  padding: 0px;
  width: 300px;
}

.contacts > span {
  display: block;
  padding-top: 5px;
}
Now we need to start writing code for app.js. However, we need a couple of node dependencies:
yarn add wrld.js axios
As mentioned earlier, we’ll be taking advantage of modern JavaScript syntax to write our code. Hence, we need to use babel to compile our modern code to a format compatible with most browsers. This requires installing babel dependencies and configuring them via a .babelrc file. Make sure to install them as dev-dependencies.
yarn add babel-core babel-plugin-transform-runtime babel-runtime --dev
touch .babelrc
Copy this code to the .babelrc file:
{
  "plugins": [
    [
      "transform-runtime",
      {
        "polyfill": false,
        "regenerator": true
      }
    ]
  ]
}
We’ll also need the following packages to run our project:
- Parcel bundler – it’s like a simplified version of webpack with almost zero configuration
- JSON Server – for creating a dummy API server
Install the packages globally like this:
yarn global add parcel-bundler json-server

# Alternative command for npm users
npm install -g parcel-bundler json-server
That’s all the node dependencies we need for our project. Let’s now write some JavaScript code. First, supply your WRLD API key in env.js:
module.exports = {
  WRLD_KEY: '<put api key here>',
 };
Then open js/app.js and copy this code:
const Wrld = require('wrld.js');
const env = require('../../env');

const keys = {
  wrld: env.WRLD_KEY,
};

window.addEventListener('load', async () => {
  const map = await Wrld.map('map', keys.wrld, {
    center: [56.459733, -2.973371],
    zoom: 17,
    indoorsEnabled: true,
  });
});
The first three statements are pretty obvious. We’ve put all our code inside the window.addEventListener function. This is to ensure our code is executed after the JavaScript dependencies, that we’ll specify later in index.html, have loaded. Inside this function, we’ve initialized the map by passing several parameters:
map– the ID of the div container we specified inindex.htmlkeys.wrld– API keycenter– latitude and longitude of the Overgate Mall located in Dundee, Scotlandzoom– elevationindoorsEnabled– allow users to access indoor maps
Let’s fire up our project. Go to your terminal and execute:
parcel src/index.html
Wait for a few seconds for the project to finish bundling. When it’s done, open your browser and access localhost:1234. Depending on your Internet speed, the map shouldn’t take too long to load.
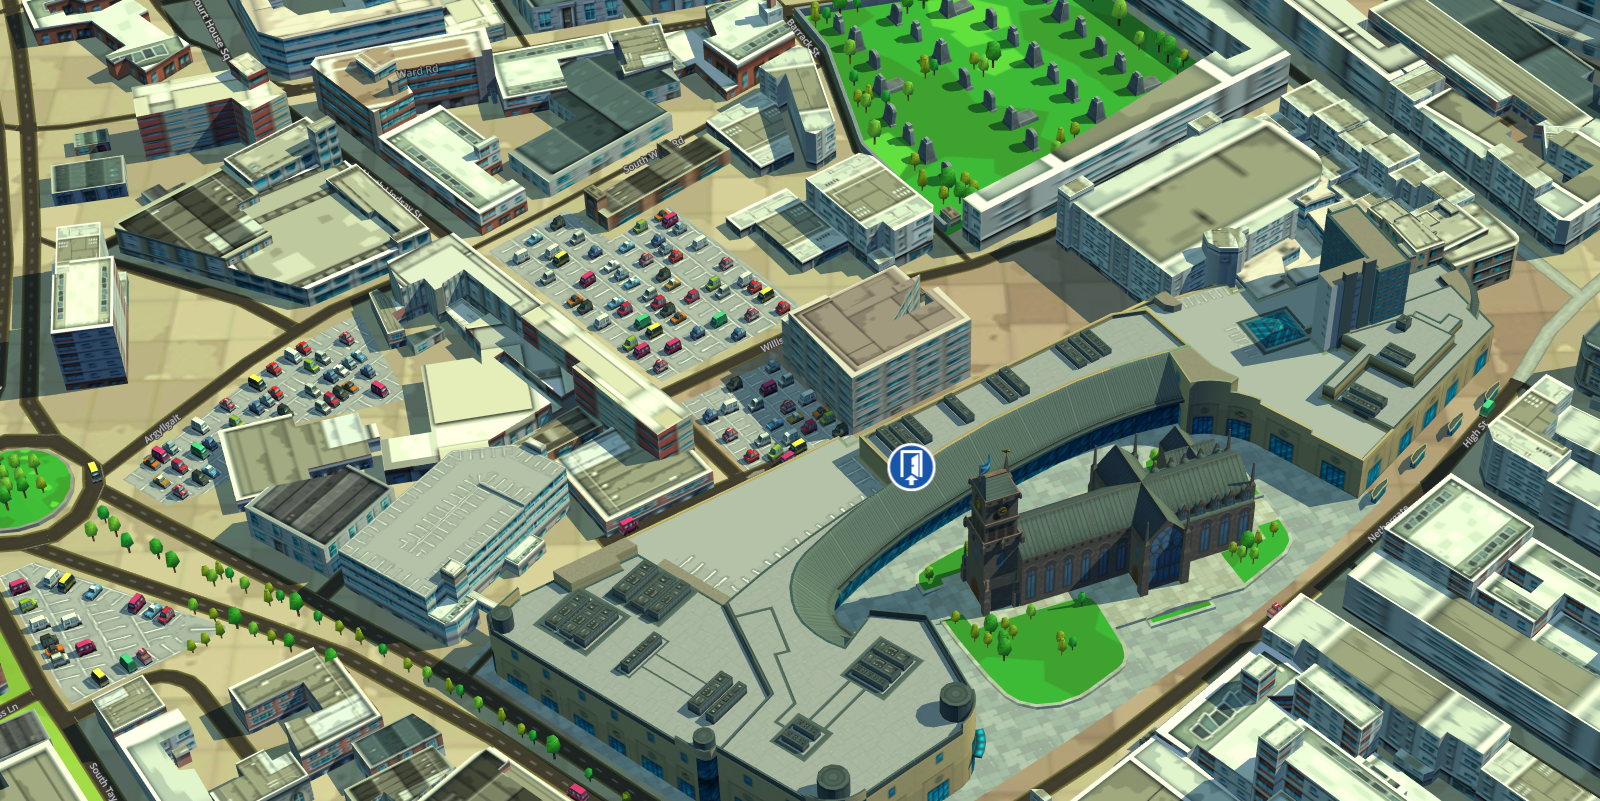
Beautiful, isn’t it? Feel free to click the blue icon. It will take you indoors. Navigate around to see the different stores. However, you’ll soon realize that you can’t access other floors. There’s also no button for exiting the indoor map. Let’s fix that in the next chapter.
Create Indoor Controls
To allow users to switch between different floors, we’ll provide them with a control widget that will allow them to do this. Simply add the following scripts to the head section of the public/index.html file:
<script src="https://cdnjs.cloudflare.com/ajax/libs/jquery/3.3.1/jquery.js"></script>
<script src="https://cdnjs.cloudflare.com/ajax/libs/jqueryui/1.12.1/jquery-ui.min.js"></script>
<script src="https://cdn-webgl.wrld3d.com/wrldjs/addons/indoor_control/latest/indoor_control.js"></script>
Still within the html file, add this div in the body section, right before the #map div:
<div id="widget-container" class="wrld-widget-container"></div>
Now let’s update js/app.js to initialize the widget. Place this code right after the map initialization section:
const indoorControl = new WrldIndoorControl('widget-container', map);
Now refresh the page, and click the ‘Enter Indoors’ icon. You should have a control widget that will allow you to switch between floors. Just drag the control up and down to fluidly move between floors.
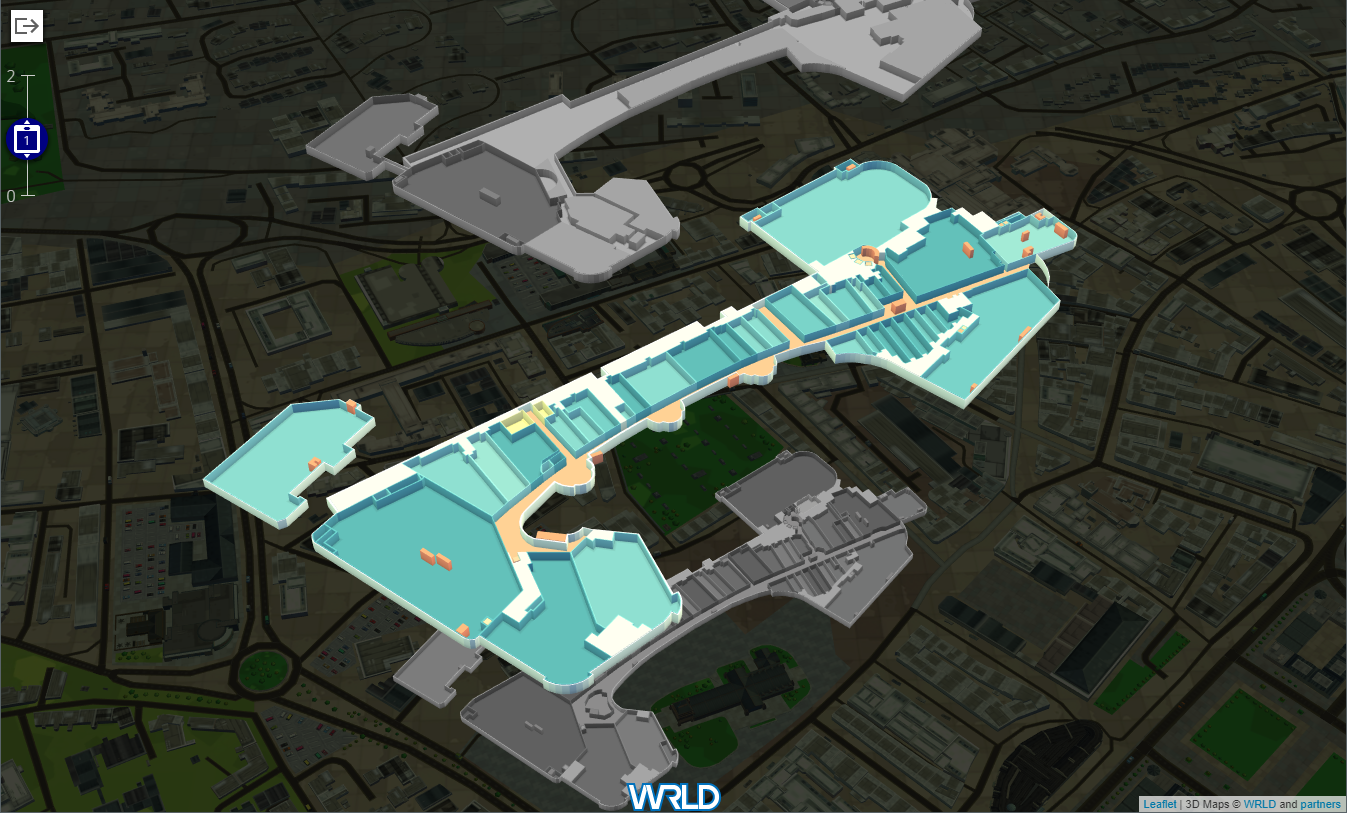
Amazing, isn’t it? Now let’s see how we can make our map a little bit more convenient for our users.
Enter Indoors Automatically
Don’t you find it a bit annoying that every time we need to test our map, we need to click the ‘Indoors’ icon? Users may start navigating to other locations which is not the intention of this app. To fix this, we need to navigate indoors automatically when the app starts without any user interaction. First, we require the indoor map id to implement this feature. We can find this information from the indoormapenter event. You can find all Indoor related methods here.
Add the following code in the js/app.js file.
...
// Place this code right after the Wrld.map() statement
map.indoors.on('indoormapenter', async (event) => {
  console.log(event.indoorMap.getIndoorMapId());
});
...
Refresh the page then check out your console. You should get this ID printed out: EIM-e16a94b1-f64f-41ed-a3c6-8397d9cfe607. Let’s now write the code that will perform the actual navigation:
const indoorMapId = 'EIM-e16a94b1-f64f-41ed-a3c6-8397d9cfe607';

map.on('initialstreamingcomplete', () => {
  map.indoors.enter(indoorMapId);
});
After saving the file, refresh the page and see what happens.
The indoor mall map should navigate automatically. Next, we’ll look at how we can create cards for each store. But first, we need to determine where to source our data.
Mall Map Planning
To create store cards for our map, we need several items:
- Exact Longitude/Latitude coordinates of a store
- Store contact information and opening hours
- Design template for the store card
Store Card Coordinates
To acquire Longitude/Latitude coordinates, we need to access maps.wrld3d.com. Wait for the map to finish loading then enter the address 56.459733, -2.973371 in the search box. Press enter and the map will quickly navigate to Overgate Mall. Click the blue indoor icon for Overgate Mall and you should be taken to the mall’s indoor map. Once it’s loaded, locate the ‘Next’ store and right-click to open the context menu. Click the ‘What is this place? option. The coordinate popup should appear.
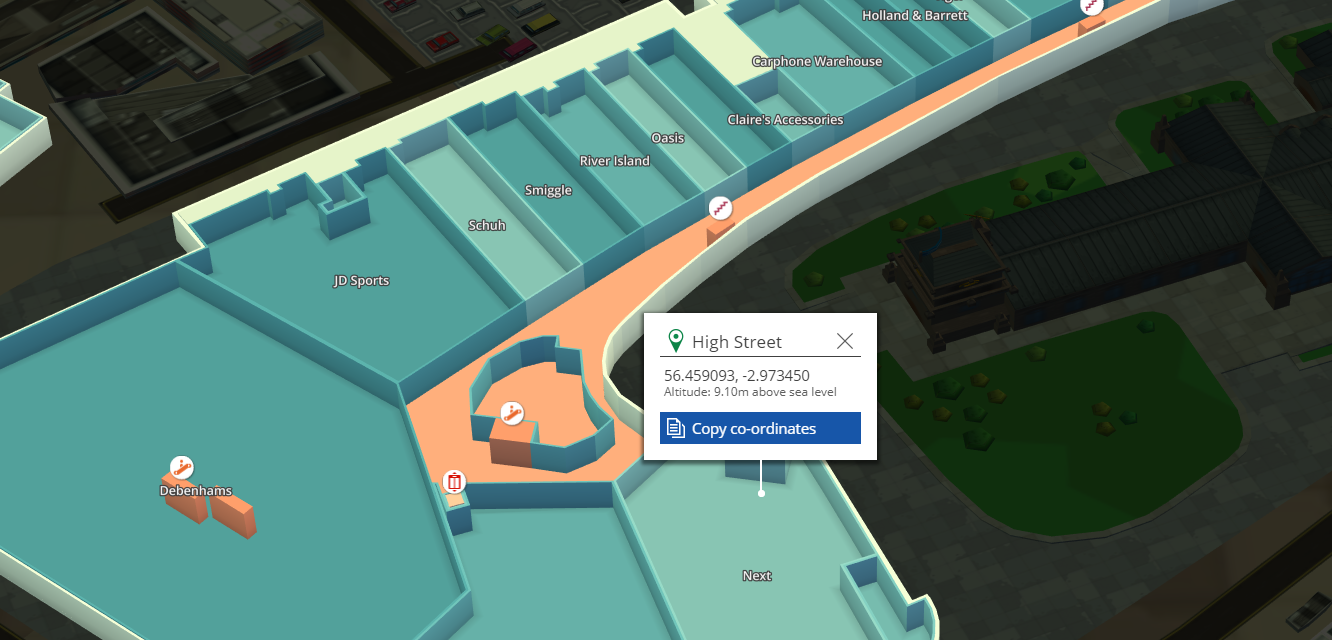
Click the ‘Copy Coordinate’ button. This will give you the exact longitude/latitude coordinates of the store. Save this location address somewhere temporarily.
Store Card Information
You’ll also need to gather contact information from each store which includes:
- image
- description
- phone
- web
- opening times
You can source most of this information from Google. Luckily, I’ve already collected the data for you. For this tutorial, we’ll only deal with four stores on the ground floor. To access the information, just create a folder at the root of the project and call it data. Next save this file from GitHub in the data folder. Make sure to save it as db.json. Here is a sample of the data we’ll be using:
{
  "id":1,
  "title": "JD Sports",
  "lat": 56.4593425,
  "long": -2.9741433,
  "floor_id": 0,
  "image_url": "https://cdn-03.belfasttelegraph.co.uk/business/news/...image.jpg",
  "description":"Retail chain specialising in training shoes, sportswear & accessories.",
  "phone": "+44 138 221 4545",
  "email": "customercare@jdsports.co.uk",
  "web": "https://www.jdsports.co.uk/",
  "twitter": "@jdhelpteam",
  "tags": "sports shopping",
  "open_time":[
    { "day": "Mon",
      "time": "9:30am - 6:00pm"
    },]
}
The data is stored in an array labeled ‘pois’. POI stands for Places of Interest. Now that we have the data available, we can easily make it accessible via an API REST point by running the JSON server. Just open a new terminal and execute the command:
json-server --watch data/db.json
It should take a few seconds for the API to start. Once it’s fully loaded, you can test it with your browser at localhost:3000/pois. You can also fetch a single POI using this syntax:
- localhost:3000/pois/{id}
For example, localhost:3000/pois/3 should return a poi record with ID 3 in JSON format.
Store Card Design
We’ll use a clean elegant theme to neatly display contact information and opening times using a couple of tabs. We’ll create markers that will display a popup when clicked. This popup will have the following UI.
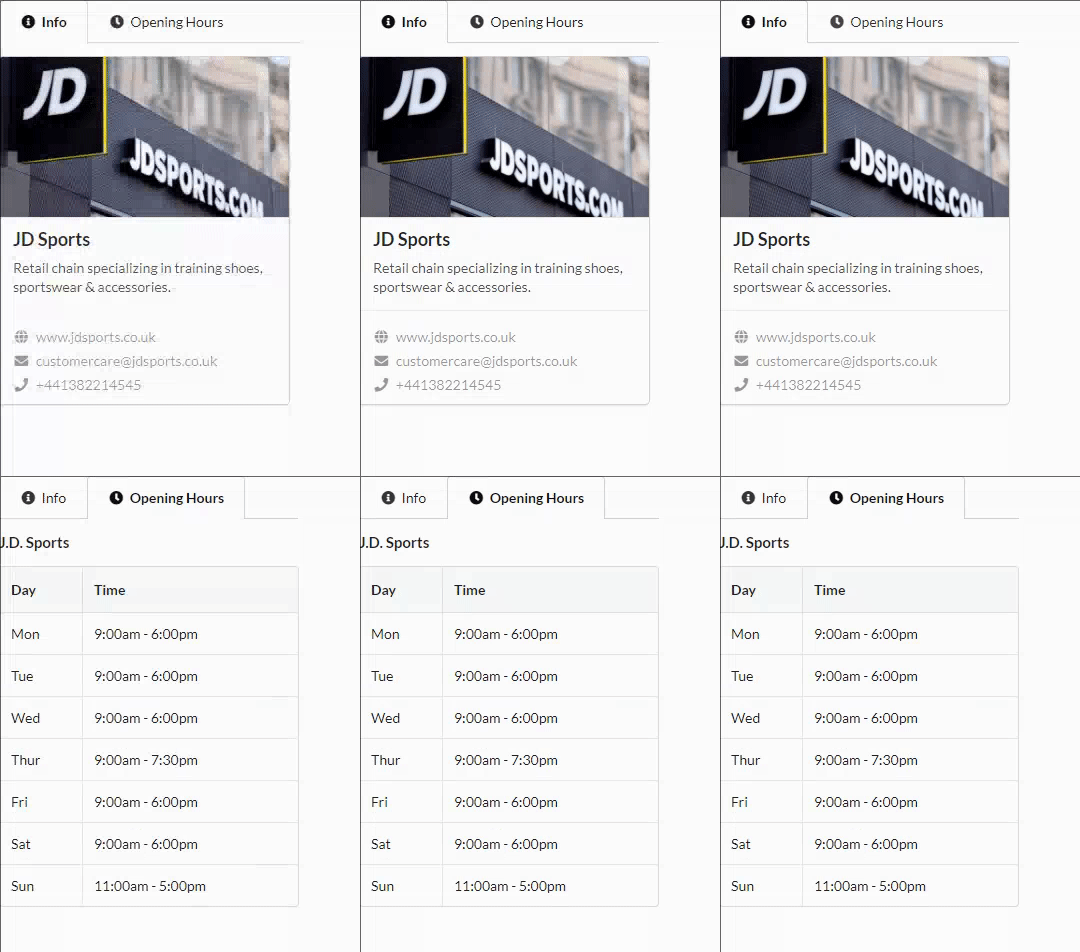
The code for this HTML design is a bit long to put here. You can view and download the file from this link. The design only has three dependencies:
- Semantic UI CSS
- jQuery
- Semantic UI JS
Now that we have the data required and the design, we should be ready to start working on our indoor map.
Implementing Store Cards in Indoor Map
First let’s create a service that will allow us to access data from the JSON REST APIs. This data will be used for populating the Store Cards with the necessary information. Create the file js/api-service.js and copy this code:
const axios = require('axios');

const client = axios.create({
  baseURL: 'http://127.0.0.1:3000',
  timeout: 1000,
});

module.exports = {
  getPOIs: async () => {
    try {
      const response = await client.get('/pois');
      return response.data;
    } catch (error) {
      console.error(error);
    }
    return [];
  },
  getPOI: async (id) => {
    try {
      const response = await client.get(`/pois/${id}`);
      return response.data;
    } catch (error) {
      console.error(error);
    }
    return {};
  },
}
Here we are making use of the library axios to request data from the JSON server.
Next, we’ll convert our static HTML design for the Store Card to a format that will allow us to render data. We’ll be using JsRender for this. We’ll break down our static design into three templates:
- Base Template – has containers for menu, info and time tabs.
- Info Template – tab for store contact information.
- Time Template – tab for store opening hours.
First, open index.html and add these scripts to the head section, right after the jQuery and indoor control scripts:
<head>
  ...
  <script src="https://cdnjs.cloudflare.com/ajax/libs/jsrender/0.9.90/jsrender.min.js"></script>
  <script src="https://cdnjs.cloudflare.com/ajax/libs/semantic-ui/2.3.0/semantic.min.js"></script>
  ...
</head>
Next, copy this section of code right before the widget-container div:
  ...
  <!-- Menu Tabs UI -->
 <script id="baseTemplate" type="text/x-jsrender">
    <div class="main-wrapper">
      <div class="ui compact basic segment">
        <div class="ui menu tabular"> </div>
        <div id="infoTab" class="ui tab active" data-tab="Info"></div>
        <div id="timeTab" class="ui tab" data-tab="Time"></div>
      </div>
    </div>
  </script>

  <!-- Info Data Tab -->
  <script id="infoTemplate" type="text/x-jsrender">
    <div class="ui card">
      <div class="image">
        <img src={{:image_url}}>
      </div>
      <div class="content">
        <div class="header">{{:title}}</div>
        <div class="description">
          {{:description}}
        </div>
      </div>
      <div class="extra content contacts">
        <span>
          <i class="globe icon"></i>
          <a href="{{:web}}" target="_blank">{{:web}}</a>
        </span>
        <span>
          <i class="mail icon"></i>
          {{:email}}
        </span>
        <span>
          <i class="phone icon"></i>
          {{:phone}}
        </span>
      </div>
    </div>
  </script>

  <!-- Opening Times Data Tab -->
  <script id="timeTemplate" type="text/x-jsrender">
    <table class="ui celled table">
      <thead>
        <tr>
          <th>Day</th>
          <th>Time</th>
        </tr>
      </thead>
      <tbody>
        {{for open_time}}
        <tr>
          <td>{{:day}}</td>
          <td>{{:time}}</td>
        </tr>
        {{/for}}
      </tbody>
    </table>
  </script>
  ...
This is how the full code for index.html should look.
Next, let’s create another service that will manage the creation of Popups. Create the file js/popup-service.js and copy this code:
const Wrld = require('wrld.js');
const { getPOI } = require('./api-service');

const baseTemplate = $.templates('#baseTemplate');
const infoTemplate = $.templates('#infoTemplate');
const timeTemplate = $.templates('#timeTemplate');

const popupOptions = {
  indoorMapId: 'EIM-e16a94b1-f64f-41ed-a3c6-8397d9cfe607',
  indoorMapFloorIndex: 0,
  autoClose: true,
  closeOnClick: true,
  elevation: 5,
};
Let me explain each block step by step:
- Block 1: WRLD is required for creating the
Popup,getPOIfunction is required for fetching data - Block 2: The templates that we discussed earlier are loaded using
jsrender - Block 3: Parameters that will be passed during
Popupinstantiation. Here is the reference documentation.
Next, let’s add tab menus that will be used for switching tabs. Simply add this code to js/popup-service.js:
const createMenuLink = (linkName, iconClass) => {
  const link = document.createElement('a');
  link.className = 'item';
  const icon = document.createElement('i');
  icon.className = `${iconClass} icon`;
  link.appendChild(icon);
  link.appendChild(document.createTextNode(` ${linkName}`));
  link.setAttribute('data-tab', linkName);
  link.addEventListener('click', () => {
    $.tab('change tab', linkName);
    $('.item').toggleClass('active');
  });
  return link;
};

const createMenu = (menuParent) => {
  const infoLink = createMenuLink('Info', 'info circle');
  infoLink.className += ' active';
  menuParent.appendChild(infoLink);
  const timeLink = createMenuLink('Time', 'clock');
  menuParent.appendChild(timeLink);
};
You might be wondering why we are using a complicated method of creating menu links. Ideally, we should be able to create them using HTML, then add a small JavaScript script to activate the tabs. Unfortunately, this doesn’t work within the context of a Popup. Instead, we need to create clickable elements using DOM manipulation methods.
Next, add this code to complete the base content section:
const buildBaseContent = () => {
  const htmlOutput = baseTemplate.render({});
  const parent = $.parseHTML(htmlOutput)[1];
  const menuParent = parent.childNodes[1].childNodes[1];
  createMenu(menuParent);
  return parent;
};

const baseContent = buildBaseContent();
Here, we are rendering out the base template into HTML. Then we convert it into DOM to enable us to attach our DOM menu. We then call out the buildBaseContent() function to create our base DOM which we shall later attach content to for the info and time tabs.
In the next section, we are going to create a function called showPopup. We’ll later create Markers for each store. When a user clicks on a Marker, a Popup will appear containing the Store Card. Add this code to js/popup-service.js:
// Clear existing tab content before adding another
const clearTab = (tab) => {
  while (tab.firstChild) {
    tab.removeChild(tab.firstChild);
  }
};

module.exports = {
  showPopup: async (event) => {
    // Fetch co-ordinates and map objects from event
    const latlang = event.target._latlng;
    const map = event.target._map;
    // Create an instance of Popup
    const popup = Wrld.popup(popupOptions)
      .setLatLng(latlang);
    try {
      // Fetch data from api-service
      const poi = await getPOI(event.target.options.id);
      // Bind data with templates to render html outputs
      const infoHTML = infoTemplate.render(poi);
      const timeHTML = timeTemplate.render(poi);
      // Convert HTML outputs to DOM objects
      const infoDOM = $.parseHTML(infoHTML)[1];
      const timeDOM = $.parseHTML(timeHTML)[1];
      // Populate Tabs with DOM objects
      const infoTab = baseContent.childNodes[1].childNodes[3];
      clearTab(infoTab); // Clear existing content if any
      infoTab.appendChild(infoDOM);
      const timeTab = baseContent.childNodes[1].childNodes[5];
      clearTab(timeTab); // Clear existing content if any
      timeTab.appendChild(timeDOM);

      // Populate popup with DOM content
      popup.setContent(baseContent);
      // Display the popup
      popup.addTo(map);
      // Navigate map to properly view the Popup
      map.setView(latlang, 18);
    } catch (error) {
      popup.setContent('Oops! Something went wrong');
      popup.addTo(map);
    }
  },
};
There’s a lot going on here. I’ve inlined the code with comments explaining what each section does. If you have any doubts on how the completed code should look, you can view it from this link.
Next we need to create Markers for each POI that is defined in db.json. Each marker will have a click event listener, which will trigger the showPopup() function. Update js/app.js as follows:
..
const { getPOIs } = require('./api-service');
const { showPopup } = require('./popup-service');
...

// Place within window.addEventListener('load')
const placeMarkers = (pois) => {
  let marker;
  pois.forEach((poi) => {
    const latlang = [poi.lat, poi.long];
    marker = Wrld.marker(latlang, {
      id: poi.id,
      title: poi.title,
      indoorMapId,
      indoorMapFloorId: 1,
    }).addTo(map);
    marker.on('click', showPopup);
  });
};

map.indoors.on('indoormapenter', async (event) => {
  if (event.indoorMap.getIndoorMapId() === indoorMapId) {
    // Center map properly when indoors
    map.indoors.setFloor(0);
    map.setView([56.459342, -2.9741433], 18);

    // Create markers for each store.
    const pois = await getPOIs();
    placeMarkers(pois);
  }
});
Take note that we’re passing the POI ID to the marker via the Options object parameter. If you refer back to the showPopup function, you’ll see we are extracting this id via the event object. If in doubt about how the complete code should look, view it from this link.
Now it’s time to test our code. I’ll assume you still have the JSON server running in the background. If you not, please refer back on how to run it. Let’s also start the parcel bundler. Once it’s started, refresh your browser in case it hasn’t. You should now have multiple markers available for you to click. Clicking a marker will result in a popup like this:
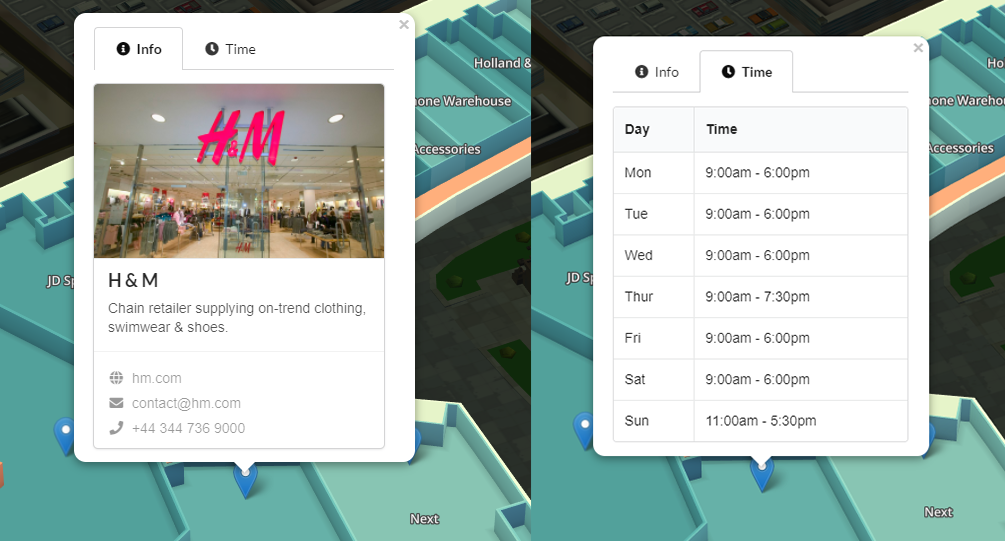
The above demo illustrates how Store Cards work for an indoor map. Now, let’s look at another Wrld.js feature where we can overlay parking availability information over multiple parking areas.
Parking Availability
Have you ever been stressed out looking for a parking spot? Well, let’s try to see if we can fix this problem. We are going to use WRLD maps to highlight parking areas. We’ll use different colors to indicate the status of each parking area:
- green: parking space available
- yellow: 80% of parking space occupied
- red: 100% of parking space occupied
Of course you can define more color codes to provide more detailed levels of parking space. However, remember that people might be in a hurry and they need to process this information within milliseconds. Let’s start creating this map one step at a time.
1. Positioning Map for Parking Zones
Let’s start by creating parking.html and js/parking.js. We’ll run this solution independent of the mall map logic. Once you have created the HTML file, copy this code:
<!DOCTYPE html>
<html lang="en">
<head>
  <meta charset="UTF-8">
  <meta name="viewport" content="width=device-width, initial-scale=1.0">
  <meta http-equiv="X-UA-Compatible" content="ie=edge">
  <link rel="stylesheet" href="./css/app.css" />
  <title>Parking Availability</title>
</head>
<body>
  <div id="map"></div>

  <script src="js/parking.js"></script>
</body>
</html>
Next, copy this code for js/parking.js:
const Wrld = require('wrld.js');
const env = require('../../env');

const keys = {
  wrld: env.WRLD_KEY,
};

window.addEventListener('load', async () => {
  // Create map instance
  const map = await Wrld.map('map', keys.wrld, {
    center: [56.460087, -2.975432],
    zoom: 17.5,
  });
});
Now let’s run our code. We’ll use parcel for this. Stop existing parcel instances first with Ctrl + C. To start the parking demo, execute:
parcel src/parking.html
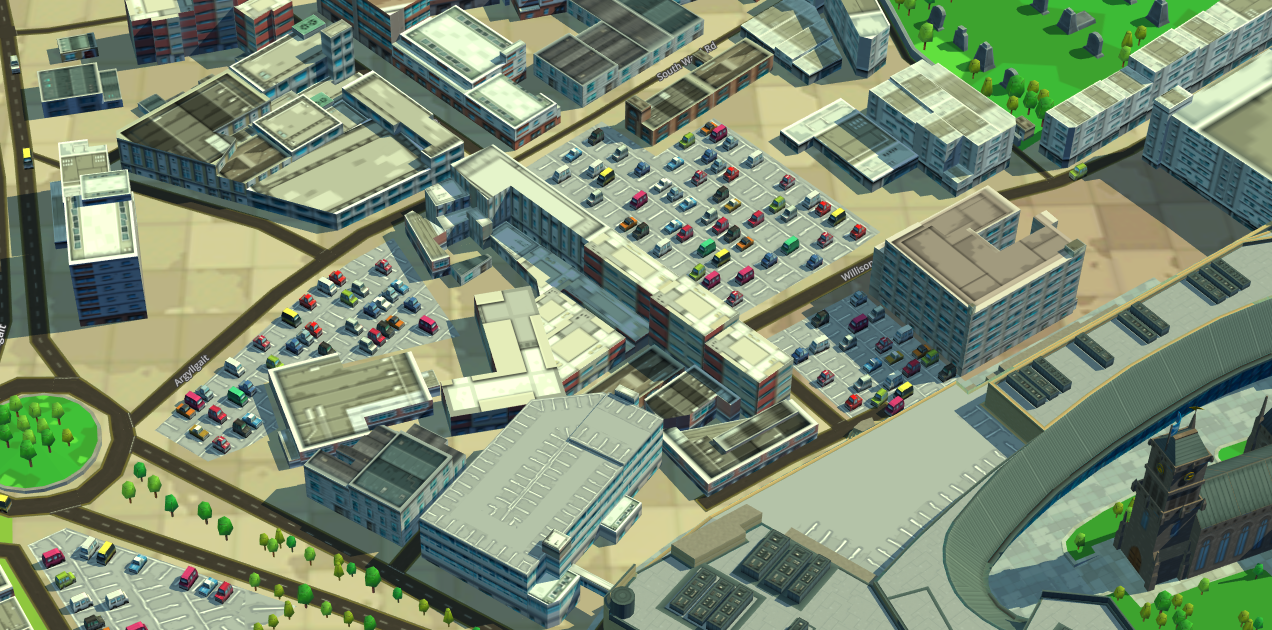
Wait for parcel to finish compiling. Once it’s done, navigate to localhost:1234. You should have the following view of the parking areas:
2. Highlighting Parking
Let’s now learn how to highlight an area using a Polygon instance. First, we’ll need to collect coordinates for each corner of the area we need to highlight. We can do this by visiting maps.wrld3d.com and searching for Overgate in order to locate the parking areas. Zoom in towards the parking section and use the middle mouse button to adjust the tilt of the camera such that you can view straight down. This will make it easy to accurately place mouse clicks. Next, pick one of the parking zones and right-click any corner. Click ‘What is this place?’:
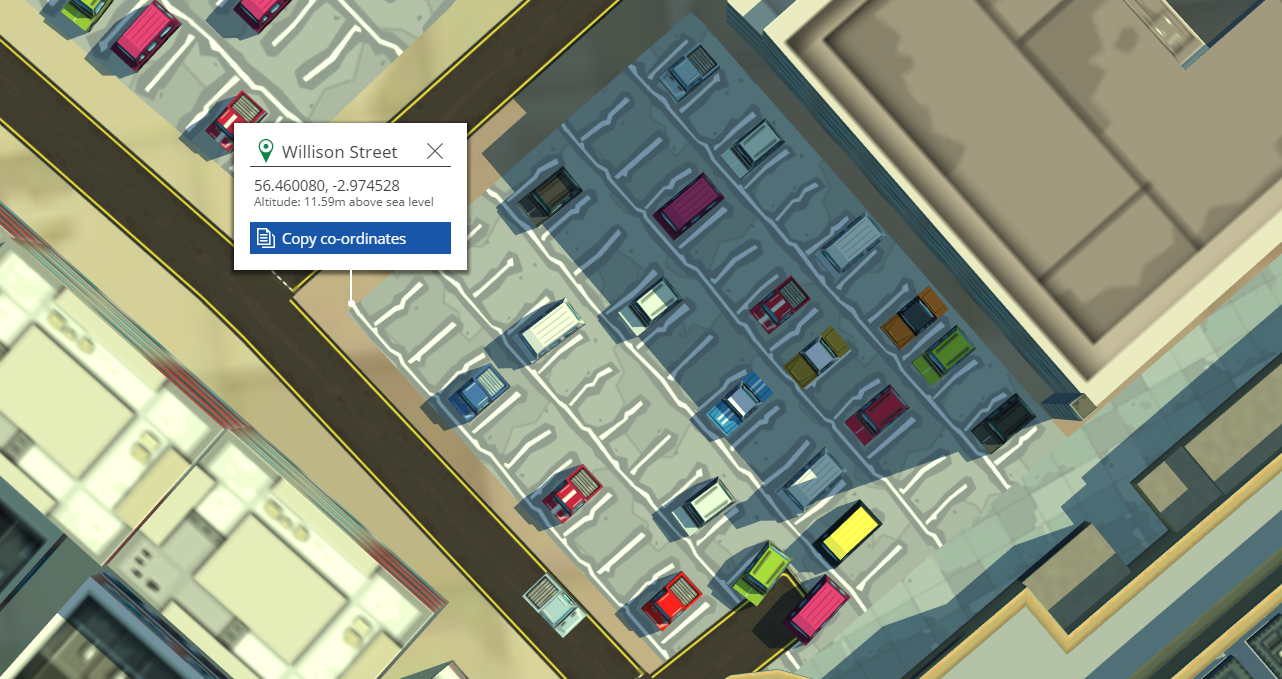
Click the copy coordinates and save it somewhere. You should get the Longitude and Latitude coordinates of the point you clicked.
- 56.460080, -2.974528
Do this for each corner. Next use this data to construct a Polygon instance. Here is an example that has been added to js/parking.js. Place this code right after the map initialization statement.
  const polygonPoints1 = [
    [56.459857, -2.974004],
    [56.459889, -2.974036],
    [56.459836, -2.974188],
    [56.460079, -2.974526],
    [56.460254, -2.974096],
    [56.459954, -2.973698]];
  const parking1 = Wrld.polygon(polygonPoints1).addTo(map);
Refresh localhost:1234 in case it hasn’t. You should now have this view:
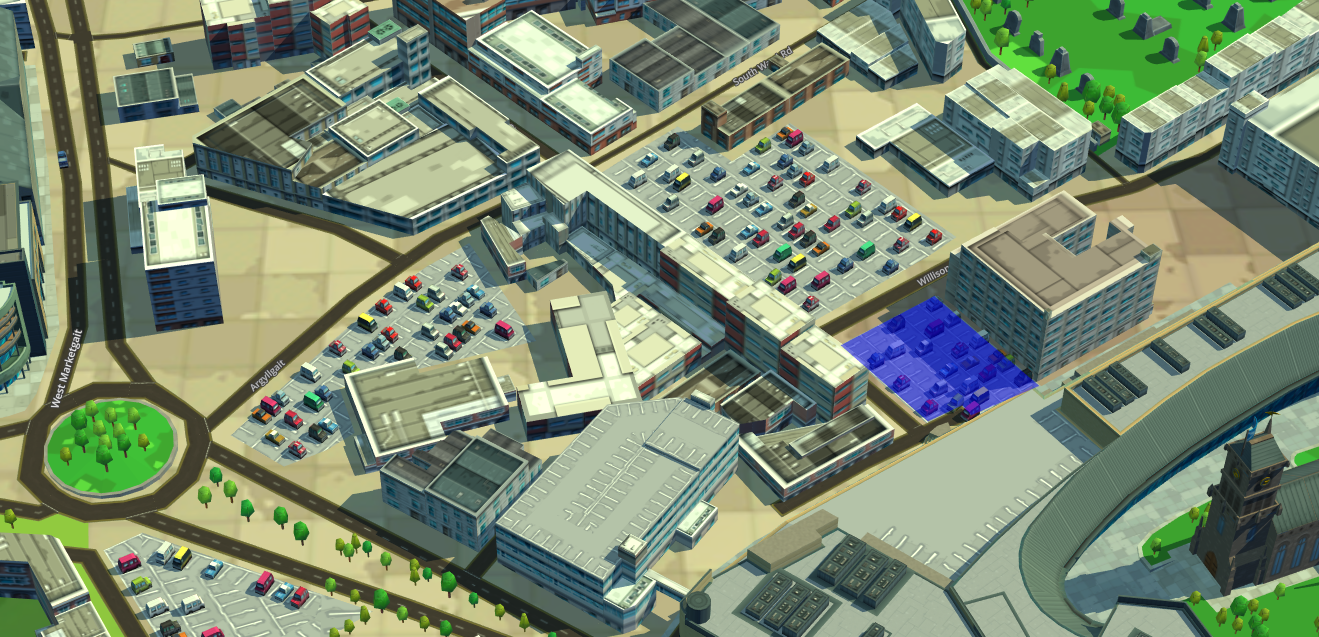
Now that we’ve learnt to do the highlighting, we should collect coordinates for each parking zone we are interested in. We also need a way of keeping this data away from our code which we shall look into next. But first, delete this section of code as we’ll replace it with something better.
3. Rest API for Parking Data
We’ll make use of the JSON server database to store all parking co-ordinates. Lucky for you, I have already collected this data and placed them in db.json. Here is an example of data for one parking zone:
{
      "id": 1,
      "name" : "parking 1",
      "polygonPoints": [
        [
          56.459837,
          -2.973982
        ],
        [
          56.459952,
          -2.973691
        ],
        [
          56.460256,
          -2.974093
        ],
        [
          56.460079,
          -2.974530
        ],
        [
          56.459832,
          -2.974188
        ],
        [
          56.459888,
          -2.974035
        ]
      ],
      "totalSlots": 55,
      "usedSlots": 55
    },
Take note that there’s a rough estimate of the total number of parking slots available. I’ve also made a guess on used parking slots, which we’ll later get to play around with. The db.json file that you copied earlier already has this data. Now that we have the data for parking areas available, we should create a helper service for fetching this information. We simply need to update js/api-service with a new function. Copy this code and place it right after the last get function within module.exports:
 getParkingAreas: async () => {
    try {
      const url = id ? `/parkingAreas/${id}` : '/parkingAreas';
      const response = await client.get(url);
      return response.data;
    } catch (error) {
       console.error(error);
    }
    return [];
  },
This function is designed to handle both fetching all Parking Areas records, or just a single record depending on whether the ID field is populated. Let’s now look at how we can pull this data from the JSON server and overlay it on the map.
3. Color Coding Parking Zones
Update js/parking.js with these color codes. Place this code after the keys declaration.
// Color Codes
const fullColor = [255, 0, 0, 128]; // Completely full, 100%
const almostColor = [255, 165, 0, 128]; // Few parking slots left, 80% full
const availableColor = [0, 255, 0, 128]; // Plenty of parking space available

const getColorCode = (parkingArea) => {
  const occupied = (parkingArea.usedSlots / parkingArea.totalSlots) * 100;
  if (occupied === 100) {
    return fullColor;
  } else if (occupied >= 80) {
    return almostColor;
  }
  return availableColor;
};
The color codes are simply arrays representing values for rgba i.e. red, green, blue and alpha. There is also the function getColorCode that determines which color code to use based on the percentage of used slots. Next, let’s pull the Parking Areas data from the JSON server, and create a Polygon instance for each record:
  // Place this at the top after other imports
  const { getParkingAreas } = require('./api-service');
  const parkPolys = [];
  ....
  // Place after `map` function
  map.on('initialstreamingcomplete', async () => {
    // Highlight Parking Areas
    const parkingAreas = await getParkingAreas();
    parkingAreas.forEach((parkingArea) => {
      const colorCode = getColorCode(parkingArea);
      const poly = Wrld.polygon(parkingArea.polygonPoints, { color: colorCode })
        .addTo(map);
      parkPolys.push({ id: parkingArea.id, poly });
    });
  });
  ...
Take note that we are saving an association of polygon and parkingArea.id in an array. We’ll work on this later to make our map real-time. Ensure that the JSON server is running for this code to work. For now, refresh the page to see the updated results:
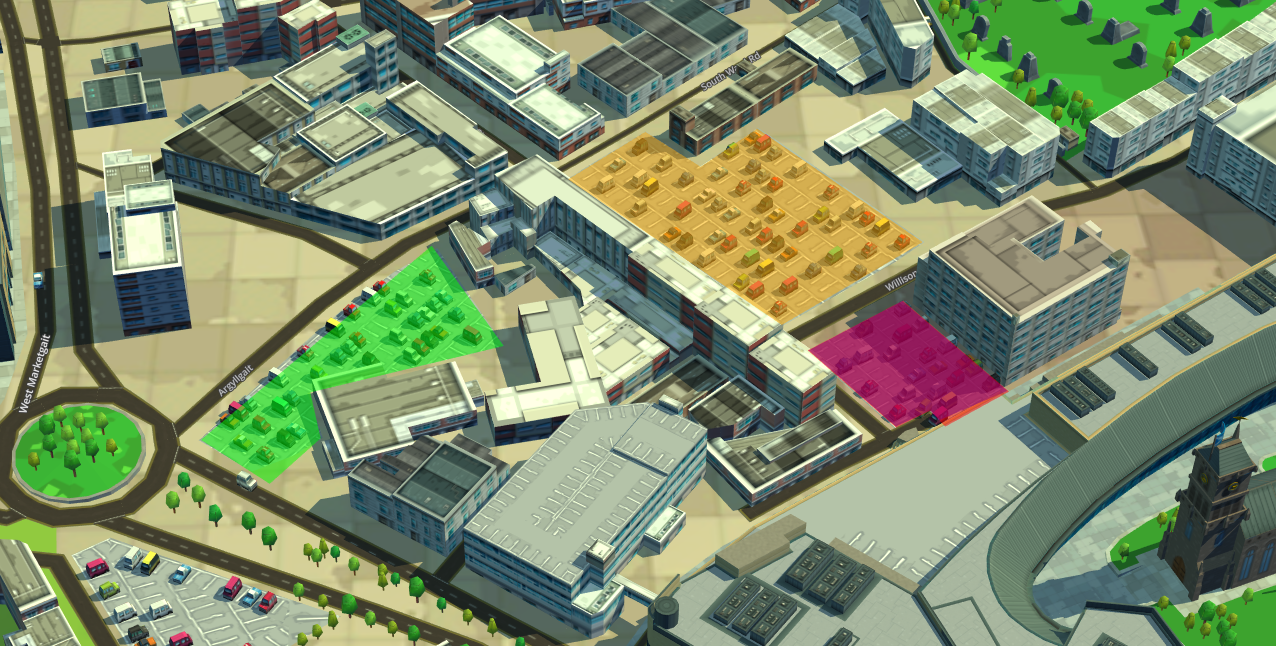
Pretty cool, isn’t it? Feel free to add color code labels to indicate their meaning. Now, the current limitation with the map is that users can’t see the map update unless they refresh the whole page. Let’s see how we can fix that.
4. Real-time Parking Zones
For this we’ll use the sockets.io library to implement real-time updates. The json server program we are using doesn’t support sockets.io natively. Hence we need to write our own custom implementation. First, let’s install the necessary dependencies:
yarn add json-server socket.io socket.io-client
Next, create the file server.js at the root of the project and copy this code:
const jsonServer = require('json-server');
// Initialize Socket.IO Server
const socketServer = require('http').createServer();
const io = require('socket.io')(socketServer);

// Initialize JSON Server
const server = jsonServer.create();
const router = jsonServer.router('./data/db.json');

// Set default middlewares (logger, static, cors and no-cache)
const middlewares = jsonServer.defaults();
server.use(middlewares);

// To handle POST, PUT and PATCH you need to use a body-parser
// You can use the one used by JSON Server
server.use(jsonServer.bodyParser);

// Broadcast `parkingAreas` PATCH requests
server.patch('/parkingAreas/:id', (req, res, next) => {
  const { id } = req.params;
  const { usedSlots } = req.body;
  console.log(`Parking Area ${id} updated to ${usedSlots} Used Slots`);
  io.emit('parkingAreas', { id, usedSlots });
  next(); // pass on to default logic
});

// Use default router
server.use(router);

// Bind JSON Server
server.listen(3000, () => {
  console.log('JSON Server is running at port 3000');
});

// Bind Socket.IO Server
socketServer.listen(3001, () => {
  console.log('Socket.IO Server is running at port 3001');
});
In the above code, we are setting up two server instances that will run concurrently. The first instance, json server will provide the API services on port 3000. The second instance, socket server, will provide real-time to socket clients that will connect to it at port 3001.
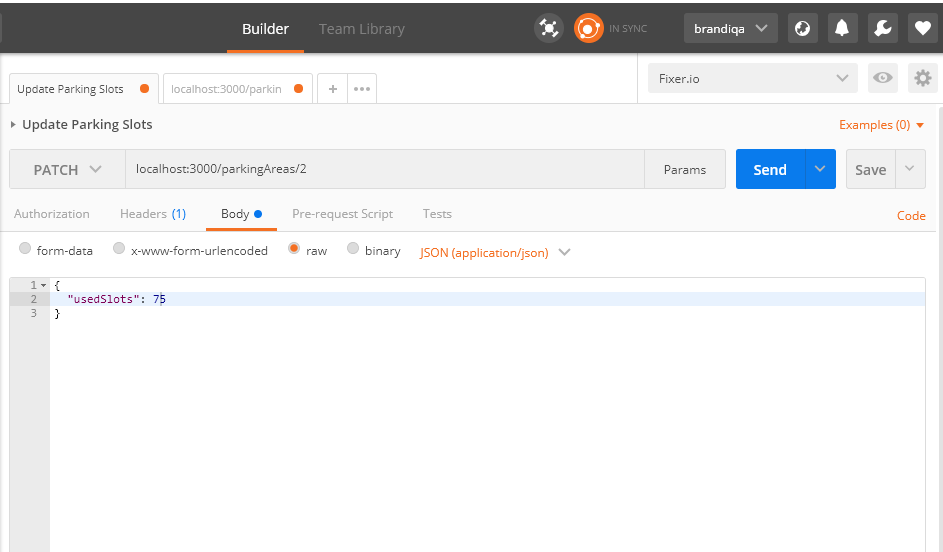
For this article, we’ll use Postman to send out updates on the capacity levels (usedSlots) for each parking lot. The HTTP method we’ll use is PATCH, which will allow us to update only a subset of a record. We can’t use the UPDATE method as that will overwrite the entire record, causing us to lose the polygon points data.
Back to our server code, you’ll notice that we have a patch function. Within this function, the id and usedSlots data is extracted and then broadcasted to any listening socket.io client.
Now that we’ve setup our server, it’s time to setup our client code to receive real-time updates. Go back to js/parking.js and copy the following code:
// Place this at the top section
const io = require('socket.io-client');
...
  // Place after `getColorCode` function
const updateParkingArea = async ({ id }) => {
  const parkingArea = await getParkingAreas(id);
  if (parkingArea) {
    const parkPoly = parkPolys.find(target => parkingArea.id === target.id);
    if (parkPoly) {
      parkPoly.poly.setColor(getColorCode(parkingArea));
    }
  }
};

const socket = io.connect('http://localhost:3001');

socket.on('connect', () => {
  console.log('connected to socket 3001');
  socket.on('parkingAreas', (data) => {
    console.log('parkingAreas event received');
    updateParkingArea(data);
  });
});
The client code here is pretty simple. We create a socket client instance that is bound to port 3001. We then set it up to listen for parkingAreas events, at which point the updateParkingArea() function is executed.
Please refer to the completed parking.js if in doubt about how the code is arranged.
Now let’s perform an experiment. First you need to cancel any existing processes. Next, start the custom JSON server code on a separate terminal. Then start the parking.html code on a separate terminal:
# Start server first
node server

# Start Parking Map App
parcel src/parking.html
Now open or refresh the page localhost:1234. To send updates to the JSON server, we’ll use Postman. Simply install it if you don’t have it. Once its open, create a new Request and enter the following parameters:
- Method – PATCH
- URL – localhost:3000/parkingAreas/2
- Content-Type – application/json
- Encoding – raw, JSON(application/json)
- Body –
{ "usedSlots": 75 }
In case you don’t know where the field Content-Type is, just click the Header tab. Here is a screenshot of Postman:
When you hit send, the update on the map happens instantly:
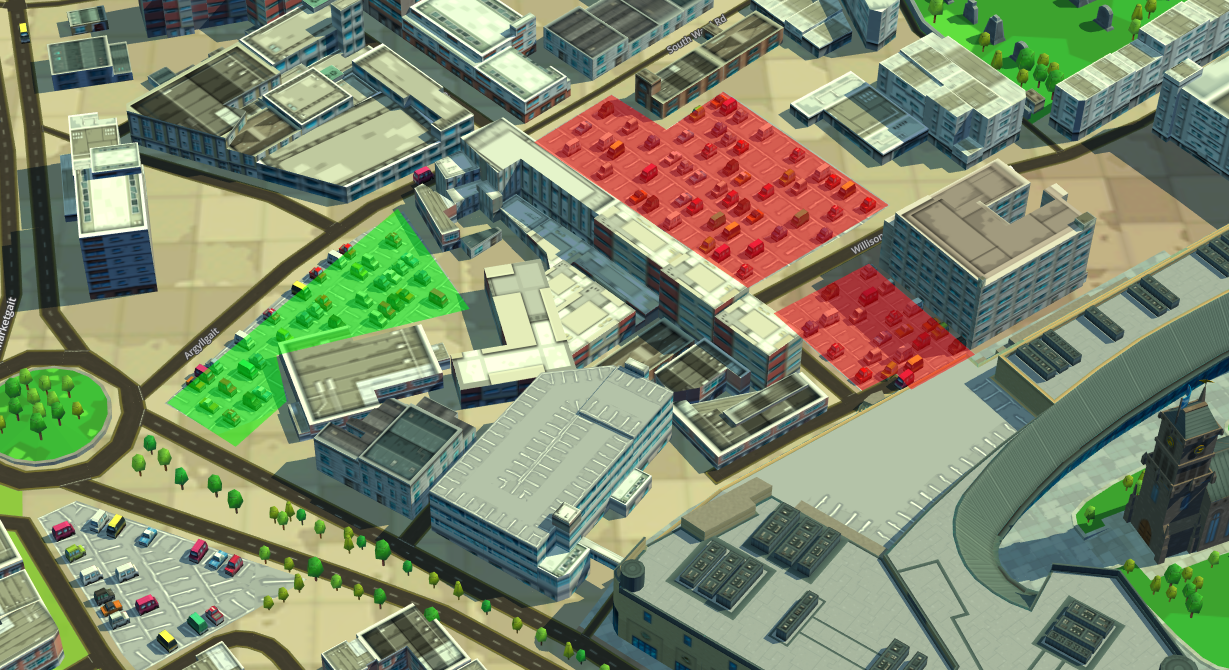
Feel free to play around with the value of usedSlots for other records and see the map update itself. Quite brilliant!
Summary
Now that we have come to the end of the tutorial, I hope that you’ve been amazed by the possibilities of what you can do with WRLD’s 3D maps. These demos that can be integrated with real world data, and the applications for WRLD in the real world, are endless.
For example, we can build a service that fetches data from actual parking sensors. For the mall map, we can display more interesting information, such as daily offers which can entice more people to visit the mall. This kind of technology doesn’t just apply to malls, but can be applied to other types of businesses and institutions. For example, you can integrate this map technology with an inventory management system. The map can be used to visualize where equipment is located on the business premises.
It’s truly up to you to come up with innovative products using the WRLD mapping platform.
Frequently Asked Questions (FAQs) about Creating a Mall Map with Real-Time Data
What are the benefits of using real-time data in a mall map?
Real-time data in a mall map provides a dynamic and interactive experience for users. It allows for the immediate update of store locations, opening hours, and special promotions. This can enhance the shopping experience by providing accurate and up-to-date information. It also allows mall management to track foot traffic and make data-driven decisions to improve mall operations.
How can I integrate real-time data into my mall map?
Integrating real-time data into your mall map requires a combination of data collection, data processing, and data visualization. You can collect data from various sources such as sensors, cameras, and mobile apps. Then, you can process this data using data analytics tools to extract meaningful insights. Finally, you can visualize this data on your mall map using mapping platforms like WRLD.
Can I customize the design of my mall map?
Yes, you can customize the design of your mall map to match your brand identity. This includes changing the color scheme, adding your logo, and customizing the layout. You can also add interactive elements such as clickable store icons and pop-up information boxes.
How can I make my mall map accessible to all users?
To make your mall map accessible to all users, you should consider factors such as color contrast, font size, and language options. You can also add features like voice navigation and wheelchair-friendly routes. Additionally, ensure that your map is mobile-friendly as many users will access it on their smartphones.
What are the challenges of creating a mall map with real-time data?
Creating a mall map with real-time data can be challenging due to the complexity of data collection and processing. It requires a robust data infrastructure and advanced data analytics skills. Additionally, ensuring data privacy and security can be a challenge as you will be dealing with sensitive customer data.
How can I update my mall map with new store locations?
You can update your mall map with new store locations by editing the data source. This can be done manually or automatically if you have a real-time data feed. You can also use mapping platforms that allow for easy updates and modifications.
Can I add promotional features to my mall map?
Yes, you can add promotional features to your mall map. This can include highlighting special offers, featuring new stores, and displaying ads. These features can help drive foot traffic to specific stores and increase sales.
How can I ensure the accuracy of my mall map?
Ensuring the accuracy of your mall map involves regular updates and data validation. You should also have a system in place for users to report errors or changes. Additionally, using reliable data sources and mapping platforms can help ensure accuracy.
Can I track user behavior on my mall map?
Yes, you can track user behavior on your mall map. This can include tracking which stores are most visited, which routes are most taken, and how long users spend on the map. This data can provide valuable insights for mall management and store owners.
How can I make my mall map more engaging for users?
To make your mall map more engaging for users, you can add interactive features such as 3D views, zoom and pan functions, and clickable store icons. You can also integrate social media features, allowing users to share their location or favorite stores.
I write clean, readable and modular code. I love learning new technologies that bring efficiencies and increased productivity to my workflow.


